
International Mathematics and Computer Science
OPEN ACCESS | Volume 1 - Issue 1 - 2026
ISSN No: - | Journal DOI: 10.61148/IMCS


Emmanuel Chinton
Independent Researcher, Department of Statistics, University of Cape Coast.
Corresponding author: Emmanuel Chinton, Independent Researcher, Department of Statistics, University of Cape Coast.
Received: August 05, 2026 | Accepted: August 22, 2026 | Published: September 04, 2026
Citation: Chinton E., (2026) “Continuous-Time Stochastic Models with Monte Carlo Simulation of Pension Assets Under Management in Ghana (2013–2024)” International Mathematics and Computer Science, 1(1); DOI: 10.61148/IMCS /001.
Copyright: © 2026 Emmanuel Chinton. This is an open access article distributed under the Creative Commons Attribution License, which permits unrestricted use, distribution, and reproduction in any medium, provided the original work is properly cited.
This paper develops and estimates a continuous-time stochastic framework for modelling the evolution of Ghana's pension assets under management (AUM) over the period 2013–2024, and applies Monte Carlo simulation to generate probabilistic forecasts through 2034. Using annual industry data published by the National Pensions Regulatory Authority (NPRA) for both the privately managed Tier 2 and Tier 3 schemes and the publicly administered Tier 1 Basic National Social Security Scheme (BNSS), the study specifies a correlated bivariate geometric Brownian motion (GBM) in which each AUM series follows its own drift and diffusion coefficients. Model parameters are estimated from log-returns using maximum-likelihood-consistent moment estimators, and 20,000 Monte Carlo paths are simulated to construct percentile forecast bands. To capture the discrete, event-driven risks associated with the 2022–2023 Domestic Debt Exchange Programme (DDEP) and the concentrated bond-refinancing obligations that fall due in 2027 and 2028, the base GBM is extended with a Merton-type compound Poisson jump-diffusion component. An out-of-sample backtest, in which the model is calibrated on 2012–2019 data and projected forward, produces a median absolute percentage error of 7.9% against realised 2020–2024 outcomes, with all realised values falling inside the simulated 5th–95th percentile band, providing reasonable empirical support for the specification. The results indicate that, absent a systemic shock, total pension AUM is likely to rise from GHS86.3 billion at end-2024 to a median of roughly GHS283 billion by 2029 and GHS925 billion by 2034, although the jump-diffusion stress scenario shows that concentrated refinancing risk around the 2027–2028 bond maturities could erode the median forecast by a non-trivial margin. The paper situates these quantitative findings within the qualitative evidence on DDEP-related liquidity, interest-rate, and refinancing risk, and on the sector's limited diversification into private capital, and closes with implications for pension-fund risk management, regulatory design, and future actuarial modelling in Ghana.
pension assets under management; continuous-time stochastic model; geometric Brownian motion; Monte Carlo simulation; jump-diffusion; Domestic Debt Exchange Programme; Ghana
1. Introduction
Ghana's pension industry has expanded rapidly since the three-tier system was introduced under the National Pensions Act of 2008, with total industry assets rising from single-digit billions of Ghana cedis in the early 2010s to over GHS86 billion by the end of 2024 (National Pensions Regulatory Authority (NPRA), various years). This growth has coincided with a period of considerable macroeconomic turbulence, most notably Ghana's 2022 sovereign debt crisis and the subsequent Domestic Debt Exchange Programme (DDEP), which restructured a substantial share of government securities held by pension funds, insurers, and banks. Because Ghanaian pension schemes are heavily concentrated in government debt instruments, understanding how the sector's asset base is likely to evolve, and how exposed it is to episodic macro-financial shocks, is a first-order question for trustees, regulators, and contributors alike.
Existing assessments of the Ghanaian pension sector have been predominantly descriptive and retrospective, documenting the terms of the DDEP exchange, the resulting cash-flow and liquidity effects on selected pension schemes, and the sector's limited diversification into equities and alternative assets (Boakye, Bokpin, Ofori, & Nkrumah, 2024; African Private Capital Association [AVCA], 2025). What has been largely absent from the literature is a forward-looking, probabilistic treatment of how the pension asset base itself is likely to evolve under uncertainty. This paper addresses that gap by treating the aggregate pension asset-under-management series as a continuous-time stochastic process, estimating its parameters from twelve years of annual NPRA data (2012–2024), and using Monte Carlo methods to simulate a distribution of plausible future outcomes rather than a single deterministic trend.
The specific contributions of the paper are threefold. First, it formalises the AUM growth process for both the privately managed Tier 2/3 schemes and the publicly managed Tier 1 BNSS scheme as a correlated bivariate geometric Brownian motion (GBM), allowing the two sub-sectors' distinct growth and volatility dynamics, and their co-movement, to be captured explicitly. Second, it augments the base diffusion model with a compound Poisson jump component in the spirit of Merton (1976), calibrated to reflect the type of discrete, adverse revaluation event exemplified by the DDEP and by the concentrated bond-principal repayments scheduled for 2027 and 2028. Third, it validates the modelling approach through an out-of-sample backtest, in which parameters estimated on the pre-DDEP sub-sample (2012–2019) are used to simulate the 2020–2024 path and compared against realised outcomes.
The remainder of the paper is organised as follows. Section 2 reviews the relevant literature on continuous-time asset models and Monte Carlo methods in pension and actuarial finance. Section 3 summarises the institutional background of Ghana's pension system and the DDEP, drawing on the assessment published by the Africa Centre for Energy Policy (ACEP) and the AVCA survey of pension providers. Section 4 sets out the data and the stochastic modelling methodology. Section 5 presents the empirical results, including the base-case and stress simulations and the backtest. Section 6 discusses the findings in light of the qualitative DDEP evidence, and Section 7 concludes with policy implications.
2. Literature Review
The use of continuous-time stochastic processes to describe the evolution of financial and actuarial quantities dates to the foundational work of Black and Scholes (1973) and Merton (1973), who modelled asset prices as Geometric Brownian Motion in continuous time. In this framework, the logarithm of an asset's value follows a Brownian motion with drift, implying that percentage changes are independently and identically log-normally distributed over non-overlapping intervals. Although originally developed for option pricing, GBM has since become a standard building block in actuarial and pension-fund modelling, where it is used to project the evolution of fund assets, contribution bases, and liabilities under uncertainty (Cairns, Blake, & Dowd, 2006).
A well-documented limitation of pure GBM is its inability to accommodate the sudden, discontinuous revaluations that characterise sovereign debt crises, currency devaluations, and debt-restructuring events. Merton (1976) addressed this by augmenting the diffusion process with a compound Poisson jump component, producing a jump-diffusion process capable of generating fat-tailed return distributions consistent with observed crisis dynamics. Jump-diffusion and related regime-switching specifications have subsequently been applied to sovereign bond markets and pension-fund asset allocation problems in emerging markets, where debt restructurings and currency shocks are recurrent features of the investment environment (Hainaut, 2010).
Monte Carlo simulation is the standard numerical technique for generating the probability distribution of a stochastic process' future values when closed-form solutions are unavailable or when path-dependent quantities, such as percentile bands, are of interest (Glasserman, 2004). In pension economics specifically, Monte Carlo methods have been used extensively to assess funding adequacy, project defined-contribution account balances, and stress-test scheme solvency under alternative capital-market scenarios (Blake, Cairns, & Dowd, 2001). Despite this broad usage internationally, applications of continuous-time stochastic and Monte Carlo methods to African pension systems remain scarce, and no prior study, to this author's knowledge, has modelled Ghana's aggregate pension AUM series in this way.
The Ghana-specific literature that does exist is primarily descriptive. The ACEP assessment of the DDEP's impact on the pensions sector documents the mechanics of the pension-specific bond exchange concluded in September 2023, the resulting maturity concentration in 2027 and 2028, and the sector's continuing concentration in government securities (Boakye et al., 2024). The AVCA survey of Ghanaian pension providers similarly documents the sector's asset growth to GHS86.4 billion by end-2024 and its very limited allocation, roughly one percent of assets, to private capital and alternative investments (AVCA, 2025). Both studies provide the qualitative and institutional grounding for the quantitative exercise undertaken in this paper, but neither develops a formal stochastic model of the AUM growth process itself.
3. Institutional Background
3.1 Ghana's Three-Tier Pension System
Ghana's contributory pension system, established under the National Pensions Act of 2008, comprises three tiers. Tier 1 is a mandatory, defined-benefit scheme administered by the Social Security and National Insurance Trust (SSNIT), financed from an employee payroll contribution, of which the bulk is retained for pension benefits and a smaller share is redirected to the National Health Insurance Scheme. Tier 2 is a mandatory, privately managed occupational scheme funded by a further payroll contribution and invested by licensed pension fund managers. Tier 3 is a voluntary, tax-advantaged provident and personal pension scheme that further supplements retirement savings. Tier 2 and Tier 3 assets are collectively referred to as the privately managed segment of the industry, overseen by the National Pensions Regulatory Authority (NPRA), while Tier 1 assets fall under the Basic National Social Security Scheme (BNSS) administered by SSNIT.
NPRA investment guidelines cap the share of Tier 2 and 3 assets that may be held in government securities at 75 percent, with smaller permitted allocations to corporate debt, bank instruments, listed equities, collective investment schemes, and alternative investments. In practice, government securities have historically accounted for close to 70 percent of Tier 2 and 3 assets, with a further significant share indirectly exposed to government risk through local-government and statutory-agency bonds and through bank deposits that are themselves substantially invested in government debt (Boakye et al., 2024).
3.2 The Domestic Debt Exchange Programme
Facing an unsustainable public debt position, the Government of Ghana launched the Domestic Debt Exchange Programme in December 2022 as a precondition for securing a new Extended Credit Facility from the International Monetary Fund. The pensions sector was initially excluded from the exchange following opposition from organised labour, but a separate, alternative offer was subsequently negotiated and concluded in September 2023, under which eligible pension-held bonds were exchanged for new instruments maturing in 2027 and 2028, carrying an interest-only warrant intended to preserve the effective coupon rate relative to the original bonds. Reported participation in the pension-specific exchange exceeded 95 percent of eligible principal (Boakye et al., 2024).
While the pension-specific terms were structured so that the net present value impact would be broadly neutral relative to the original bonds, the exchange nonetheless deferred principal repayments that had previously been spread across 2023 through 2039 into a concentrated repayment schedule falling due in 2027 and 2028. This maturity concentration raises the government's own refinancing risk in those years and, by extension, introduces default and rollover risk into the pension sector's asset base that did not exist under the original, more evenly laddered bond schedule. The DDEP assessment further documents that post-exchange liquidity conditions for Tier 3 schemes deteriorated markedly, with the typical time required to meet member withdrawal requests lengthening from roughly two to four weeks before the restructuring to between three and six months afterward.
3.3 Diversification and Exposure to Private Capital
A parallel body of evidence from the AVCA survey of Ghanaian pension providers indicates that, notwithstanding the sector's rapid asset growth, portfolio diversification away from government securities remains limited. At the end of 2024, government securities still accounted for close to 73 percent of total pension assets, just below the 75 percent regulatory ceiling, while allocations to private equity, venture capital, infrastructure, and other alternative asset classes stood at only around 1.1 percent of assets, well below the 25 percent regulatory allowance for alternatives (AVCA, 2025). Currency risk, limited market data, regulatory constraints on locally domiciled fund vehicles, and internal capacity gaps at pension fund managers and corporate trustees were the barriers most frequently cited by survey respondents as impediments to greater diversification. This continuing concentration in government debt is directly relevant to the stochastic modelling exercise that follows, since it implies that the pension AUM series analysed in this paper remains closely linked to the same sovereign credit and macroeconomic dynamics that produced the 2022 debt crisis and the DDEP.
4. Data and Methodology
4.1 Data
Annual year-end AUM figures for Ghana's private pension sector (Tier 2 and Tier 3, in GHS billion) and for the publicly administered BNSS scheme (Tier 1, in GHS billion) were assembled for the period 2012–2024, sourced from NPRA annual reports. Total pension AUM is defined as the sum of the private and public series in each year. The end-2024 total of GHS86.3 billion implied by these series is consistent with the independently reported end-2024 industry total of GHS86.4 billion published by AVCA (2025), providing a useful cross-check on data quality.
Table 1 reports the full annual series used in estimation.
|
Year |
Private (Tier 2 & 3) AUM (GHS bn) |
Public (BNSS/Tier 1) AUM (GHS bn) |
Total AUM (GHS bn) |
|
2012 |
4.0 |
0.8 |
4.8 |
|
2013 |
4.8 |
1.3 |
6.1 |
|
2014 |
7.4 |
2.6 |
10.0 |
|
2015 |
8.8 |
4.7 |
13.5 |
|
2016 |
8.9 |
6.8 |
15.7 |
|
2017 |
9.8 |
11.0 |
20.8 |
|
2018 |
13.0 |
9.2 |
22.2 |
|
2019 |
17.3 |
8.9 |
26.2 |
|
2020 |
22.0 |
11.4 |
33.4 |
|
2021 |
28.0 |
11.5 |
39.5 |
|
2022 |
35.3 |
12.1 |
47.4 |
|
2023 |
46.5 |
15.2 |
61.7 |
|
2024 |
63.8 |
22.5 |
86.3 |
Table 1. Ghana pension sector assets under management, 2012–2024. Source: NPRA Annual Reports.
Log-returns for each series are computed as rt = ln (St
 / St-1
 ) for t = 2013, …, 2024, yielding twelve annual observations per series. All simulation and estimation work was carried out in Python 3 using NumPy, pandas, and Matplotlib.
4.2 Continuous-Time Model Specification
The private and public AUM series, SP t and Sg t
 respectively, are each modelled as a Geometric Brownian Motion:
dSit=μiSit dt + σiSitdWit, i ∈ p, g
where μi is the instantaneous drift (expected annual log-growth rate) of series i, σi
 is its instantaneous volatility, and Wit
 is a standard Brownian motion. The two Brownian motions are permitted to be correlated, with dWptdWgt
 = ρ
= ρ dt, reflecting the fact that private and public pension assets are both ultimately exposed to the same macroeconomic and fiscal environment, even though their year-to-year growth need not move in lockstep. Under this specification, each series admits the closed-form solution Sit
 = Si0e[μi-0.5σi2 t + σi Wit]
 , so that S_i(t) is log-normally distributed conditional on Si
 (0). Total pension AUM, STt
 = Spt
= Spt + Sgt
+ Sgt , is a sum of correlated log-normal variables and therefore does not itself follow a GBM in closed form; its distribution is instead characterised numerically through Monte Carlo simulation.
4.3 Parameter Estimation
The drift and volatility parameters for each series are estimated from the sample mean and sample standard deviation of annual log-returns, which correspond to the maximum-likelihood estimators of μi-0.5σi2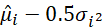 and σi under the assumption that log-returns are independently and identically normally distributed:
μi=ri+0.5Si2, Si=Si
where ri  and Si are the sample mean and sample standard deviation of the log-returns of series i. The correlation coefficient rho is estimated as the Pearson correlation between the private and public log-return series. Table 2 reports the resulting estimates over the full 2013–2024 sample.
Table 2. Calibrated GBM parameters, 2013–2024 (n = 12 annual log-returns). Correlation between private and public log-returns, ρ = −0.087.
|
Series |
μ |
σ |
Implied CAGR |
|
Private (Tier 2 & 3) |
23.08% |
10.79% |
25.96% |
|
Public (BNSS / Tier 1) |
27.81% |
27.13% |
32.06% |
|
Total AUM (univariate) |
24.08% |
10.96% |
27.22% |
Two features of Table 2 are noteworthy. First, the public BNSS series exhibits substantially higher volatility (27.1 %) than the private Tier 2/3 series (10.8%), reflecting the smaller base and lumpier year-to-year growth of the publicly administered scheme, including a marked deceleration in 2018–2019 followed by renewed acceleration. Second, the estimated correlation between the two series is close to zero and mildly negative, indicating that private and public AUM growth in Ghana have historically been driven by largely distinct, rather than common, year-to-year factors, even though both are ultimately exposed to the same underlying macroeconomic environment over longer horizons.
To assess whether the DDEP period altered the underlying return-generating process, the total-AUM log-returns were additionally split into a pre-DDEP sub-sample (2013–2021, n = 9) and a DDEP/post-DDEP sub-sample (2022–2024, n = 3). The pre-DDEP sub-sample exhibits μ = 23.4 % and σ
 = 12.2 %, while the DDEP/post sub-sample exhibits μ = 26.1% and σ = 7.7 %. At face value, nominal AUM growth did not decelerate during the DDEP period; this is consistent with the ACEP finding that the pension-specific exchange preserved the effective coupon rate and therefore did not, in nominal accounting terms, reduce the book value of pension assets. However, because the three post-DDEP observations are too few to support robust separate inference and because the DDEP's principal risk lies in the concentrated 2027–2028 refinancing exposure that has not yet been realised, the paper does not rely on the sub-sample split for the main forecasts, and instead represents DDEP-type risk explicitly through the jump-diffusion extension described in Section 4.4.
4.4 Monte Carlo Simulation Procedure
Forecasts are generated by simulating N = 20,000 correlated sample paths of the bivariate GBM from the end-2024 base values, SP 0 = GHS63.8 billion and Sg 0
 = GHS22.5 billion, over a ten-year horizon (2025–2034) using annual time steps (dt = 1). Correlated standard normal innovations are generated via Cholesky decomposition of the 2×2 correlation matrix, and each series is propagated using the exact log-normal transition Si t+1
 = Si t
 e[μi-0.5σi2dt + σi (dt) Zit]
 with Zi t
 the correlated standard normal shocks. At each simulated year, total AUM is computed as the sum of the two simulated series, and the 5th, 25th, 50th (median), 75th, and 95th percentiles of the resulting cross-sectional distribution are reported, together with the sample mean.
4.5 Jump-Diffusion Stress Extension
To capture the possibility of a discrete, DDEP-type adverse revaluation or liquidity event, most plausibly triggered by the government's concentrated bond-refinancing obligations in 2027 and 2028, the base GBM is extended with a compound Poisson jump process in the manner of Merton (1976):
dSi t = (μi -λk) Si tdt+σi) Si t dWi t+ Si t-ej-1dN(t)
where N(t) is a Poisson process with annual intensity lambda, J is the random log-jump size, drawn as J ~ Normal (jump-mean, jump-std) whenever a jump occurs, and k = E[eJ ] − 1 is the compensator that keeps the risk-neutral-equivalent drift consistent in expectation. For the stress scenario, λ
  is set to 0.10, corresponding to an assumed 10% annual probability of a distress event in any given year, broadly consistent with the roughly decade-scale recurrence of sovereign debt crises and restructurings observed in Ghana's own IMF-programme history. The jump-size distribution is calibrated with a mean of −8% and a standard deviation of 4% in log terms, intended to represent an adverse revaluation or liquidity shock of a magnitude comparable to, though somewhat more severe in year-of-impact terms than, the maturity-extension and coupon effects documented for the DDEP pension exchange. This calibration is a stylised, illustrative stress assumption rather than an estimate drawn from a long historical jump record, since Ghana's pension sector has experienced only one such restructuring event within the sample period; it is intended to bound plausible downside risk around the base-case forecast rather than to serve as a point prediction.
4.6 Model Validation
As a check on out-of-sample performance, the model is re-calibrated using only the 2012–2019 sub-sample and used to simulate the 2020–2024 path, which is then compared against the AUM values actually realised over that period, none of which were used in calibration. This backtest window is informative precisely because it spans both the COVID-19 shock of 2020 and the onset of the debt crisis and DDEP in 2022–2023, providing a genuine out-of-sample test of the model's ability to bracket realised outcomes through a period of significant macro-financial stress.
5. Empirical Results
5.1 Historical Trends
Total pension AUM in Ghana grew from GHS4.8 billion at end-2012 to GHS86.3 billion at end-2024, an implied compound annual growth rate of 27.2 percent over the twelve-year period. Growth was not monotonic in percentage terms: annual log-returns ranged from a low of 6.5 percent in 2018 to a high of 49.4 percent in 2014, with a further deceleration to 15.1 percent in 2016 followed by renewed acceleration into the 20–34 percent range from 2020 onward. The private Tier 2/3 segment grew somewhat faster in compound terms (25.96 percent CAGR) than the industry as a whole prior to weighting, while the smaller public BNSS segment exhibited the highest CAGR (32.06 percent) alongside substantially higher year-to-year volatility, including a contraction in nominal BNSS assets in 2018.
5.2 Base-Case Monte Carlo Forecast
Table 3 reports the percentile forecasts for total pension AUM generated from 20,000 simulated paths of the base (non-jump) bivariate GBM, calibrated on the full 2013–2024 sample.
Table 3. Base-case Monte Carlo forecast of total pension AUM, GHS billion, 2025–2034 (N = 20,000 simulated paths). All figures rounded to one decimal place.
|
Year |
P5 |
P25 |
Median (P50) |
P75 |
P95 |
Mean |
|
2025 |
92.4 |
102.2 |
109.6 |
117.7 |
130.2 |
110.3 |
|
2026 |
109.0 |
125.6 |
138.6 |
153.7 |
178.2 |
140.6 |
|
2027 |
131.5 |
155.5 |
175.7 |
199.3 |
240.9 |
179.6 |
|
2028 |
159.1 |
193.6 |
222.6 |
257.6 |
323.4 |
229.6 |
|
2029 |
193.8 |
241.3 |
282.7 |
332.0 |
431.8 |
293.7 |
|
2030 |
237.1 |
301.7 |
358.4 |
429.1 |
574.1 |
376.2 |
|
2031 |
290.1 |
377.1 |
454.5 |
551.4 |
759.8 |
480.7 |
|
2032 |
355.9 |
470.6 |
575.8 |
710.7 |
1006.0 |
616.2 |
|
2033 |
437.8 |
588.5 |
730.6 |
918.1 |
1326.2 |
789.8 |
|
2034 |
535.8 |
734.8 |
924.7 |
1180.7 |
1768.0 |
1011.9 |
The median base-case forecast places total pension AUM at approximately GHS175.7 billion by 2027 (the first of the concentrated DDEP maturity years), GHS282.7 billion by 2029, and GHS924.7 billion by 2034. The width of the percentile band widens rapidly with the forecast horizon, as is characteristic of geometric Brownian motion, whose variance grows with the square of elapsed time under the log-normal transition; the ratio of the 95th to the 5th percentile increases from roughly 1.4 at the one-year horizon to more than 3.3 at the ten-year horizon. Under the base-case model, the probability of total AUM exceeding GHS150 billion by 2029 is 99.7%, and the probability of exceeding GHS200 billion by the same year is 93.5%, indicating that continued substantial nominal growth in the sector's asset base is the modal outcome under historical trend dynamics.
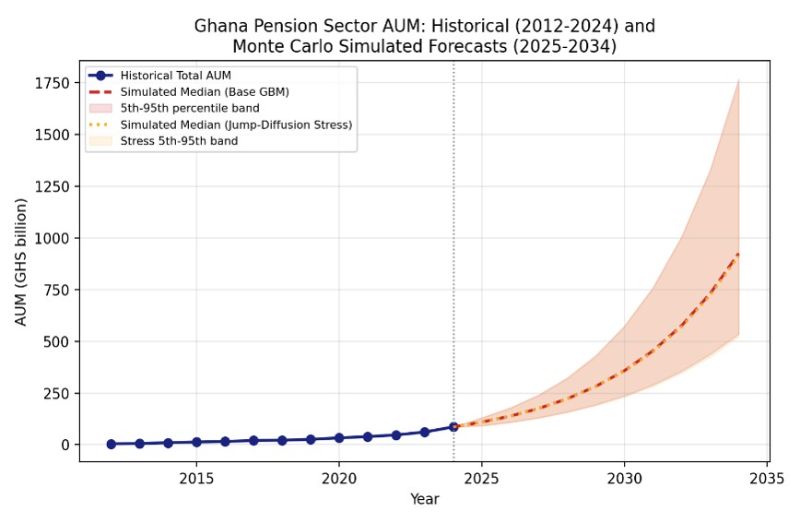
Figure 1. Historical total pension AUM (2012–2024) and Monte Carlo fan chart of base-case and jump-diffusion stress forecasts (2025–2034).
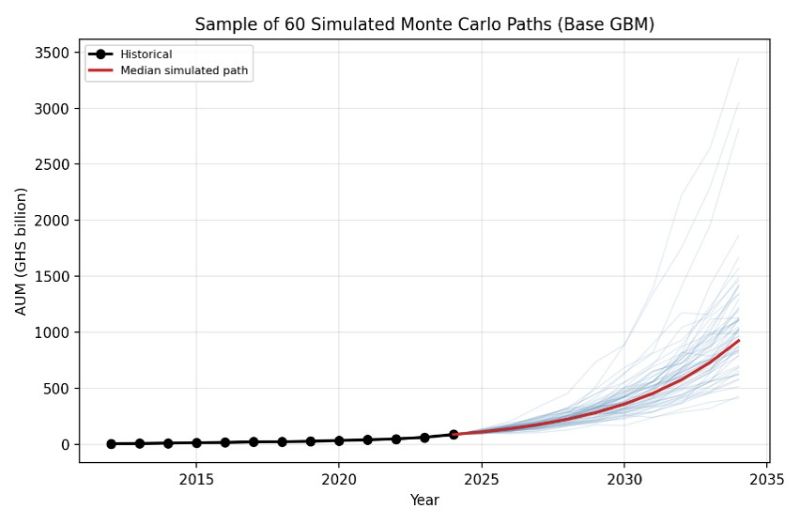
Figure 2. Sample of 60 individual simulated Monte Carlo paths under the base-case bivariate GBM, illustrating path-level dispersion around the median forecast.
5.3 Terminal Distribution
Figure 3 shows the simulated cross-sectional distribution of total AUM at the 2029 and 2034 horizons. Both distributions are right-skewed, a direct consequence of the log-normal transition underlying GBM: because log-AUM is normally distributed, the level of AUM itself has a longer right tail than left tail, so that upside outcomes, while individually less probable, can be substantially larger in absolute terms than downside outcomes are small. This skewness has practical implications for any deterministic point forecast, which would understate the genuine range of plausible outcomes, particularly at longer horizons.
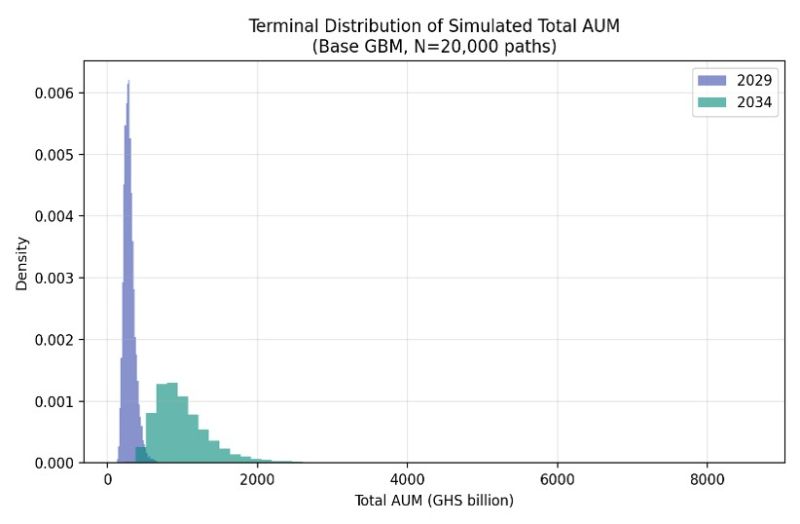
Figure 3. Simulated terminal distribution of total pension AUM at the 2029 and 2034 horizons (base-case GBM, N = 20,000 paths).
5.4 Jump-Diffusion Stress Scenario
Table 4 reports the corresponding percentile forecasts under the jump-diffusion stress specification described in Section 4.5, in which a 10% annual probability is assigned to a discrete adverse revaluation event.
Table 4. Jump-diffusion stress forecast of total pension AUM, GHS billion, 2025–2034 (lambda = 0.10, jump mean = −8%, jump std = 4%; N = 20,000 simulated paths).
|
Year |
P5 |
P25 |
Median (P50) |
P75 |
P95 |
Mean |
|
2025 |
92.3 |
102.0 |
109.4 |
117.6 |
130.6 |
110.1 |
|
2026 |
108.5 |
125.4 |
138.6 |
153.5 |
178.8 |
140.4 |
|
2027 |
129.7 |
155.1 |
175.3 |
199.3 |
241.1 |
179.2 |
|
2028 |
156.7 |
192.4 |
221.9 |
257.4 |
321.6 |
228.7 |
|
2029 |
190.0 |
239.4 |
282.4 |
332.1 |
427.9 |
292.4 |
|
2030 |
231.2 |
297.1 |
356.3 |
427.3 |
572.7 |
373.3 |
|
2031 |
283.0 |
371.6 |
449.6 |
551.0 |
758.3 |
477.3 |
|
2032 |
347.8 |
463.5 |
569.9 |
707.8 |
1002.2 |
610.0 |
|
2033 |
425.0 |
578.7 |
722.7 |
910.4 |
1326.4 |
780.9 |
|
2034 |
524.0 |
722.5 |
913.3 |
1168.9 |
1742.8 |
998.1 |
The median forecast under the stress scenario is close to the base case at short horizons but diverges progressively at longer horizons, as the compounding effect of the periodic jump risk accumulates. By 2029, the median stress forecast of GHS282.4 billion is essentially indistinguishable from the base-case median, a difference of only about GHS0.3 billion, reflecting the fact that with a 10 percent annual jump probability only a small fraction of five-year paths experience a realised jump. By 2034, however, the median stress forecast of GHS913.3 billion falls roughly GHS11.5 billion below the base-case median of GHS924.7 billion, and the left tail of the stress distribution (5th percentile of GHS524.0 billion) is visibly thinner than the corresponding base-case tail (GHS535.8 billion). These results suggest that concentrated refinancing risk of the type associated with the 2027–2028 DDEP bond maturities is more consequential for the sector's long-run asset trajectory than for its near-term outlook, underscoring the importance of successful government refinancing in those specific years for the sector's medium-term health.
5.5 Model Validation: Out-of-Sample Backtest
Table 5 reports the results of the out-of-sample backtest, in which GBM parameters are estimated using only 2012–2019 data and used to simulate forward to 2024, a period that includes both the COVID-19 shock and the onset of the debt crisis and DDEP.
Table 5. Out-of-sample backtest: model calibrated on 2012–2019 data, simulated forward against realised 2020–2024 total AUM (GHS billion).
|
Year |
Simulated Median |
Simulated P5 |
Simulated P95 |
Actual |
|
2019 |
26.2 |
26.2 |
26.2 |
26.2 |
|
2020 |
33.5 |
26.6 |
42.8 |
33.4 |
|
2021 |
42.7 |
30.7 |
61.5 |
39.5 |
|
2022 |
54.5 |
36.3 |
87.5 |
47.4 |
|
2023 |
69.6 |
43.3 |
123.2 |
61.7 |
|
2024 |
89.0 |
52.2 |
173.8 |
86.3 |
Across the five out-of-sample years (2020–2024), the median simulated path tracks realised AUM with a mean absolute percentage error of 7.9%, and every realised annual value falls within the simulated 5th–95th percentile band, including the years most directly affected by the debt crisis and DDEP (2022 and 2023). The simulated median modestly overstates realised AUM from 2021 onward, consistent with the DDEP's dampening effect on nominal asset growth relative to the pre-crisis trend embedded in the 2012–2019 calibration period, even though, as discussed above, the pension-specific exchange terms were designed to preserve book value. This pattern, a persistent but moderate positive forecast bias rather than a large one, is consistent with the qualitative finding that the DDEP's impact on pension funds was real but comparatively contained relative to its impact on banks and insurers (Boakye et al., 2024).
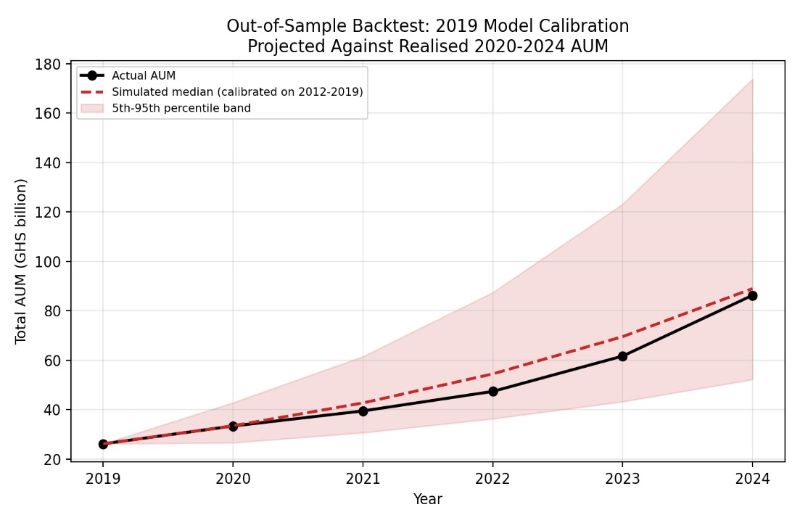
Figure 4. Out-of-sample backtest: simulated 2020–2024 forecast band (calibrated on 2012–2019 data) against realised total AUM.
6. Discussion
The quantitative results developed here are broadly consistent with, and help to formalise, the qualitative risk narrative documented in the ACEP assessment of the DDEP's impact on Ghana's pension sector. That assessment finds that the pension-specific debt exchange was structured to preserve the effective coupon rate and, therefore, had limited immediate impact on the book value of pension assets, while nonetheless introducing meaningful liquidity risk, through deferred principal repayments, and refinancing risk, through the concentration of maturities in 2027 and 2028 (Boakye et al., 2024). The stochastic model's finding that the base-case and jump-diffusion stress forecasts diverge only modestly through 2029 but more substantially by 2034 is consistent with this characterisation: the near-term nominal growth trajectory of the sector appears comparatively insulated from DDEP-specific risk, but the cumulative, compounding cost of repeated distress events, of which a 2027–2028 refinancing shortfall is the most immediate candidate, becomes materially larger over a longer horizon.
The finding of near-zero correlation between private (Tier 2/3) and public (BNSS/Tier 1) AUM growth is also informative in light of the AVCA survey evidence on the sector's asset composition. Because both segments remain heavily concentrated in government securities, either directly or, in the case of the private segment, indirectly through bank deposits and local-government instruments, a genuinely diversifying macro-financial shock, such as a sovereign refinancing failure, would be expected eventually to affect both segments simultaneously, even though their year-to-year nominal growth rates have historically been driven by largely separate factors, such as differing contribution bases and scheme maturity. This suggests that the low historical correlation estimated here should not be read as evidence of risk diversification between the two segments, and the paper's jump-diffusion specification, which applies correlated jump risk to both series, is intended to reflect this underlying common exposure to sovereign credit risk rather than the low correlation in ordinary-year log-returns.
The AVCA survey further documents that only around 1.1 percent of Ghanaian pension assets were allocated to private capital and alternative investments as of end-2024, notwithstanding a regulatory ceiling of 25 percent, with currency risk, data opacity, and regulatory and structural barriers cited as the principal impediments to greater diversification (AVCA, 2025). From the perspective of the stochastic model developed in this paper, this concentration implies that the assumptions underlying both the base-case and jump-diffusion specifications, namely that private and public pension AUM growth remain closely tied to Ghana's sovereign fiscal and macroeconomic trajectory, are likely to remain valid for the foreseeable future unless the recently announced 2025 government directive requiring a minimum 5 percent allocation to private equity and venture capital by 2026 is implemented at scale and materially alters the sector's risk-return profile.
7. Policy and Practical Implications
Several implications follow from the modelling results for pension-fund trustees, fund managers, and the NPRA as regulator. First, the substantial widening of the forecast percentile band at longer horizons is a reminder that deterministic, single-point AUM projections, of the kind commonly used in scheme-level planning, are likely to understate the genuine range of plausible future outcomes; trustees and fund managers would benefit from incorporating probabilistic, scenario-based projections of the type illustrated here into strategic asset allocation and liquidity planning, particularly ahead of the 2027–2028 bond maturities identified as a key refinancing risk in both the DDEP assessment and the jump-diffusion results of this paper.
Second, the relatively larger divergence between the base-case and stress forecasts at the ten-year, rather than five-year, horizon suggests that the most consequential risk-management window is not necessarily the immediate 2027–2028 maturity dates themselves, but rather the cumulative effect of whether the government successfully refinances those obligations without recourse to a further restructuring. This argues for close monitoring of Ghana's fiscal and debt-sustainability trajectory through the remainder of the current IMF programme period, alongside continued diversification efforts of the kind recommended in both the ACEP and AVCA reports, including expanded use of the NPRA's alternative-investment allowance, deepening of the Ghana Stock Exchange, and progress on the regulatory reforms, such as recognition of Limited Partnership fund structures, needed to make locally domiciled private capital vehicles more accessible to pension investors.
Third, from a methodological standpoint, the reasonably favorable backtest performance of the correlated bivariate GBM, despite its underlying assumption of constant drift and volatility, suggests that continuous-time stochastic models of this type offer a useful and computationally tractable starting point for actuarial and regulatory stress-testing of the Ghanaian pension sector, even though the jump-diffusion extension developed here should be treated as an illustrative stress overlay pending the availability of a longer historical record of debt-restructuring events from which jump parameters could be estimated with greater precision.
8. Conclusion
This paper has developed a continuous-time stochastic model of Ghana's pension sector assets under management over 2013–2024 and used Monte Carlo simulation to generate probabilistic forecasts through 2034, extending the model with a jump-diffusion component calibrated to reflect the type of discrete refinancing risk associated with the 2022–2023 Domestic Debt Exchange Programme and the concentrated bond maturities scheduled for 2027 and 2028. The base-case model, an out-of-sample backtest against realised 2020–2024 outcomes, most of which occurred during a period of significant macro-financial stress, bracketed all realised values within its simulated percentile band and achieved a median absolute forecast error of under 8%, providing reasonable support for the modelling approach. The results indicate that continued substantial nominal growth in Ghana's pension asset base is the most probable outcome absent a further systemic shock, but that the cumulative risk associated with concentrated sovereign refinancing obligations becomes materially more consequential for the sector's asset trajectory over longer, rather than shorter, forecast horizons. These findings reinforce, and add quantitative structure to, the qualitative risk assessment documented in the existing literature on the DDEP's impact on Ghana's pensions sector, and point toward a continuing need for diversification away from government securities, closer monitoring of the 2027–2028 refinancing window, and wider adoption of probabilistic, rather than purely deterministic, approaches to pension-asset planning in Ghana.

Open Access By Aditum Open Access Journals id licensed under Creative Commons Attribution 4.0 International License. Based On a Work at aditum.org


