Journal of Veterinary Medicine And Science
OPEN ACCESS | Volume 3 - Issue 1 - 2026
ISSN No: 3065-7075 | Journal DOI: 10.61148/3065-7075/JVMS


Kefelegn Kebede1*, Ibsadin Mohammed1, Biazen Abrar1
1School of Animal and Range Sciences, Haramaya University, Ethiopia.
*Corresponding author: Kefelegn Kebede, School of Animal and Range Sciences, Haramaya University, Ethiopia..
Received: July 05, 2026 | Accepted: July 15, 2026 | Published: July 22, 2026
Citation: Kebede K, Mohammed I, Abrar B, (2026). “Prediction of Body Weight from Indigenous Chicken Morphometric Traits Using Regression Tree Algorithm”. Journal of Veterinary Medicine and Science, 3(1); DOI: 10.61148/3065-7075/JVMS/054.
Copyright: © 2026 Kefelegn Kebede. This is an open access article distributed aunder the Creative Commons Attribution License, which permits unrestricted use, distribution, and reproduction in any medium, provided the original work is properly cited.
Ethiopian indigenous chickens possess remarkable adaptive traits suited to low-input scavenging systems, but their productivity is limited by suboptimal management, disease burdens, and progressive genetic erosion from indiscriminate crossbreeding. Accurate body weight assessment is essential for breeding and management, yet calibrated weighing equipment is rarely available in village settings, creating a critical gap between research needs and field feasibility. This study aimed to quantify associations between body weight and morphometric traits in indigenous chickens and to develop a regression tree-based predictive model for practical field application. Indigenous chickens aged 6 months or older were sampled. Measurements followed FAO protocols and included body weight, body length, chest circumference, shank length, shank circumference, keel length, wing span, wing length, beak length, and comb length. Pearson correlation coefficients were computed to assess trait interrelationships. A regression tree algorithm with 10-fold cross-validation was employed to predict body weight. The correlation analysis revealed the strongest association between shank length and beak length (r = 0.52, p < .001), suggesting developmental coordination between appendicular and cranial structures. Body weight correlated most strongly with keel length and shank circumference (both r = 0.32), followed by body length (r = 0.25) and chest circumference (r = 0.26). Notably, comb length showed no significant correlation with body weight (r = 0.05), indicating partial developmental autonomy of secondary sexual characteristics in females. The regression tree model achieved a training R² of 0.583 but a lower validation R² of 0.386, with root average squared error increasing from 0.064 to 0.083. Shank circumference emerged as the primary splitting variable at 3.2 units, dividing birds into smaller (mean 1.32 kg) and larger (mean 1.41 kg) subgroups. Within the smaller shank circumference group, body length served as the secondary predictor, with further splits on wing span, chest circumference, shank length, keel length, and comb length revealing complex trait interactions. Variable importance analysis identified body length as the top contributor (25.0% of sum of squares), followed by shank circumference (24.4%) and wing span (21.6%). Beak length, spur length, and wattle length contributed nothing to the model. These findings establish a baseline phenotypic characterization for indigenous chickens and demonstrate that morphometric traits can predict body weight with moderate accuracy. Shank circumference offers the most efficient single predictor for field use, while body length and wing span provide incremental precision. Future research should apply ensemble methods such as random forests to improve generalizability. Policymakers should integrate these findings into community-based breeding programs and conservation strategies tailored to local production systems.
Body weight prediction, indigenous chicken, morphometric traits, regression tree, smallholder farming
Poultry production occupies a pivotal position within Ethiopia's agricultural economy, providing one of the most accessible pathways to household food security and income generation for rural communities. According to the Central Statistical Agency (CSA, 2022), Ethiopia's national chicken population stands at approximately 57.01 million birds, a figure that positions the country among the most significant poultry-holding nations on the African continent. Within this population, indigenous ecotypes overwhelmingly dominate, constituting 78.85% of all birds, followed by hybrids at 12.02% and exotic breeds at 9.11% (CSA, 2022). This demographic profile reflects not only the historical entrenchment of indigenous systems but also their ongoing relevance to smallholder livelihoods across diverse agroecological zones. The sector generates employment, particularly for women and youth, improves household nutrition through a readily available source of animal protein, and provides an enterprise requiring minimal land, capital investment, and specialized infrastructure, making it uniquely accessible to resource-constrained farmers in remote rural areas (FAO, 2019; Melkamu et al., 2020).
Ethiopian indigenous chickens (EICs) are characterized by remarkable phenotypic diversity, manifesting across a wide range of morphological traits including body conformation, plumage coloration, comb type, and productive performance (Halima, 2007; Abebaw et al., 2024). Beyond their morphological variation, EICs possess a suite of adaptive traits that are critically important in low-input production environments. These include exceptional foraging ability, disease tolerance, resilience to harsh climatic conditions, heat stress resistance, and strong brooding and maternal instincts (Tadelle et al., 2003; Dana et al., 2010). Collectively, these characteristics render EICs uniquely suited to the extensive, scavenging-based village production systems that predominate in rural Ethiopia, where purchased feeds, veterinary inputs, and controlled housing conditions are rarely available (Terfa et al., 2019; Bettridge et al., 2018). As a result, these birds contribute substantially to household food security and serve as an important financial safety net for millions of smallholder farming families.
Despite the inherent adaptive advantages of EICs and their numerical dominance in national poultry statistics, the sector's economic output remains disproportionately low relative to its potential. A complex web of constraints limits productivity, including suboptimal husbandry practices, inadequate access to veterinary services and extension support, high morbidity and mortality due to Newcastle disease and other prevalent pathogens, poor infrastructure for market access, and the near-absence of organized breeding programs tailored to indigenous systems (Mlozi et al., 2003; Aberra, 2014; Desta, 2021). Compounding these production-level challenges is the progressive genetic erosion occurring within indigenous populations, driven by indiscriminate crossbreeding with exotic breeds without prior systematic characterization or conservation planning (Dana et al., 2010; Fekede et al., 2026). This erosion threatens to irreversibly dilute the unique genetic resources that underpin the adaptive resilience of EICs, underscoring the urgency of comprehensive documentation and conservation efforts.
Accurate phenotypic characterization of indigenous chicken populations is fundamental to designing effective conservation and genetic improvement strategies. Traditional approaches to characterization have relied heavily on direct live body weight (BW) measurement; however, such measurements require access to calibrated weighing equipment that is frequently unavailable under village production conditions. In contrast, linear body measurements (LBMs) — including body length, chest circumference, shank length, wing span, and related morphometric traits — can be obtained using simple, low-cost instruments such as measuring tapes and callipers, making them practically applicable in resource-limited field settings (Yakubu, 2009; Mavule et al., 2012). Establishing robust, statistically validated predictive relationships between LBMs and BW therefore addresses a practical gap in field assessment methodology while simultaneously advancing the scientific understanding of morphological variation within indigenous populations.
Statistical methodology plays a decisive role in determining the reliability and applicability of such predictive models. Conventional ordinary least squares (OLS) regression, while widely applied in livestock morphometric research, is frequently undermined by multicollinearity — the phenomenon whereby predictor variables exhibit high intercorrelations that distort coefficient estimates, inflate standard errors, and compromise both model stability and predictive generalizability (Kebede et al., 2022; Mekonnen et al., 2023). Dimensionality reduction approaches such as Principal Component Analysis (PCA) and Factor Analysis have been proposed as partial remedies, and both have been applied in poultry characterization research (Yakubu, 2009; Adebambo & Imumorin, 2011; Mavule et al., 2012). However, these methods typically sacrifice interpretability, yielding latent components or factors whose biological meaning is not always transparent, thereby limiting their practical utility for field application by extension workers and smallholder farmers (Mavule et al., 2013; Yakubu, 2013).
Classification and Regression Tree (CART) algorithms, a class of data mining approaches, present a compelling non-parametric alternative that overcomes the principal limitations of conventional regression in this context. CART operates by recursively partitioning the dataset into progressively homogeneous subsets through binary splits that optimize variance reduction at each node, producing hierarchical, rule-based decision tree structures that are both statistically robust and highly interpretable (Tariq et al., 2012a; Eyduran et al., 2017). Critically, CART neither requires normally distributed data nor assumes linearity or independence among predictors, and it accommodates multicollinear predictors without the coefficient instability that undermines OLS regression (Montero & Vilar, 2014; Tyasi et al., 2021). The resulting decision trees translate directly into simple decision rules that can be applied without computation, making them ideal tools for field-level livestock assessment in contexts where digital infrastructure and statistical literacy may be limited (Kebede et al., 2022). Empirical validations across diverse livestock species and geographic contexts have consistently demonstrated CART's superior predictive accuracy relative to conventional parametric methods, lending further support to its adoption in indigenous poultry research (Tariq et al., 2012a; Eyduran et al., 2017).
Existing information is either outdated, geographically fragmented, or insufficiently detailed to inform contemporary breed conservation and genetic improvement strategies that are tailored to the specific agroecological, socioeconomic, and cultural contexts of this zone (Abebaw et al., 2024; Desta, 2021; Fekede et al., 2026). This evidence gap constrains the development of evidence-based policies, targeted breeding programs, and context-appropriate extension interventions for smallholder poultry producers in the region.
Against this backdrop, the present study was designed to address two interrelated primary objectives. The first was to quantify the associations between body weight and linear body measurements within indigenous chicken populations. The second was to develop, optimize, and validate a Regression Tree-based predictive model for body weight estimation that prioritizes accuracy, interpretability, and practical utility under field conditions. The findings of this study are expected to serve as a vital scientific foundation for the design of appropriate utilization strategies, effective conservation programs, and sustainable genetic improvement initiatives specific to the local chicken populations of Eastern Hararghe, ultimately contributing to enhanced livelihoods for smallholder farmers and to the preservation of Ethiopia's diverse and valuable poultry genetic heritage.
Materials And Methods
Description of the Study Area
This study was conducted in three purposively selected districts — Bedeno, Jarso, and Goro Gutu — located within the East Hararghe Zone of the Oromia Regional State, Ethiopia (Figure 1). The mean annual rainfall across the zone ranges from approximately 400 mm in the lowland districts to over 800 mm in highland areas, while mean annual temperatures vary from 18°C to 28°C depending on altitude and agroecological zone (East Hararghe Zone Office of Agriculture and Rural Development, 2022).
The three study districts were purposively selected based on three operationally defined criteria, verified using baseline data obtained from the East Hararghe Zone Office of Agriculture and Rural Development prior to the commencement of fieldwork. The first criterion was the documented presence of a substantial indigenous chicken population, which ensured that sample size requirements could be met and that the populations studied reflected genuine scavenging-based village production systems rather than transitional or improved flocks. The second criterion was the availability of adequate road infrastructure and transportation networks to ensure logistical feasibility during fieldwork and to minimize disruption to data collection schedules arising from access constraints.
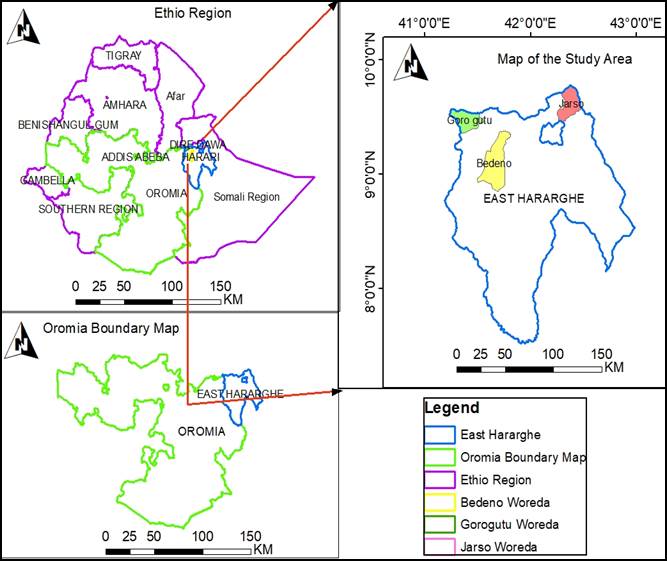
Figure 1: Map of the study areas
Study Design and Data Collection
This research employed a morphometric characterization design to comprehensively document indigenous chicken populations, and phenotypic diversity across the three study districts. This approach follows established methodologies for livestock genetic resource characterization as prescribed by the Food and Agriculture Organization of the United Nations (FAO, 2012), and has been widely applied in phenotypic studies of indigenous chicken populations across sub-Saharan Africa (Adebambo & Imumorin, 2011; Dana et al., 2010; Melkamu et al., 2020).
The target sample comprised 450 adult indigenous chickens distributed equally across the three districts at 150 birds per district. Within each district, the sex ratio was set at 50 males and 100 females, a 1:2 allocation reflecting the typical demographic structure of smallholder scavenging flocks, in which females are preferentially retained for egg production and brooding while males are more frequently culled or sold at market age (Salako, 2006; Adebambo & Imumorin, 2011). Only birds confirmed to be at least 6 months of age at the time of measurement were included in the study, as this threshold represents the attainment of sexual maturity and morphological stability in indigenous chicken ecotypes under village production conditions. Age verification combined owner recall with direct visual assessment of established maturity indicators, including full development of the comb and wattles, hardening of the shanks, mature plumage pattern, and conformation consistent with adult body proportions, in accordance with FAO (2012) descriptors. Birds that exhibited signs of acute illness, physical injury, pregnancy, or abnormal body condition were excluded to minimize confounding of morphometric measurements.
Morphometric Data Collection Procedures
Morphometric characterization was conducted in accordance with FAO (2012) measurement protocols and standardized descriptor guidelines for the phenotypic characterization of animal genetic resources. All measurements were taken during the early morning period between 6:00 and 8:00 AM, before birds commenced daily scavenging activity or consumed supplementary feed. This temporal standardization was deliberately adopted to minimize diurnal variation in body weight and physiological state, particularly post-prandial gut fill, which can introduce systematic measurement error in live weight assessments (Yakubu, 2009; Tyasi et al., 2020).
All linear body measurements were recorded using a calibrated non-stretch flexible measuring tape (Lufkin W606PD) to a precision of 0.1 cm. The choice of a non-stretch tape was deliberate, as elastic or semi-elastic measuring instruments introduce systematic underestimation of curvilinear surface dimensions such as chest circumference, and the specific model employed has been validated in comparable livestock morphometric studies for its dimensional stability across the temperature ranges encountered during fieldwork (Yakubu, 2009). Body weight was determined using a calibrated digital hanging scale (Ohaus CS2000, maximum capacity 10 kg, readability 1 g). A single, specifically trained person performed all measurements for the entire study, thereby eliminating inter-observer error as a potential source of morphometric variation — a methodological precaution considered essential in studies where multiple body parts are measured sequentially on restrained live animals (Mendes et al., 2020; Tyasi et al., 2020).
Birds were gently restrained in standardized measurement positions by a trained assistant during all procedures to minimize stress-induced movement and postural variation that could affect measurement accuracy. Eleven quantitative morphometric traits were recorded for each bird: body weight (g), body length (cm), chest circumference (cm), spur length (cm), shank length (cm), shank circumference (cm), keel length (cm), wing span (cm), beak length (cm), wing length (cm), and comb length (cm). Body weight was measured by securing the live bird in a cloth measuring bag suspended from the digital scale, with the tare weight of the bag subtracted from each reading. Body length was measured as the straight-line distance from the tip of the beak to the base of the tail along the dorsal midline. Chest circumference was measured as the girth of the thorax at the level of maximum width, immediately posterior to the wings. Shank length was recorded as the distance from the hock joint to the base of the middle toe. All remaining traits were measured according to the positional and anatomical definitions specified in the FAO (2012) descriptor protocol. Data were recorded immediately following each bird's measurement on pre-printed FAO-standardized phenotypic descriptor sheets, with each bird assigned a unique alphanumeric identifier to facilitate data entry verification and to prevent duplication.
Statistical Data Analysis
For all statistical analyses in this study, JMP Pro version 18 (2023) was used.
Pearson's product-moment correlation coefficients were computed to quantify the linear associations between body weight and each morphometric trait, and between pairs of morphometric traits. Correlation analysis served a dual analytical purpose: first, to identify morphometric traits that are strongly and consistently associated with body weight, and hence suitable as predictor variables in a predictive model; and second, to diagnose the degree of multicollinearity among the predictor variables prior to regression modelling. High inter-predictor correlations (|r| > 0.70) were treated as empirical evidence of multicollinearity, providing a statistical justification for the adoption of a non-parametric regression tree algorithm in preference to ordinary least squares regression (Kebede et al., 2022; Mekonnen et al., 2023). All correlations were tested for significance using a two-tailed t-test.
Regression Tree Algorithm (RTA)
The RTA, a non-parametric data mining method belonging to the Classification and Regression Tree (CART) family, was employed to model the relationships between body weight (response variable) and the linear morphometric traits (predictor variables; Mathapo & Tyasi, 2021). The fundamental rationale for selecting the RTA over conventional multiple linear regression (MLR) rests on its inherent capacity to accommodate multicollinear predictors without generating unstable or biased coefficient estimates, its freedom from parametric distributional assumptions, and its production of interpretable rule-based decision tree structures that can be applied without computational tools under field conditions (Eyduran et al., 2017; Tariq et al., 2012; Tyasi et al., 2021). These properties are particularly advantageous in indigenous livestock studies where predictor variables — such as linear morphometric measurements — frequently exhibit high intercorrelations, and where the practical applicability of models to extension workers and farmers is a primary consideration (Kebede et al., 2022).
The RTA operates through a process of recursive binary partitioning, in which the algorithm begins at a heterogeneous root node containing the complete dataset and iteratively splits the data into progressively more homogeneous subgroups (child nodes) based on threshold values of predictor variables (Song & Lu, 2015). At each candidate split, the algorithm evaluates all possible binary divisions for all predictor variables and selects the split that maximizes between-group variance in body weight while minimizing within-group variance, thereby identifying the predictor variable and its optimal cut-off value that most effectively discriminates high-weight from low-weight subgroups at that node. This process continues recursively from each child node until a stopping criterion is met or no further meaningful partitioning is possible, resulting in terminal nodes — leaf nodes — that define the homogeneous subgroups of the population and their associated predicted body weight values (Olfaz et al., 2019; Song & Lu, 2015).
The RTA process formally encompasses three sequential stages: growing, pruning, and validation. In the growing stage, the full tree is expanded to its maximum permissible depth. In the pruning stage, the tree is progressively simplified by merging nodes whose separation does not meaningfully reduce prediction error, thereby preventing overfitting and improving model generalizability to new observations (Song & Lu, 2015). Tree depth and complexity were regulated through 10-fold cross-validation combined with the one-standard-error rule, a conservative model selection criterion that selects the simplest tree whose cross-validated prediction error lies within one standard error of the minimum observed error (Tyasi et al., 2020). This approach provides a principled balance between model complexity and predictive accuracy, yielding trees that are parsimonious and practically interpretable without sacrificing fit. The Bonferroni correction method was applied to adjust significance thresholds for splitting and merging decisions, providing appropriate control of Type I error under conditions of multiple simultaneous comparisons across candidate splits (Eyduran et al., 2017).
Model performance was evaluated using four complementary goodness-of-fit statistics: the coefficient of determination (R²), the root mean squared error (RMSE), the coefficient of variation (CV), and the corrected Akaike Information Criterion (AICc). The R² quantifies the proportion of total variance in body weight explained by the regression tree model. The RMSE provides an absolute measure of prediction error in the original unit of body weight (grams), facilitating direct interpretation of prediction accuracy. The CV, expressed as a percentage of the mean body weight, offers a standardized measure of relative prediction error that enables comparison across models and populations with different mean body weight levels. The AICc penalizes model complexity relative to fit and was employed as a model selection criterion when comparing tree models of different complexity, with lower AICc values indicating a more favourable trade-off between parsimony and explanatory power (Burnham & Anderson, 2004). The optimal regression tree model was defined as the model simultaneously exhibiting the lowest RMSE, lowest CV, lowest AICc, and highest R², and this model was selected as the final predictive model for body weight from linear morphometric traits.
Results And Discussions
Correlation Analysis
Pearson correlation analyses (Table 1) were performed to evaluate the interrelationships among morphometric traits in chicken, including ShL=Shank Length; CL=Comb Length; BL=Body Length; BW=Body Weight; BkL=Beak Length; ChC=Chest Circumstance; SprL=Spur Length; WinL=Wing Length; WinS=Wing Span; ShC=Shank Circumstance; KL=Keel Length.
Table 1: Correlation coefficients and their statistical significance levels between body weight and morphometric traits of does.
|
|
ShL |
CL |
BL |
BW |
BkL |
ChC |
SprL |
WinL |
WinS |
ShC |
KL |
|
ShL |
1.00 |
|
|
|
|
|
|
|
|
|
|
|
CL |
0.31* |
1.00 |
|
|
|
|
|
|
|
|
|
|
BL |
0.31* |
0.09ns |
1.00 |
|
|
|
|
|
|
|
|
|
BW |
0.26* |
0.05ns |
0.25* |
1.00 |
|
|
|
|
|
|
|
|
BkL |
0.52* |
0.33* |
0.35* |
0.21* |
1.00 |
|
|
|
|
|
|
|
ChC |
0.44* |
0.29* |
0.29* |
0.26* |
0.40* |
1.00 |
|
|
|
|
|
|
SprL |
0.41* |
0.33* |
0.16* |
0.31* |
0.28* |
0.31* |
1.00 |
|
|
|
|
|
WinL |
0.27* |
0.35* |
0.01ns |
0.14* |
0.24* |
0.27* |
0.33* |
1.00 |
|
|
|
|
WinS |
0.36* |
0.34* |
0.27ns |
0.23* |
0.40* |
0.28* |
0.22* |
0.27* |
1.00 |
|
|
|
ShC |
0.36* |
0.13* |
0.17* |
0.32* |
0.24* |
0.32* |
0.28* |
0.06ns |
0.20ns |
1.00 |
|
|
KL |
0.43* |
0.25* |
0.34* |
0.32* |
0.34* |
0.39* |
0.29* |
0.18* |
0.33ns |
0.34* |
1.00 |
* significant at p<0.05; ns = not significant; BW = Body weight; ShL=Shank Length; CL=Comb Length; BL=Body Length; BW=Body Weight; BkL=Beak Length; ChC=Chest Circumstance; SprL=Spur Length; WinL=Wing Length; WinS=Wing Span; ShC=Shank Circumstance; KL=Keel Length.
The strongest correlation observed was between shank length (ShL) and beak length (BkL) (r = 0.52, p< .05). This robust association suggests potential developmental coordination or functional linkage between appendicular and cranial structures in females, differing from patterns often reported in males, where appendicular traits correlate more strongly with each other (Yakubu, 2011; Morales et al., 2020).
Shank length (ShL) also demonstrated significant positive correlations with several other traits, including keel length (KL) (r = 0.43, p < .05), chest circumference (ChC) (r = 0.44, p < .05) and wing span (WinS) (r = 0.36, p < .05). These moderate relationships indicate coordinated development of structural components related to locomotion, body capacity and potentially foraging efficiency (Fernandez-Juricic et al., 2008; Brock et al., 2020). Notably, comb length (CL) correlated significantly only with ShL (r = 0.31, p < .05) and BkL (r = 0.33, p < .05), but not with body length (BL) (r = 0.09, p = 0.124) or body weight (BW) (r = 0.05, p = 0.396). This weaker integration of comb size with core body metrics contrasts with findings in some male populations and highlights sex-specific patterns in secondary sexual characteristic development (Coyne et al., 2008; Bettridge et al., 2018).
Body weight (BW) showed modest but statistically significant correlations with structural traits. The strongest associations were with keel length (KL) (r = 0.32, p < .05) and shank circumference (ShC) (r = 0.32, p < .05), followed by body length (BL) (r = 0.25, p < .05) and chest circumference (ChC) (r = 0.26, p < .05). While significant, these correlations are generally weaker than those typically reported for males or in studies focused on meat-type birds (Behiry et al., 2019; Isaac & Adeolu, 2022). Wing length (WinL) showed particularly weak integration, correlating only with comb length (CL) (r = 0.35, p < .05) and spur length (SprL) (r = 0.33, p < .05), and showing no association with body length (BL) (r = 0.01, p = 0.927).
Body Weight Prediction from Morphometric Traits Using Regression Tree Algorithm (RTA)
A regression tree algorithm (RTA) was utilised to predict body weight (BW) from morphometric traits. The analysis incorporated a training dataset comprising 225 observations and a validation dataset of 75 observations (Tyasi et al., 2021). The model performance was evaluated using R² values, root average squared error (RASE), and Akaike Information Criterion corrected (AICc).
Table 2: Regression tree model’s performance
|
|
R2 |
RASE |
N |
Nr. of Splits |
AICc |
|
Training |
0.583 |
0.064 |
225 |
11 |
-567.5 |
|
Validation |
0.386 |
0.083 |
75 |
|
|
The resulting model, characterised by 11 splits, yielded an R² of 0.583 for the training set, indicating that approximately 58.3% of the variance in body weight was accounted for by the predictors. In contrast, the validation set produced an R² of 0.386, suggesting a lower explanatory power of 38.6% (Tyasi et al., 2021). The root average squared error (RASE) was 0.064 for the training data and 0.083 for the validation data, reflecting a modest increase in prediction error when applied to unseen data (Celik et al., 2017). These metrics collectively point to a model with reasonable predictive capability (Tyasi et al., 2021).
Biologically, these findings align with the expectation that morphometric traits related to skeletal framework and body proportions—such as shank circumference and body length—would strongly correlate with body weight, a relationship often observed in studies of animal morphology (Brito et al., 2021; Yakubu et al., 2020). Despite its explanatory power, the model’s reduced performance on the validation set (R² = 0.386 vs. 0.583 for training) raises concerns about generalizability (Tyasi et al., 2021). This overfitting could limit its utility in predicting body weight for new populations, a common challenge in regression tree analyses with extensive branching (Celik et al., 2017). Future investigations might benefit from pruning the tree to reduce complexity or employing ensemble methods, such as random forests, to enhance robustness and predictive accuracy (Yakubu et al., 2022).
Leaf Report
The RTA analysis produced a tree with 12 terminal nodes (leaves), each characterised by a unique combination of predictor thresholds and associated with a mean body weight and observation count (Tyasi et al., 2021). Examination of the tree structure revealed that shank circumference (ShC) emerged as the primary splitting variable (Oguntunji, 2017), highlighting its critical role in predicting BW. This prominence of ShC suggests a strong biological association with body weight, potentially reflecting its relationship to skeletal size or muscle mass, both of which are key contributors to overall mass (Yakubu et al., 2020).
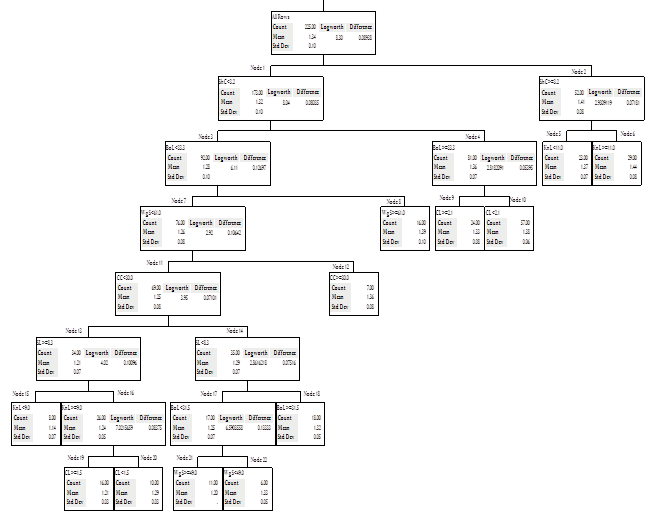
The initial split at ShC = 3.2 divided the sample into two distinct subgroups (Tyasi et al., 2020). For observations where ShC < 3.2, comprising the majority of the dataset (173 observations), the mean BW ranged from 1.138 to 1.388 kg across 10 leaves, indicating considerable variability explained by subsequent splits on additional traits (Tyasi et al., 2021). Within this subgroup, the tree further branched on body length (BL) at 33.3 (Brito et al., 2021). For BL < 33.3, mean BW values varied widely depending on additional conditions involving wing span (WinS), chest circumference (ChC), shank length (ShL), kneel length (KL), and comb length (CL) (Tyasi et al., 2020). The leaf defined by ShC < 3.2, BL < 33.3, WinS < 61.0, ChC < 30.0, ShL ≥ 8.3, and KL < 9.0 exhibited the lowest mean BW (1.138 kg, n = 8), suggesting that smaller values across multiple traits correspond to reduced body weight (Tyasi et al., 2021). Conversely, when BL ≥ 33.3 within the ShC < 3.2 subgroup, splits on comb length (CL) at 2.1 resulted in mean BW values of 1.325 kg (CL ≥ 2.1, n = 24) and 1.379 kg (CL < 2.1, n = 57), indicating that longer body length paired with smaller comb length may elevate BW despite a smaller shank circumference (Oguntunji, 2017).
Table 3: Terminal leaf report with mean body weight and count
|
Nr. |
Leaf Label |
Mean |
Count |
|
1 |
ShC<3.2&BL<33.3&WinS<61.0&ChC<30.0&ShL≥8.3&KL<9.0 |
1.138 |
8 |
|
2 |
ShC<3.2&BL<33.3&WinS<61.0&ChC<30.0&ShL≥8.3&KL≥9.0&CL≥1.5 |
1.206 |
16 |
|
3 |
ShC<3.2&BL<33.3&WinS<61.0&ChC<30.0&ShL≥8.3&KL≥9.0&CL<1.5 |
1.290 |
10 |
|
4 |
ShC<3.2&BL<33.3&WinS<61.0&ChC<30.0&ShL<8.3&BL<31.5&WinS≥49.0 |
1.200 |
11 |
|
5 |
ShC<3.2&BL<33.3&WinS<61.0&ChC<30.0&ShL<8.3&BL<31.5&WinS<49.0 |
1.333 |
6 |
|
6 |
ShC<3.2&BL<33.3&WinS<61.0&ChC<30.0&ShL<8.3&BL≥31.5 |
1.322 |
18 |
|
7 |
ShC<3.2&BL<33.3&WinS<61.0&ChC≥30.0 |
1.357 |
7 |
|
8 |
ShC<3.2&BL<33.3&WinS≥61.0 |
1.388 |
16 |
|
9 |
ShC<3.2&BL≥33.3&CL≥2.1 |
1.325 |
24 |
|
10 |
ShC<3.2&BL≥33.3&CL<2.1 |
1.379 |
57 |
|
11 |
ShC≥3.2&KL<11.0 |
1.370 |
23 |
|
12 |
ShC≥3.2&KL≥11.0 |
1.441 |
29 |
For observations with ShC ≥ 3.2 (52 observations), the tree structure was simplified, splitting only on kneel length (KL) at 11.0 (Yakubu et al., 2020). This produced two leaves: one with KL < 11.0 (M = 1.370, n = 23) and another with KL ≥ 11.0 (M = 1.441, n = 29). The higher mean BW in the latter leaf suggests that, among individuals with larger shank circumferences, greater kneel length further increases body weight, possibly due to enhanced leg mass or structural support (Yakubu et al., 2020). This streamlined branching pattern contrasts with the extensive splits within the ShC < 3.2 subgroup, implying that for larger ShC values, fewer traits are needed to differentiate BW effectively (Tyasi et al., 2021).
Within the ShC < 3.2 and BL < 33.3 branch, the tree’s complexity increased as it incorporated splits on WinS, ChC, ShL, and KL, revealing intricate interactions among predictors (Celik and Yilmaz, 2018). For instance, the leaf with ShC < 3.2, BL < 33.3, WinS < 61.0, ChC < 30.0, ShL < 8.3, BL < 31.5, and WinS < 49.0 yielded a mean BW of 1.333 kg (n = 6), a relatively high value within this subgroup despite small trait measurements. This finding suggests that specific combinations of traits can mitigate the effect of smaller shank circumference and body length on BW (Brito et al., 2021). Similarly, when WinS ≥ 61.0 within the same BL < 33.3 branch, the mean BW rose to 1.388 kg (n = 16), underscoring the conditional importance of wing span in certain contexts (Tyasi et al., 2020). These patterns highlight the regression tree’s strength in capturing non-linear relationships and interactions that might be obscured in traditional linear models (Celik et al., 2017).
Despite these insights, caution is warranted in interpreting some results due to small sample sizes in certain leaves (Tyasi et al., 2021). For example, the leaf with a mean BW of 1.333 kg (n = 6) may lack statistical stability. Additionally, the extensive branching within the ShC < 3.2 subgroup raises the possibility of overfitting, where the model may overly tailor to the training data, potentially reducing its predictive accuracy on new samples (Tyasi et al., 2021). To address this, future analyses could employ cross-validation or tree pruning to enhance generalizability (Yakubu et al., 2022).
The biological implications of these findings are noteworthy. Shank circumference’s dominance as the initial split aligns with its likely role as an indicator of overall body size or muscular development (Yakubu et al., 2020). Body length emerged as a secondary but significant predictor, particularly for individuals with smaller ShC, suggesting that longitudinal growth influences BW when shank size is limited (Brito et al., 2021). The conditional roles of wing span, chest circumference, and kneel length further indicate that their contributions to BW depend on other traits, reflecting a nuanced interplay of morphometric characteristics (Tyasi et al., 2021). Comb length’s appearance in the tree may point to indirect effects, such as hormonal influences or sexual maturity, on body weight (Oguntunji, 2017).
Practically, these results suggest that shank circumference could serve as an efficient single predictor of BW in field settings (Oguntunji, 2017). However, for more precise predictions, incorporating additional traits like body length or kneel length may be beneficial (Brito et al., 2021). Such insights could inform applications in animal science, such as breeding programs or health monitoring (Tyasi et al., 2020). In conclusion, this regression tree analysis illuminates the hierarchical and interactive roles of morphometric traits in predicting body weight, with shank circumference as the cornerstone predictor (Yakubu et al., 2020).
Morphometric Traits’ Contribution
The regression tree algorithm (RTA) analysis elucidated the relative contributions of the morphometric traits in explaining variance in BW, offering valuable insights into their predictive significance (Tyasi et al., 2021; Yakubu, 2012). Examination of the "Column Contributions" output reveals that body length (BL) emerged as the most prominent predictor within the regression tree model. With two splits and a sum of squares (SS) of 0.3275, BL accounted for 25.0% of the total SS (Brito et al., 2021). Such a substantial contribution suggests that BL serves as a critical indicator of BW, likely attributable to its direct association with overall skeletal and muscular dimensions that underpin body mass (Yakubu et al., 2020).
Following closely, shank circumference (ShC) exerted considerable influence despite being utilised in only one split, contributing 0.3194 to the SS and comprising 24.4% of the total variance explained (Oguntunji, 2017). The potency of ShC as a predictor, even with a single partitioning, points to its potential reflection of limb robustness, a trait plausibly linked to BW through its role in supporting body structure (Yakubu et al., 2020). Wing span (WinS) also demonstrated notable predictive power, featuring in two splits and contributing 0.2821 to the SS, which equates to 21.6% of the total variance (Tyasi et al., 2017). This finding highlights the relevance of WinS in BW estimation, a relationship that may be particularly salient in species where wing dimensions correlate with physical capabilities such as flight, thereby influencing overall mass (Tyasi et al., 2021).
Table 4: Morphometric traits’ importance in predicting body weight
|
Trait |
Nr. of Splits |
SS |
Portion |
|
BL |
2 |
0.3275 |
0.250 |
|
ShC |
1 |
0.3194 |
0.244 |
|
WinS |
2 |
0.2821 |
0.216 |
|
KL |
2 |
0.1285 |
0.098 |
|
CL |
2 |
0.0923 |
0.071 |
|
ShL |
1 |
0.0869 |
0.066 |
|
ChC |
1 |
0.0720 |
0.055 |
|
BkL |
0 |
0 |
0.000 |
|
SprL |
0 |
0 |
0.000 |
|
WtL |
0 |
0 |
0.000 |
Other morphometric traits, including kneel length (KnL), comb length (CL), shank length (ShL), and chest circumference (ChC), contributed to the model to a lesser extent, with SS values ranging from 0.0720 to 0.1285 and portions of total SS spanning 5.5% to 9.8% (Tyasi et al., 2021). These predictors likely refine the model by capturing subtler variations in BW that the dominant traits alone might not fully address (Celik & Yilmaz, 2018). Conversely, beak length (BkL), spur length (SprL), and wattle length (WtL) failed to contribute to the regression tree, as evidenced by their zero splits and null SS values (Oguntunji, 2017). This lack of involvement suggests that these traits bear minimal direct relevance to BW within the confines of this dataset, possibly because they are more closely tied to secondary sexual characteristics or other physiological functions rather than mass-related attributes (Brito et al., 2021).
The pre-eminence of BL, ShC, and WinS aligns with biological principles, given their connections to the structural framework that defines body mass (Yakubu et al., 2020). The presence of multiple splits for BL and WgS further indicates that these predictors may encapsulate intricate, non-linear interactions with BW, a strength of the regression tree approach that distinguishes it from traditional linear models (Tyasi et al., 2021). By identifying these key contributors, the analysis underscores the practical advantage of RTA in isolating traits with the greatest explanatory capacity, potentially guiding future research toward more efficient measurement strategies (Yakubu et al., 2020).
Nevertheless, the exclusion of certain traits from the model should not be interpreted as evidence of their biological irrelevance. Instead, it implies that, within this specific analytical context, BkL, SprL, and WtL did not enhance the predictive framework beyond the contributions of other variables (Oguntunji, 2017). Exploring interactions among the included predictors or assessing the roles of non-contributing traits across diverse populations could yield further clarity (Tyasi et al., 2021).
The structure of the regression tree (Figure 3) revealed shank circumference (ShC) as the primary predictor, with the initial split occurring at a value of 3.2 units (Oguntunji, 2017). Observations where ShC was < 3.2 (n = 173) exhibited a mean body weight of 1.32 kg (SD = 0.10), whereas those with ShC ≥ 3.2 (n = 52) had a higher mean body weight of 1.41 kg (SD = 0.08). This finding underscores the pivotal role of shank circumference in differentiating body weight, possibly reflecting its association with overall skeletal size or muscle mass, which are known contributors to body mass in poultry (Yakubu et al., 2020). Within the subgroup of observations with ShC below 3.2, the tree further partitioned the data based on body length (BL) at a threshold of 33.3 units. Individuals with BL < 33.3 (n = 92) showed a mean body weight of 1.28 kg (SD = 0.10), while those with BL ≥ 33.3 (n = 81) had a mean of 1.36 kg (SD = 0.07) (Tyasi et al., 2020). This secondary split highlights body length as an influential factor among chickens with smaller shank circumferences, suggesting that elongated body structures may contribute incrementally to body weight in this context (Brito et al., 2021).
Subsequent branching within the BL < 33.3 subgroup involved wing span (WinS) at 61.0 units, yielding a group with WinS below 61.0 (n = 76, M = 1.26, SD = 0.08) that was further divided by chest circumference (ChC) at 30.0 units (Tyasi et al., 2021). Here, individuals with ChC below 30.0 (n = 69) had a mean body weight of 1.25 kg (SD = 0.08). This branch continued to split on shank length (ShL) at 8.3 units, where those with ShL ≥ 8.3 (n = 34, M = 1.21, SD = 0.07) were distinguished from those with ShL below this value (n = 35, M = 1.29, SD = 0.07) (Tyasi et al., 2020). Among the ShL ≥ 8.3 subgroup, kneel length (KL) at 9.0 units separated a terminal node with KL below 9.0 (n = 8, M = 1.14, SD = 0.07) from a group with KL ≥ 9.0 (n = 26, M = 1.24, SD = 0.05), the latter of which split further on comb length (CL) at 1.5 units (Tyasi et al., 2021). This intricate sequence of splits resulted in terminal nodes with mean body weights ranging from 1.14 to 1.39 kg across the tree, illustrating the nuanced interplay of multiple traits in predicting body weight (Oguntunji, 2017).
For observations with ShC ≥ 3.2, the tree branched on kneel length (KL) at 11.0 units, producing two terminal nodes: one with KL below 11.0 (n = 23, M = 1.37, SD = 0.07) and another with KL ≥ 11.0 (n = 29, M = 1.44, SD = 0.08) (Tyasi et al., 2020). The higher mean body weight in the latter group suggests that, among individuals with larger shank circumferences, longer kneel lengths amplify body weight, potentially due to increased leg mass or structural support (Yakubu et al., 2020). The non-parametric nature of the regression tree allowed it to capture complex, non-linear relationships and interactions among predictors, a distinct advantage over traditional linear models (Celik et al., 2017). For instance, the influence of body length on body weight varied depending on shank circumference, as evidenced by its prominence in the ShC less than 3.2 branch but absence in the ShC greater than or equal to 3.2 branch (Tyasi et al., 2021). Similarly, traits such as wing span and chest circumference emerged as significant only within specific subgroups (Oguntunji, 2017).
Figure 2: Regression tree diagram
Conclusions
The Pearson correlation analysis conducted on 350 indigenous chickens revealed a complex and heterogeneous pattern of interrelationships among eleven morphometric traits. The strongest association identified was between shank length and beak length, yielding a correlation coefficient of 0.52. This robust positive relationship diverges from patterns frequently documented in male chicken populations, where appendicular traits tend to correlate more strongly with each other than with cranial features. This sex-specific divergence in morphological integration may reflect differential selective pressures operating on reproductive females, for whom the coordination between locomotor and feeding apparatuses assumes heightened importance for foraging efficiency and offspring provisioning. Shank length also demonstrated significant positive correlations with keel length, chest circumference, and wing span, collectively indicating coordinated development among structural components that underpin locomotion, body capacity, and overall size scaling.
Of particular biological significance was the restricted correlational profile of comb length, which exhibited significant positive associations exclusively with shank length and beak length while showing no meaningful relationship with body length or body weight. This pattern highlights the partial developmental autonomy of secondary sexual characteristics in female chickens, wherein comb growth appears decoupled from the somatic growth trajectories that dominate body mass determination. This finding contrasts with reports from male populations and meat-type birds, where comb dimensions frequently correlate more strongly with overall body size, and it reinforces the necessity of sex-disaggregated analysis in phenotypic characterization studies. The weak integration of wing length with axial body dimensions further complicates simple assumptions about universal allometric scaling in domesticated avian populations and points to potential population-specific modulation of growth trajectories.
Body weight exhibited modest but statistically significant correlations with several structural traits, with the strongest associations observed for keel length and shank circumference, followed by body length and chest circumference. While these correlations are robust, their magnitudes are generally weaker than those typically reported for males or intensively selected meat-type birds. This attenuation likely reflects the metabolic trade-offs characteristic of female indigenous chickens managed under extensive scavenging systems, where reproductive allocation competes with somatic growth for limited nutritional resources. These findings carry important implications for the design of breeding programs, suggesting that selection for body weight in indigenous female populations may need to account for the competing demands of reproduction and the environmental constraints of low-input systems.
The regression tree algorithm analysis represented the methodological centerpiece of the study, addressing the practical imperative of developing a body weight prediction tool deployable in field settings where calibrated weighing scales are unavailable. The model, comprising eleven splits and twelve terminal nodes, achieved a training coefficient of determination of 0.583 and a validation coefficient of determination of 0.386, with corresponding root average squared error values of 0.064 and 0.083. While the training performance indicates that approximately fifty-eight percent of body weight variance is explainable from the included morphometric predictors, the substantial decline in validation performance raises legitimate concerns about model generalizability that warrant careful consideration. This performance gap is consistent with the well-documented tendency of single regression trees to overfit when tree depth is not adequately constrained.
Nevertheless, the regression tree structure yielded biologically meaningful and practically actionable insights. Shank circumference emerged unambiguously as the primary splitting variable, with an initial threshold of 3.2 units dividing the population into a larger subgroup with smaller shank circumferences and a smaller subgroup with larger shank circumferences. This finding aligns with the established role of shank circumference as an indicator of overall skeletal size and muscle mass, and it validates the biological plausibility of the model's hierarchical structure. Within the smaller shank circumference subgroup, the tree exhibited considerable complexity with subsequent splits on body length, wing span, chest circumference, shank length, keel length, and comb length, revealing that body weight determination in relatively slender birds involves the interplay of multiple morphometric dimensions. In contrast, the larger shank circumference subgroup required only a single additional split on keel length to achieve effective differentiation, suggesting that for more robust birds, fewer traits are needed to discriminate body weight classes. This context-dependent pattern of predictor importance represents a distinct advantage of the regression tree approach over conventional linear models, which assume uniform effects across all values of the predictor space.
The variable importance analysis, quantified through sum of squares contributions, identified body length as the most prominent predictor, followed closely by shank circumference and wing span. These three traits collectively accounted for over seventy percent of the explained variance, establishing a clear hierarchy of predictive importance that can guide practical measurement protocols in field settings. The null contributions of beak length, spur length, and wattle length, while not negating their biological relevance, indicate that these traits do not enhance predictive capacity beyond the information already captured by the dominant predictors. This redundancy has direct practical implications: field workers seeking to estimate body weight can prioritize the measurement of shank circumference, body length, and wing span while potentially omitting beak, spur, and wattle measurements without sacrificing predictive accuracy.
Several limitations of the present study must be acknowledged to ensure appropriate interpretation and to guide future research directions. The cross-sectional design, while efficient for phenotypic characterization, captures only a single temporal snapshot and cannot account for ontogenetic changes in morphometric relationships or seasonal variations in body condition that may affect the stability of predictive models. The modest validation coefficient of determination of 0.386, while not atypical for single regression tree applications in biological data, falls short of the predictive accuracy that would be required for high-stakes decision-making in commercial breeding contexts.
These limitations notwithstanding, the study makes several substantive contributions to the scientific understanding and practical management of indigenous chicken genetic resources. The identification of shank circumference as the cornerstone predictor within a hierarchical decision tree framework provides a biologically grounded and statistically validated foundation for understanding how morphometric traits combine to determine body mass in resource-limited production environments. The demonstration that regression tree algorithms can capture non-linear relationships and context-dependent interactions among predictors advances the methodological repertoire available to livestock phenotyping researchers working with complex, multicollinear biological data.
Practically, the study delivers actionable tools and protocols for field-level body weight estimation that address a genuine constraint in village poultry production systems. The decision rules generated by the regression tree translate directly into practical protocols: a field worker measuring a bird's shank circumference can immediately classify it into a broad weight category, and if shank circumference is below 3.2 units, additional measurements of body length and potentially wing span or keel length can refine the estimate. This interpretability is a defining strength of the regression tree approach that distinguishes it from black-box machine learning methods and from conventional regression equations whose coefficients lack intuitive biological meaning when predictors are highly intercorrelated.
The broader policy implications of these findings extend to national and regional strategies for poultry genetic resource conservation and improvement. The documented phenotypic diversity and the established morphometric relationships provide baseline data essential for designing community-based breeding programs tailored to the specific agroecological and socioeconomic contexts of Eastern Hararghe.
Conflict Of Interest Statement
The authors declare that they have no conflict of interest.



Open Access By Aditum Open Access Journals id licensed under Creative Commons Attribution 4.0 International License. Based On a Work at aditum.org