International Journal of Medical Case Reports and Medical Research
OPEN ACCESS | Volume 5 - Issue 1 - 2026
ISSN No: 2994-6905 | Journal DOI: 10.61148/2994-6905/IJMCRMR


Satyendra Nath Chakrabartty
Indian Statistical Institute, Indian Maritime University, Indian Ports Association.
*Corresponding Author: Satyendra Nath Chakrabartty, Indian Statistical Institute, Indian Maritime University, Indian Ports Association.
Received Date: February 22, 2024
Accepted Date: May 13, 2024
Published Date: May 27, 2024
Citation: Satyendra Nath Chakrabartty. (2024) “Methodologically Sound Measures of Disease Severity: Case of Tinnitus Disorders.”, International Journal of Medical Case Reports and Medical Research, 2(3); DOI: 10.61148/2994-6905/IJMCRMR/032.
Copyright: © 2024. Satyendra Nath Chakrabartty. This is an open access article distributed under the Creative Commons Attribution License, which permits unrestricted use, distribution, and reproduction in any medium, provided the original work is properly cited.
Background: Patient-reported-outcomes (PRO) scales, health related quality of life (HRQoL) tools used in disease assessment differ on various aspects and suffer from methodological limitations. The paper discusses methodological limitations of rating scales with Tinnitus disorders as an illustrative case and provides a methodologically sound method of converting scores of i-th item and also health-profile from EQ-5D-5L to equidistant scores followed by standardization and further transformation to proposed scores (Pi ) ranging from 1 to 100. Dimension scores (Di)
  is sum of Pi
 -scores of items/indicators belonging to a dimension. Tinnitus severity Index (TSI) is the scale score = sum of Djs
 = sum of all Pjs
 and can include all indicators in ratio or ordinal scale irrespective of scale formats without any bias for advantaged or disadvantaged groups.
Results: TSI satisfy desired properties, facilitate meaningful aggregation, parametric analysis, regression equations involving TSI, HRQoL, assessment of progress/deterioration, and psychometric parameters in better fashions.
Conclusions: The method is well applicable for scales to assess severity/disability of any disease where disease-status is assessed by PROs and pathological, clinical variables and various HRQoL instruments. Needs for further investigation on robustness and clinical validations are proposed.
Background:
Diseases affect organ functions (both irreversible and reversible components) and also emotional, social, mental health, cognitive functions, etc. and thus affect health related quality of life (HRQoL). Extent of disabilities and impairments tend to increase as severity of disease increases. Objective clinical and pathological indicators are not sufficient to assess the overall effect of disease. Accordingly, rating scales including patient-reported-outcomes (PRO) measures are extensively used in disease assessment. While symptoms, disabilities are subjectively reported or objectively observed, conceptual boundaries of multi-dimensional HRQoL questionnaires using Likert items or Numeric rating scales (NRS) or EQ-5D-5L EuroQoL tools to assess impact of diseases on quality of life (QoL) differ in scopes, dimensions covered, length and width of scales, scoring methods, etc. often blurred what is being measured and may not always match with clinical and research goals [1]. Large number of generic and disease-specific HRQoL instruments result in confusion about the best use of an instrument and even popular instruments show different correlations with the dimensions [2]. For better interpretations of results and adequacy of conclusions, reviews of methodological quality of HRQoL scales were suggested [3].
The paper discusses methodological limitations of summative scoring of PROS and rating scales in different formats (number of items and number of response-categories) with Tinnitus disorders as an illustrative case and provides a methodologically sound assumption-free method for converting item-scores to continuous, monotonic, normally distributed scores ensuring better arithmetic aggressions, better comparisons, satisfying desired properties of measurement, parametric analysis including statistical testing, prediction of psychological functioning or HRQoL avoiding major limitations.
Literature survey:
Tinnitus disorders and HRQoL:
Tinnitus is a hearing disorder associated with a number of audio logical, cognitive, and neurological factors including among others listening difficulties, poor concentration, stress, anxiety, depression [4]. In short, Tinnitus is a subjective sensation of a sound in the absence of sound sources, external stimulus [5]. No satisfactory objective tools are there to measure extent of audio logical disorder due to Tinnitus [6]. NICE guideline-155 [7] considered tests like Audiometry (hearing assessments), Tympanometry (function of ear drum and middle ear), Acoustic reflexes (functioning of the middle ear muscles against loud sounds), Uncomfortable loudness level (ULL)/Loudness discomfort level (LDL), Otoacoustic emissions (OAEs), etc. to assess several outcomes like Tinnitus severity and its impacts, HRQoL, associated complaints (depression, sleep, anxiety, etc.). But, use of such tests varied significantly and acoustic reflexes and ULL/LDL tests, OAEs may cause harms. There is no universally accepted effective treatment that can radically cure tinnitus [8]. Instead, PROs are used to measure tinnitus severity (TS), changes due to treatments, etc. [9].
Two popular questionnaires in this context are Tinnitus Handicap Inventory (THI) [10] and Tinnitus Functional Index (TFI) [11]. 25 items of THI are distributed over three subscales: functional (11-items), emotional (9-items), and catastrophic (5-items). Each item is 3-point (0: none, 2: sometimes, 4:always). Total score, calculated by summing all responses, ranges from 0 to 100, where higher score implies greater handicap from tinnitus. Thus, improvement is indicated when THI score is reduced. A single factor solution emerged from factor analysis (FA) of THI and thus, separate analysis with subscales is not relevant [12].
TFI covers eight domains (intrusiveness, sense of control, sleep, cognition, auditory, relaxation, QoL, and emotional impact of tinnitus), to measure TS. Scoring of TFI is not so simple like THI. Here, responses to Item1 and 3 are transformed from percentage scale to 0-10 scale. Each subscale contains 3 items except for the QoL-subscale with 4 items. Overall TFI scores are found by the following steps:
However, if a respondent omits 7 or more items, his/her overall TFI score is not valid. Moreover, overall TFI score ≠ sum of the subscale scores.
The proposed 8-factor structure of TFI was not fully confirmed for non-clinical sample [13] who opined that floor effects in most of the TFI items may not make the scale a good measure of change. Four factors of Italian version of TFI were found [14]. Instead of Time consuming THI with 25 items, simplified version of Tinnitus Handicap Inventory (THI-S) with 10 items was introduced to assess severity of tinnitus handicap and associated psychological distress [15].
THI and TFI global scores were compared by a cohort study [6] with Enriched Acoustic Environment therapy and found TFI >THI at lower level of severity and TFI <THI for higher severity, implying different distributions of THI and TFI scores. Despite high correlation between TFI and THI at the level of 0.77 [14], TFI was preferred due to higher responsiveness to changes resulting from treatments [13].
In addition to auditory problems, association of tinnitus with the central nervous structures for the pathophysiology of tinnitus was found [16]. Review of tinnitus symptoms by [17] observed that patients with tinnitus suffered from frustration, annoyance, irritation, anxiety, and depression with impaired QoL. However, cause and effect relationships of tinnitus severity and relevant psychological factors are not known. Thus, empirical relationships can be explored to establish relationships of TS and psychological disorders and the resulting HRQoL.
A number of generic and disease specific instruments are there to assess cognitive disorders and HRQoL. For example, [18] considered THI and Tinnitus Questionnaire (TQ) [19] for assessment of TS and SCL-90-R containing 90-items distributed over three global categories (Global Severity Index, Positive Symptom Distress Index and Positive Symptom Total) and nine inter-correlated subscale categories (somatization, obsession–compulsion, interpersonal sensitivity, depression, anxiety, hostility, phobic anxiety, paranoid ideation and psychoticism) and found that emotional factors and socio-demographic variables influence TQ and THI scores in different ways. Tinnitus patients showed high scores in depression component of SCL-90-R primarily due to overlapping of some items in these questionnaires [20]. Considering Hospital Anxiety and Depression Scale (HADS),Comprehensive Psychopathological Rating Scale (CPRS-S-A) and SCIP–P for psychiatric diagnosis in accordance with the DSM-III-R to assess severity of anxiety and depression, [21] found moderate correlations between TS and psychiatric disorders and depression , but lower correlation for anxiety related disorders.
Different scales to assess tinnitus handicap and different tests to detect impacts of tinnitus handicap on psychological functioning or HRQoL are not comparable since the tests differ in number of items, number of levels in items, scoring methods, factors/constructs and different distributions of scores of respective tests. Good measure of TS and its impacts is felt needed with theoretical and methodological rigor. [22] emphasized that ordinality, discreteness, nonlinearity, skew, ceiling and floor effects in rating data create problems for undertaking parametric statistical analysis. Normality checks of rating data are necessitated for inference procedures [23].
Major limitations of ordinal scores:
Not-meaningful Addition:
Levels of a Likert item are ordered but not equidistant [24]. Construct-distance in a THI item from “none” to “sometimes” ≠ distance between “always” and “sometimes”. Non-satisfaction of equidistant property of ordinal item implies addition is not meaningful. Meaningful addition of X+Y=Z requires similar distribution of X and Y and also knowledge of distribution of Z. [25] reviewed areas regarding the level of rating scales emphasizing statistical perspectives in using such scales.
Non-satisfaction of normality assumptions:
[26] found gender effect on THI as THIFemale >THIMale
 . Usual procedure to test equality of mean score of two groups is through t-test or paired t-test, which assume normally distributed scores. Techniques like F-test, Principal component analysis (PCA), FA, etc. also assume normally distributed scores. Verification of normality is therefore required for adopting such techniques. Problems arise if test of normality fails.
Multiple linear regressions can be used to find empirical relationship of TS as dependent variable (Y) and various associated factors of Tinnitus as independent variablesX1, X2, ……, Xm . Similarly, and to predict Psychological/emotional disorders or HRQoL. However, major assumptions of multiple linear regressions are: linearity; normal distribution of errors in prediction (residuals) with zero mean and constant variance (homoscedasticity), and no pair of independent variables are highly correlated (multicollinearity).
High value of correlation coefficient (r) or coefficient of determination (R2) may not justify linearity. For example, if X takes integer values from 1 to 30, rX,f(X)≥0.92
 for f(X) = X2, X3,
  log10X
 , and Sin X despite non-linear relationship between X and f(X). Regression equation of f(X) on X was not justified since error scores did not follow normal distribution [27].
Moreover, observed value of correlation depends heavily on group heterogeneity and may not confirm high comparability. [27] gave an example where X~ N(0,1) and Y =12π e-12X2. Here,
 rXY
rXY = - 0.93302 for 0≤X≤3.9
 and rXY= 0.0004 for -3.9≤X≤3.9
 , indicating that homogeneity of data may underestimate or overestimate the correlation. Thus, value of (r) or R2
 may not always justify fitting of regression equation.
Comparability:
[28] Concluded:
However, concept of comparability is different from correlation. Comparability of two scales (Scale-1 and Scale-2) may demand that for any given score x0  of Scale-1, one can find uniquely corresponding score y0
 of Scale-2 and vice versa; equal rank orderings by the scales, even if the scales have different formats. For example, X and 1X
 are quite comparable despite
rX,1X = - 0.65 for X: 1, 2, 3 …30.
High value of test-retest reliability (rtest-retest) of THI-S may not imply that THI-S is a robust measure. rtest-retest
  of THI-S may be high if there is no effect of treatments or scores of each subject improved or deteriorated uniformly due to treatments. Such reliability may not reflect true stability of the construct (s). Practice or learning effects during the time can influence rTest-retet
 values depending on time gap, for which no consensus exists. Thus, the assumption of unchanged true scores may not hold always. [29] used correlation, and not agreement to find rtest-retest
  of Internet Addiction Test developed by [30]. Clearly, rtest-retest
 may not be a sufficient condition to demonstrate agreements.
Non-equivalent boundary points:
THI score of 0-16 means "no or slight handicap", 18 to 36 indicates "mild", 38 to 56 indicates "moderate", 58 to 76 indicates "severe", and a score of 78-100 is classified as "catastrophic handicap". For TFI, scores between 0 and 18 are low severity; scores between 18 and 42 are lower moderate; scores between 42 and 65 are upper moderate; and scores greater than 65 are high severity. Clearly, boundary points of classifications are different for THI and TFI.
Question arises whether THI score of 16 is equivalent to TFI score of 18. Similarly, equivalency of 100 (in THI) and 65(in TFI) can be questioned. In other words, if percentage of subjects up to 100 (in THI) = percentage of subjects up to 65(in TFI), then 100 in THI is equivalent to 65 in TFI and vice versa. Equivalent sores of two scales say THI and TFI can be obtained by solving the equation -∞x0fxdx=-∞y0gydy
 (1)
(1)
where x  and gy
 denotes the normal pdf of THI and TFI respectively and x0
 is a given value of THI (say). The equation (1) ensures area of the curve fx
 up to x0= area of the curve gy up to y0
 which can be solved using standard Normal table, irrespective of scale formats and dimensions. Equivalent score combinations {x0, y0}
 are perfectly correlated and give same ranking of individuals with respect to either x0 or y0.
Psychometric qualities:
Validity:
Exploratory factor analysis was used along with Cronbach’s alpha andrtest-retest , convergent and discriminant validity of I-TFI [14]. Here, convergent validity was found considering I-TFI total scores and subscale scores with the global scores from the THI and the 11-point Numeric Rating Scale of annoyance (NRS-A) (where item scores ranges from 0 (minimal annoyance) to 10 (maximum annoyance) specified by ISO 15666-2021[31]. The discriminant validity was found by correlating the total and sub-scale scores of the I-TFI with the global Beck Depression Inventory-Primary Care Version (BDI-PC) scores (an instrument with 7number of 4-point items from 0 to 3 for assessing depression) [32].
Convergent and discriminant validities are two aspects of construct validity where scores of the test in question is correlated with a chosen criterion scale. The selected criterion scale with different score distributions, different factor structures and factor loadings, different domains of one or more constructs etc. may influence the validity as a correlation coefficient. Different selections of criterion scale may give rise to different values of validity of a scale. Other illustrative factors influencing validity of a PRO could be participant bias, social desirability, demand characteristics, etc. [33]. High correlation between test scores and criterion scores may imply that the test is not needed and the criterion scale will suffice. In addition, construct validity is difficult to interpret when a test measures several factors. Better is to avoid the problems of construct validity and assess validity of a test by factorial validity (FV) which is defined as
FV= λ1λi (2)
(2)
where λ1  denotes the highest eigenvalue corresponding to the main factor for which the scale was developed. λi
 is the sum of eigenvalues = trace of the variance-covariance matrix = Sum of item variances. Clearly, FV is high for unidimensional tests. FV reflects validity of the main factor for which the test was developed [34]. Tracy–Widom (TW) statistic can be used to test significance of the largest or other eigenvalues [35].
Reliability:
Cronbach’s alpha is commonly used to find test reliability as a measure of internal consistency, which is concerned with the homogeneity of the items within a test. Thus, alpha works best for one-dimensional test. Alpha assumes uncorrelated errors and tau-equivalent items which imply all the factor loadings are same [36].  However, equality of factor loadings is rather rare for tests on cognitive tasks [37]. If items are not essentially tau-equivalent and the test measure different constructs i.e. multi-dimensional tests, alpha may get distorted. However, many scales like TFI reports alpha despite finding several factors from PCA or FA. α>0
  if i≠k=1mCov(Xi,Xj)>0.
 The construct with highest eigenvalue had the maximum alpha [38]. Using results of PCA, [39] proposed test reliability
αPCA= (mm-1) ( 1-1λ1)
 (3)
(3)
where λ1 is the first (largest) eigenvalue of correlation matrix of m-number of items. Equation (2) and (3) can help to derive relationship between FV and αPCA
 .
.
Sampling distribution of alpha was derived by [40] assuming (i) items are essentially τ-equivalent, (ii) normally distributed true scores and measurement errors and found that 1-α1-α~Fn-1, n-1.k-1 where n denotes the sample size and k denotes the number of items in the test, α is the population coefficient and α
 the sample estimate.
Clearly, different methods of finding reliability deviating from definition of reliability may give different values of reliability even from the same sample. [41] proposed finding theoretical reliability (rtt(Theoretical) as per its definition from single administration of the test containing m-items as
rtt(Theoretical)=1-Xg2+ Xh2-2XgXhCosθghnSX2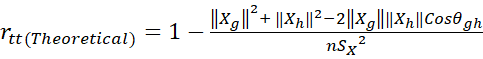 (4)
(4)
where the test is dichotomized to two parallel sub-tests (g-th and h-th) each with m2 items, Xg
  and Xh
  are length of the sub-test vectors Xg and Xh respectively computed as Xg=i=1m2Xig2
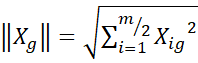 and Xh=i=1m2Xih2 and θgh
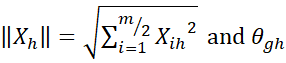 is the angle between the Xg
 and Xh
 .
.
Proposed method:
[41] proposed transformation of raw scores of i-th Likert item to continuous, monotonic equidistant scores (Ei -scores) by taking data based positive weights Wi1, Wi2, Wi3, Wi4,Wi5
considering frequency of response-categories of an item so that 5Wi5-4Wi4 = 4Wi4-
 3Wi3=
3Wi3= 3Wi3-
3Wi3- 2Wi2=2Wi2- Wi1
 = Constant, value of which is different for different items.
For an EQ-5D-5L items, weights are taken as proportion of responses in j-th level of i-th item i.e. Wij = fijn
 . Health-profile of a person is taken as weighted sum. For example, profile of
1-2-3-4-5 for i-th person (Ei) is 1(W11)+ 2(W22)+3W33+4W44+5(W55)
 which is different from the profile 5-4-3-2-1 for j-th person Ej=
 5(W11)+4(W22)+3W33+2W44+1(W55)
 .
.
Ei-scores as weighted sum are standardized to Zi=Ei- EiSD(Ei) ~N(0, 1)
 and further transformed to get proposed score Pi
  by Pi=100-1Zi-MinZiMaxZi-MinZi+1
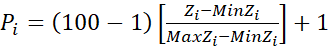 (5)
(5)
where 1≤Pi≤100 ensures uniformity in item score–range.
Normally distributed Pi scores of items/indicators belonging to a dimension can be added to get dimension scores (Di) . Tinnitus severity Index (TSI) is defined as the scale score which is the sum of the dimension scores = sum of all item-wise Pi-
 scores.
TSI and also Dis will follow normal. For example, if scores of the i-th item ~Nμi, σi,
  TSI ~ normal with mean iμi
 and variance [σi2+ 2i≠jCov(Pi,Pj].
  Thus, probability density function (pdf) of TSI as convolution of item-wise normally distributed Pi-scores can be found where parameters of the distribution of TSI can be estimated from the data.
Empirical Illustration:
Illustration of the proposed transformation of ordinal raw scores of items to continuous, monotonic equidistant scores (Ei-scores) by data based weights to different response-categories of different items are given below with hypothetical data of a scale with five items with response-categories 1, 2, 3, 4, 5 with n=100 are given in Table-1 and Table-2 below.
|
Description |
Response-categories |
Total |
|||||
|
1 |
2 |
3 |
4 |
5 |
6 |
||
|
Item-1 |
|
|
|
|
|
|
|
|
Frequency |
13 |
16 |
12 |
19 |
23 |
17 |
100 |
|
Weights |
0.100959 |
0.156487 |
0.174996 |
0.18425 |
0.198903 |
0.193505 |
1.0 |
|
Item-2 |
|
|
|
|
|
|
|
|
Frequency |
13 |
13 |
9 |
31 |
21 |
13 |
100 |
|
Weights |
0.060926 |
0.150284 |
0.18007 |
0.194963 |
0.203899 |
0.209856 |
1.0 |
|
Item-3 |
|
|
|
|
|
|
|
|
Frequency |
7 |
17 |
11 |
32 |
25 |
8 |
100 |
|
Weights |
0.047138 |
0.148148 |
0.181818 |
0.198653 |
0.208754 |
0.215488 |
1.0 |
|
Item-4 |
|
|
|
|
|
|
|
|
Frequency |
15 |
11 |
20 |
13 |
13 |
28 |
100 |
|
Weights |
0.081631 |
0.157324 |
0.155346 |
0.195171 |
0.202741 |
0.207787 |
1.0 |
|
Item-5 |
|
|
|
|
|
|
|
|
Frequency |
21 |
18 |
17 |
11 |
13 |
20 |
100 |
|
Weights |
0.101289 |
0.156638 |
0.174954 |
0.184152 |
0.189687 |
0.19337 |
1.0 |
Table 1: Items and weights to response-categories.
Item-wise mean and SD of Raw scores, E- scores and normal distribution of P-scores are shown below.
|
6-point Items |
Raw scores(X) |
E- scores |
Distribution of P-scores |
||
|
|
X |
SD(X) |
E |
SD(E) |
|
|
1 |
3.74 |
1.673 |
0.126 |
0.355 |
N( |
|
2 |
3.73 |
1.569 |
0.141 |
0.376 |
N( |
|
3 |
3.75 |
1.395 |
0.119 |
0.345 |
N( |
|
4 |
3.82 |
1.800 |
0.183 |
0.428 |
N( |
|
5 |
3.37 |
1.829 |
0.150 |
0.387 |
N(47 |
|
Scale |
18.41 |
3.621 |
0.681 |
0.825 |
N( |
Table 2: Item-wise mean and SD
For EQ-5D-5L, weights to i-th level of j-th dimension is taken as
Wij=nijn  =Freq. of (i-j)th cellSample size
  is illustrated in Table-3 with hypothetical data (n=463).
|
|
Dimention1 (Frequency) and weight |
Dimension 2 (Frequency) and weights |
Dimension 3 (Frequency) and weights |
Dimension 4 (Frequency) and weights |
Dimension 5 (Frequency) and weights |
|
Level 1 |
(30) 30463= |
(18) 0.038877 |
(35) 0.075594 |
(20) 0.043197 |
(178) 0.384449 |
|
Level 2 |
(111) (0.239741) |
(24) 0.051836 |
(57) 0.12311 |
(53) 0.114471 |
(101) 0.218143 |
|
Level 3 |
(113) 0.24406 |
(23) 0.049676 |
(22) 0.047516 |
(198) 0.427646 |
(27) 0.058315 |
|
Level 4 |
(168) 0.362851 |
(161) 0.347732 |
(167) 0.360691 |
(165) 0.356371 |
(91) 0.196544 |
|
Level 5 |
(41) 0.088553 |
(237) 0.511879 |
(182) 0.393089 |
(27) 0.058315 |
(66) 0.142549 |
|
Total |
(463) 1.0 |
(463) 1.0 |
(463) 1.0 |
(463) 1.0 |
(463) 1.0 |
Table 3: Weights to different Level–Dimension combinations
Results:
Item-wise mean and SD of P-scores and scale scores followed normal distributions, data-driven parameters of which were derived.
Score of the profile 1-2-3-4-5 is 1(0.064795) +2(0.051836)+ 3(0.047516) + 4(0.356371)+5(0.142549) = 2.449244 which is different from the score of profile 5-4-3-2-1 = 5(0.088553)+4(0.347732)+3(0.047516)+2(0.114471)+1(0.384449)= 2.589633
TSI scores followed normal considering pattern of responses unlike summative Likert scores and gave unique ranks to the individuals satisfying desired properties like:
 and ∆DSITSI∆DiDi
 to show relative importance of the dimensions from two different angles.
Benefits:
Provides total score of an individual for any scale irrespective of factor structures unlike SF-36 [42].
Progress/deterioration of the i-th patient in t-th time-period over the previous year is assessed by (TSI)it-(TSI)i(t-1)(TSI )i(t-1)×100 which quantifies responsiveness of TSI-scale and effectiveness of adopted policy measures. (TSI)it>(TSI)i(t-1) ⟹
 Progress in t-th period over (t-1)-th period. Deterioration may be probed to identify the dimension(s) where deteriorations occurred and initiate possible corrective actions. Similarly, progress for a group of patients is indicated if (TSI)it>
 (TSI)i(t-1)
Plotting of progress/deterioration of one or a sample of patients across time helps to compare progress pattern that is, response to the treatments from the beginning of the longitudinal study. A decreasing graph of TSIit and time (t) indicates improvement of the i-th patient over time and an increasing graph will indicate the reverse. Such plot is akin to hazard function of survival.
Responsiveness  of TSI enables practitioners or researcher to know time-to-event outcomes from the beginning of observation (time of diagnosis) to the occurrence of the relevant events (disease recurrence or progress/deterioration of TS) as a continuous variable.
Possible to find extent of association between TSI-scores and HRQoL-scores as Pearsonian correlation or by multiple correlation between TSI-scores and dimension scores of HRQoL or as canonical correlation between dimensions of TSI and dimension of HRQoL along with finding equivalent score combinations of TSI and HRQoL.
Regression equation of TSI on HRQoL can be fitted using HRQoL scores (or dimensions scores) as predictors of TSI. Equation of the form HRQoL scores=α+β.TSI  can also be fitted to know effect of TSI on HRQoL. However, checking normality of error scores is needed in fitting regression equations.
Facilitates statistical tests of equality of mean and variance of TSI for two groups or a single group at different time periods like H0: μ1=μ2 or H0: σ12=σ22
 using longitudinal data or snap-shot data. Statistical tests of significance of progress of TSI or i-th dimension of TSI can be tested by H0: (TSI)it-(TSI)i(t-1)(TSI)i(t-1)=0 or H0: Dit-Di(t-1)Di(t-1)=0
 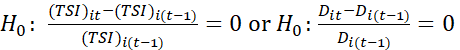 since ratio of two normally distributed variables~χ2
  distribution
Estimation of TSI  and σTSI2
 at population level can be made from a representative sample of patients drawn from the country/region.
A group of patients can be classified into four mutually exclusive classes in terms of TSI-scores by quartile clustering with equal probability to each class i.e.
0Q1fxdx=Q1Q2fxdx=Q2Q3fxdx=Q3Q4fxdx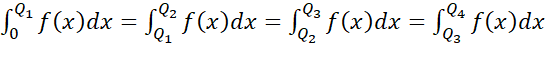
If item scores are transformed to P-scores before dichotomization, it  helps to test H0: rtt(Theoretical)=1
 which is equivalent to H0: σX2=σT2
 by F
by F -test. P-scores also help to test whether subtest scores are parallel by testing H0:
 μg
μg = μh
= μh by t-test and H0: σXg2
 = σXh2
 by F-test. Other tests of parallelism of g-th and h-th sub-tests are equality of regression lines X=α1+β1Xg
 and X=α2+β2Xh
 by ANOVA or by Mahalanobis D2=dTS-1d
 where di=Xgi-Xhi
 for the i-th item.
P-scores enable undertaking PCA and compute factorial validity as ratio of first eigenvalue and sum of all eigenvalues to reflect validity of the main factor being measured by the test.
Discussion:
The paper addresses methodological issues of tools measuring Tinnitus severity and HRQoL and proposes remedial measures by transforming ordinal item scores of each scale to follow normal distribution for meaningful evaluation of measurement properties and better utilization of such tests. Normally distributed proposed scores (P-scores) satisfy desired properties, facilitate meaningful aggregation, better comparisons and rankings, offer platform for parametric analysis including statistical testing, fitting regression equations of TSI on HRQoL or HRQoL on TSI. P-scores also helps to find reliability as per theoretical definition, factorial validity avoiding criterion variable, association between TSI and HRQoL or their dimensions, assessment of progress/deterioration of one or a group of patients, efficiency of classification, equivalent scores of two tests, etc.
Proposed method can include all indicators (pathological, clinical and patient-reported- outcomes) either in ratio scale or in ordinal scale irrespective of scale formats without any bias for advantaged or disadvantaged groups.
The method is well applicable for different formats of scales to assess severity/disability of any disease trying to assess disease-status by PROs and pathological, clinical variables and also various HRQoL instruments including EQ-5D-5L.
Conclusions:
The paper suggests a simple method of obtaining TSI-score and HRQoL-score of patients considering multi-criteria goals by normally distributed P-scores, avoiding limitations of existing methods which are either not methodologically sound or involve assumptions, verification of which are difficult. The method helps to find the growth curve of TSI, which in turn provides another criterion for comparisons.
However, the proposed method requires careful selection of dimensions and items within a dimension. The proposed method with wide application areas satisfying desired properties advances scholarly. Practitioners and researchers can take advantages of the proposed method for meaningful analysis, including plotting of progress/deterioration path which is akin to hazard function of sample patients.
Empirical verifications of the proposed method, its robustness and estimation of hazard function and clinical validations are proposed as future studies.
List of abbreviations:
ANOVA: Analysis of variance
BDI-PC: Beck Depression Inventory-Primary Care Version
CPRS-S-A: Comprehensive Psychopathological Rating Scale
DSM-III-R: Diagnostic and Statistical Manual of Mental Disorders
EQ-5D-5L: EuroQol 5dimensions 5 levels
FA: Factor Analysis
FV: factorial validity
HRQoL: Health related quality of life
HADS: Hospital Anxiety and Depression Scale
I-TFI: Italian Tinnitus Functional Index
NRS: Numeric rating scales
OAE: Otoacoustic emissions
PCA: Principal component analysis
PROS: Patient Reported Outcome scales
SCIP - P: Surgical Care Improvement Project for Psychiatric Diagnosis
SCL-90-R: Symptom Check-List-90-R
TFI: Tinnitus Functional Index
THI: Tinnitus Handicap Inventory
THI-S: Simplified version of Tinnitus Handicap Inventory
TS: Tinnitus severity
TQ: Tinnitus Questionnaire
QoL: Quality of life
ULL: Uncomfortable loudness level
LDL: Loudness discomfort level


Open Access By Aditum Open Access Journals id licensed under Creative Commons Attribution 4.0 International License. Based On a Work at aditum.org


 55.107,33.0462)


 .926,36.2212)

