
International Journal of Epidemiology And Public Health Research
OPEN ACCESS | Volume 9 - Issue 1 - 2026
ISSN No: 2836-2810 | Journal DOI: 10.61148/2836-2810/IJEPHR


Shilpi Saha1, Puja Saha1, Sandipan Paul2, Joydip Saha1, Satyapriya Roy3*
1Department of MLT, Bhavan’s Tripura College of Science and Technology (BTCST), Anandanagar, West Tripura.
2Research Scholar, Department of Statistics, Cotton University, Panbazar, Guwahati, Assam, India.
3Department of Human Physiology, Government Degree College Kamalpur, Dhalai Tripura, India.
*Corresponding author: Satyapriya Roy, Assistant Professor, Department of Human Physiology, Government Degree College Kamalpur, Dhalai Tripura, India.
Received: June 29, 2026 | Accepted: July 04, 2026 | Published: July 22, 2026
Citation: Saha S, Saha P, Paul S, Saha J, Roy S., (2026) “Correlation of Body Fat Composition with Serum Cholesterol and Fasting Blood Sugar in College Students”. International Journal of Epidemiology and Public Health Research, 9(5); DOI: 10.61148/2836-2810/IJEPHR/206.
Copyright: © 2026. Satyapriya Roy, This is an open access article distributed under the Creative Commons Attribution License, which permits unrestricted use, distribution, and reproduction in any medium, provided the original work is properly cited.
This study investigates the crucial link between body composition and future health risks, particularly obesity-related disorders like diabetes and heart disease, in adolescents. Focusing on 120 college students (19-23 years) from Bhavan's Tripura College of Science and Technology, Anandanagar, West Tripura, we conducted a cross-sectional analysis. Anthropometric data, including height and weight, triceps and subscapular skinfold measurements, waist and hip circumference, were recorded. These measurements enabled calculations of body Fat percentage (%BF), fat mass (FM), Waist-Hip ratio (WHR), body Mass Index (BMI), fat mass index (FMI), fat-free mass (FFM), fat-free mass index (FFMI) etc. Additionally, biochemical analyses assessed serum sugar and cholesterol levels. This comprehensive approach helped evaluate body fat composition, exploring correlations between %BF, sugar and cholesterol levels in relation to BMI. The result shows that a significant co-relationship between serum cholesterol and fasting blood sugar levels. And the findings of this study also show that serum cholesterol and sugar levels are increased in female students compared to male students, and also who are overweight, obese, or underweight, while impact on their healthy life.
Body composition, diabetes, blood cholesterol, overweight, CVD, healthy life
Obesity is characterized by an excessive accumulation of fat that results in abnormal body weight gain. It is a critical global health issue, closely linked to cardiovascular diseases (CVD) and is a leading cause of both mortality and morbidity worldwide (1). Obesity typically arises due to an imbalance between caloric intake and energy expenditure, with energy intake surpassing energy output (2, 3). This condition is further complicated by various health challenges, such as vascular and metabolic dysfunctions, and is particularly concerning in children, adolescents, and young adults. Obesity contributes to the development of a multitude of morbidities, including stroke, coronary artery disease (CVD), dyslipidemia, type 2 diabetes, hypertension, gastroesophageal reflux disease (GERD), obstructive sleep apnea (OSA), osteoarthritis, insulin resistance, carpal tunnel syndrome, and even certain types of cancer (4-8).
Commonly employed methods for assessing obesity include body mass index (BMI), waist-to-hip ratio (WHR), and body fat percentage (%BF), often supplemented by monitoring blood glucose and cholesterol levels. Obesity continues to rise globally, with estimates suggesting that nearly 2 billion people will be classified as obese, and 13% of adults already fall into this category (9).
Biochemically, glucose is metabolised to fatty acids that form body fat level of BMI which causing increased lipid biosynthesis and also creates cholesterol; hence body weight will increase (10). Insulin is secreted from beta cells of the islets of Langerhans in the pancreas that binds to the specific cell receptor results in enhancing glucose uptake into the cell (11). Insulin is an anabolic hormone acts in energy conversation and hence suggests the body to produce fat. As body fat and overall weight increase, so does BMI. Increasing BMI level, insulin resistance are increasing as a result blood glucose level increased. As blood glucose increases, the cholesterol level also increases. Since, it may be expected that blood sugar level and cholesterol level are correlates by BMI level. While BMI is the most widely used metric for evaluating obesity, it remains a suboptimal tool for diagnosing CVD and metabolic disorders.
The measurement of waist and hip circumference can complement BMI, providing a more comprehensive assessment of CVD and metabolic disease risk. Excess visceral adipose tissue is particularly linked to CVD, and dysfunctional subcutaneous adipose tissue may lead to ectopic fat deposition, such as in the heart, liver, skeletal muscles, and pancreas (12). This visceral fat, often referred to as visceral obesity, plays a crucial role in CVD development and is influenced by body composition phenotypes (13,14). The distribution of body fat can also vary depending on age, sex, genetics, and environmental factors (15,16). Therefore, assessing body fat quantitatively is vital for identifying potential health risks, especially related to CVD and metabolic disorders (17). Consequently, cross-sectional studies indicate a strong association between obesity, diabetes, and the risk of CVD complications.
Aims & objectives:
The aims of this study are as follows: -
Materials & methodology:
The cross-sectional study was steered out at the students of Bhavan’s Tripura College of science and Technology (BTCST), Anandanagar, West Tripura from April to May 2025. Students aged from 19-23 years readily partake in this research work after expressing willingness. The processed willingness encircles the narrate of the medical history such as sex, age, socio-economic condition, anthropometric variables and collection of data for biochemical analysis.
By using standard techniques, the anthropometric measurements are taken; these include triceps skin thickness (TRSF), subscapular skin thickness (SBSF), height, body weight, waist circumference (WC) and hip circumference (HC).
By wearing minimum clothing also with barefoot in the standing position of body weight and height were measured. For evaluated the height, a stadiometer was used. The head was held in the auriculo-orbital plane and the data were recorded to the nearest 0.1 cm. Weight was evaluated by means of a portable weighing machine and the data was recorded to the nearest 0.5 kg. For calculated body mass index (BMI) weight in kg was divided by square of height in meter, i.e., BMI = weight (kg) / height2 (m2).
For waist and hip circumference, a tap meter was used while the subject in a standing position. The WC was precision-measured at the axial mid-point, equidistant from the lower rib cage and the iliac-crest, with the abdominal muscles relaxed and arms in a neutral position. The measurement was calibrated to the nearest 0.1cm. Conversely, the HC was assessed as its maximum girth, situated between the hip and gluteal prominences, and recorded to the nearest 0.1 cm. The waist-to-hip ratio (WHR) was subsequently calculated by dividing the WC by the HC, yielding a valuable waist-to-hip ratio.
Skinfold thickness, such as triceps and subscapular skinfolds, was precisely quantified using a Holtain skinfold calliper, which applied a consistent spring pressure of 10 g/mm2, including the triceps and subscapular regions, on the right side of the body. Triplicate measurements were taken at each site, ensuring accuracy and reliability and the mean values were calculated to yield a single, representative data point. The process was repeated to obtain a comprehensive, standardized measurement providing a precise indicator of subcutaneous adiposity.
%BF = 1.33 (TRSF +SBSF) – 0.013 (TRSF +SBSF)2 – 2.5
FM (kg) = Body Weight(kg) × %BF/100
FMI (kg/m2) = %Bf × BMI/100
FFM (kg) = body weight × {1-(%BF/100)}
FFMI = FFM (kg) / height2 (m2)
Biochemical test was conducted through the precise quantification of glucose and cholesterol levels in blood sample.
Blood glucose levels were measured by utilizing glucose diagnostic kits in conjunction with a semi-automatic analyzer and BOD incubator. The enzymatic assay employed a glucose reagent, calibrated standards and serum specimens to facilitate an accurate and reliable measurement of glucose concentrations. A series of standardized glucose solution with predetermined concentrations were prepared, followed by the creation of a test sample mixture comprising 1ml of glucose reagent and 0.01ml of serum. This mixture was then incubated at 37◦cfor 10 minutes, allowing the enzymatic reaction to reach optimal levels. After incubation the intensity of the colour solution is measured by an analyzer and calculate the glucose level in blood serum.
Utilizing diagnostic kits in conjunction with a semi-automatic analyser and BOD incubator. The enzymatic assay employed a cholesterol reagent, calibrated standards and serum specimens to facilitate an accurate and reliable measurement of cholesterol concentrations. A series of standardized cholesterol solutions with predetermined concentrations were prepared, following by the creation of a test sample mixture comprising 1ml of cholesterol reagent and 0.02ml of serum. This mixture was then incubated at 37◦cfor 10 minutes, allowing the enzymatic reaction to reach optimal levels. Subsequently, an analyzer was employed to precisely measure the cholesterol levels in the blood sample, yielding a comprehensive cholesterol level.
A comprehensive excel spreadsheet was populated with detailed datasets, encompassing demographic information (name, age, sex) and an intensive array of physical and biochemical metrics. Advanced formulas were applied to facilitate intricate calculations, yielding mean and standard error values for each anthropometric variables, stratified by age and ethnicity. Categorical variables were elucidated through frequency distributions and percentage allocations. Subsequently, usable statistical analysis was conducted utilising the SPSS-19 statistical package, with a significant threshold set at P<0.05 to ensure the reliability of findings.
Result:
A total of 120 college students from three consecutive semesters participated in the study. The standard BMI values were categorized into three distinct groups: individuals with the BMI <18.5 were classified in the underweight, those with a BMI between 18.5-24.9 were considered to have a normal weight, while individuals with a BMI ranging from 25-29.9 were regarded overweight, and those with a BMI >30 were categorized as obese. Furthermore, the waist-hip ratio was classified into two groups: Non-obese (<0.85 cm) and obese (≥0.85 cm). A summary of the study variables is presented in table 1. It indicates that sex differences in body weight, height, Fat Mass Index, Fat Free Mass and Fat Free Mass Index are statistically significant (p value > 0.05). Table 1 represents the summary of study variables. As specially, a total of 120 participants, 59 females and 61 males, between 19 to 23 years of age were include in this study.
Table 1: Demographic, anthropometric and biochemical parameters in sample (n=120)
|
Parameters |
Female (n=59) Mean ± SD |
Male (n=61) Mean ± SD |
P-value |
|
Body Weight (Kg) |
56.39 ±12.31 |
67.24 ±14.85 |
0.000* |
|
Height (cm) |
153.60 ±6.50 |
166.10 ±6.98 |
0.000* |
|
BMI (Kg/m2) |
23.76 ±4.08 |
24.20 ±4.84 |
0.512 |
|
Waist circumference (cm) |
82.36 ±11.6 |
79.48 ±13.90 |
0.216 |
|
Hip circumference (cm) |
94.13 ±8.13 |
91.60 ±10.21 |
0.138 |
|
Waist to Hip ratio |
0.87 ±0.07 |
0.86 ±0.08 |
0.549 |
|
Fat mass (Kg) |
15.44 ±4.73 |
15.34 ±7.57 |
0.930 |
|
Fat Mass Index (Kg/m2) |
6.49 ±1.74 |
5.53 ±2.64 |
0.021* |
|
Fat Free Mass (Kg) |
40.94 ±8.00 |
51.80 ±9.93 |
0.000* |
|
Fat Free Mass Index (Kg/m2) |
17.26 ±2.61 |
18.77 ±3.24 |
0.001* |
|
Fasting Blood Sugar (mg/dl) |
103.72 ±28.65 |
96.23 ±23.43 |
0.119 |
|
Cholesterol (mg/dl) |
152.02 ±34.11 |
144.69 ±53.04 |
0.371 |
* Significant at p value <0.05
Table 2 represents the characteristics of visceral fat analysis of male and female students. According to body mass index 28.33% and 23.33% of female and male students are normal, respectively.
In the case of waist-hip ratio, girls (26.67%) are more obese than boys (25.83%).
Table 2: Characteristics of Visceral fat analysis (n=120)
|
Variables |
Female |
Male |
|
BMI |
||
|
Underweight (<18.5 kg/m2) |
4(3.33%) |
8(6.67%) |
|
Normal (18.5-24.9 kg/m2)) |
34(28.33%) |
28(23.33%) |
|
Overweight (25-29.9 kg/m2)) |
17(14.17%) |
17(14.17%) |
|
Obese (>30 kg/m2) |
4(3.33%) |
8(6.67%) |
|
WHR |
||
|
Non-obese |
27(22.50%) |
30(25%) |
|
Obese (≥0.85 cm) |
32(26.67%) |
31(25.83%) |
|
Cholesterol (mg/dl) |
||
|
Normal (<200 mg/dl) |
56(46.67%) |
56(46.67%) |
|
Elevated |
3(2.50%) |
5(4.16%) |
|
Fasting Blood Sugar (mg/dl) |
||
|
Normal (100-120 mg/dl) |
55(45.83%) |
50(41.67%) |
|
Elevated |
4(3.33%) |
11(9.17%) |
BMI: Body Mass Index; WHR: waist to hip ratio.
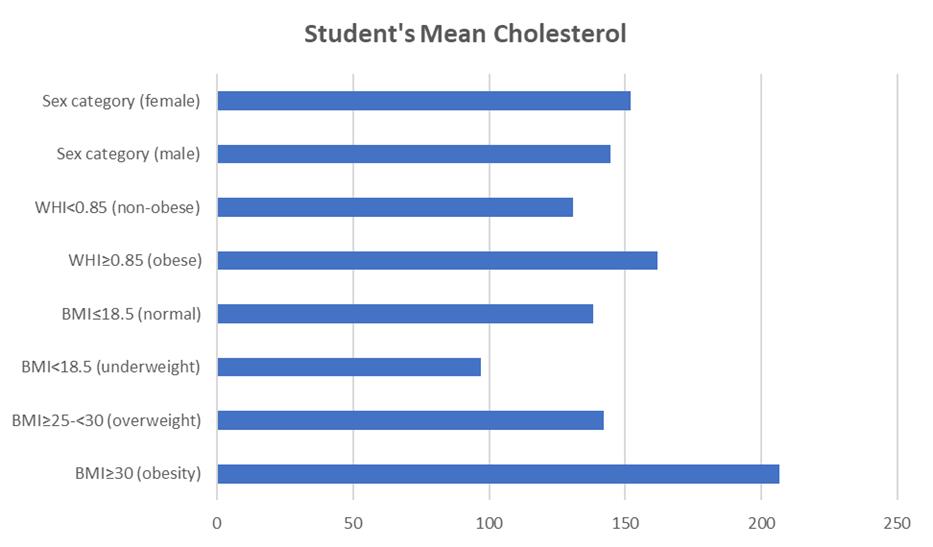
Figure 1: Student’s mean cholesterol level (mg/dl)
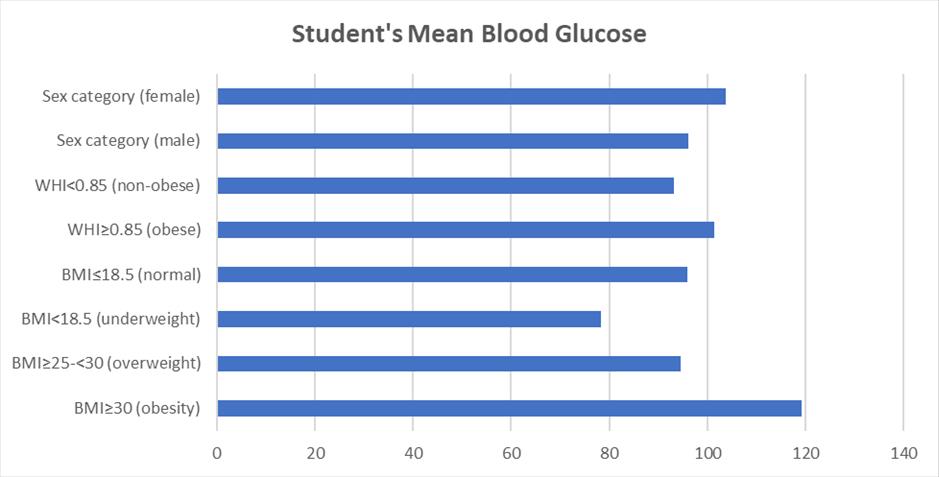
Figure 2: Student’s mean blood glucose level (mg/dl)
Table3: Correlation of cholesterol and blood sugar with different variables of body composition
|
Variables |
Cholesterol |
Fasting Blood Sugar |
r |
Adjusted r 2 |
p value |
|
Obesity (BMI) |
206.66±51.61 |
130.30±57.21 |
0.75 |
0.519 |
0.005* |
|
Overweight |
142.29±41.51 |
94.66±30.71 |
0.21 |
0.013 |
0.238 |
|
Underweight |
96.96±22.48 |
78.34±28.85 |
0.78 |
0.568 |
0.002* |
|
Normal |
138.43±36.19 |
95.86±17.68 |
0.29 |
0.068 |
0.022* |
|
Obese (W-H ratio) |
161.88±47.51 |
101.51±32.70 |
0.33 |
0.092 |
0.009* |
|
Non-obese |
130.94±30.81 |
93.13±13.55 |
0.43 |
0.168 |
0.001* |
|
Male |
144.69 ±53.04 |
96.23 ±23.43 |
032 |
0.086 |
0.012* |
|
Female |
152.02 ±34.11 |
103.72 ±28.65 |
0.51 |
0.254 |
0.000** |
*Significant p value<0.05 ** significant p value <0.001
The result of univariate analysis indicates there are significant relationships between all variables with the cholesterol and FBS levels. This analysis also indicates young female groups are more significant than young male groups. All fasting blood glucose and total cholesterol assessments are reported in mg/dl for consistency.
Discission:
In India, diabetes and cardiovascular disease/risk with the modest overweight, central obesity and reduced physical activity are seen (18). People with high cholesterol levels may be at increased risk of heart disease. If a person has too much LDL in their blood stream may cause [Centers for Disease Control and Prevention (CDC)] plaque buildup in their arteries which can lead to a blockage. High LDL levels may also raise a person's risk of stroke and (CDC) a person's heart disease risk twice. However, in a 2019 study, researchers from the American Heart Association (AHA) questioned the relationship between dietary cholesterol and heart health (19,20). However, a U.S-based meta-analysis found that eating half an egg per day may increase the risk of CVD by 6% (21). Similarly, two studies found that egg Consumption was associated with CVD risk in people with types 2 diabetes (22,23). In the NHANES-III (The third National Health and Nutrition Examination Survey) study demonstrated that a Surrogate measure of whole - body fat was associated with increased risk of CVD mortality (only in women), even after adjustment for waist circumference (24). Larger waist circumference has been associated with increased risk of CVD mortality in other populations with normal BMI (25). Higher gynoid fat was associated with decreased risk of myocardial infarction in men but not in women in a Swedish cohort of middle-aged and older adults (26). Being overweight or obese as an adult increases the risk of CVD by 1-2fold in men (27). From a clinical standpoint, the most typical lipid profile seen in obese individuals is the increase of fasting plasma, the decrease of HDL-C and the marginal increase of LDL-C in adults (28,29). Around one in every four deaths in the United States is a result of heart disease.
The majority of cardiovascular disease Risk factors-high blood pressure, cholesterol, overweight and obesity, tobacco use, lack of physical activity and diabetes. [Centers for Disease Control and Prevention (CDC) Previous research has found that individuals who carry excess abdominal fat, particularly around the waist surface a greater risk of heart disease, compared with people who have fat elsewhere. Dr Caroline Fox, a former Senior investigator for the National Heart, Lung and Blood Institute and the Study's Senior Researcher, and Colleagues aimed to identify abdominal fat and changes in cardiovascular risk factors. The observed variations may be attributed to genetic changes related to inherited conditions, as well as responses with alterations of FM and %BF (30). India's high average BMI raises questions about the role of genetic susceptibility in combination with lifestyle choices, particularly limited physical activity and exercise. Utilising obesity or overweight indicates fasting blood sugar (FBS) variations that correlate with BMI, BP, %BF etc.; the mean FBS level may be associated with sex hormones, food intake and body fat, etc. (31, 32); this investigation also helps to predict prediabetes.
Conclusion:
The findings of this study show that serum cholesterol and fasting blood glucose levels are higher in young female students than young male students, and also who are overweight, obese and underweight, while having an impact on their physical fitness. These results suggest that those who have higher BMI might be at risk of diabetes and cardiovascular diseases. Further, health education and regular physical activity may offer conservative benefits against these conditions. Regular health check-ups and healthier lifestyles provide a healthy life.
Ethics approval and consent to participate:
The Ethical Committee of Bhavan’s Tripura College of Science and Technology, affiliated to Tripura University, Department Medical Laboratory Technology, sanctioned ethical approval before data collection and the students were also provided their written consent. This study was conducted in accordance with the ethical guidelines for human experiments, as laid down by the Helsinki Declaration of 2000 (33).
Acknowledgement:
All participants, including staff members, lab technicians and students of BTCST, are acknowledged by the authors.
Authors’ contributions:
First, second and fifth authors participated in the study design, data collection, statistical analysis and interpretation of data, manuscript drafting, and critical revision for important intellectual content. The third and fourth authors participated in data analysis and interpretation, drafting the manuscript, and its critical revision for important intellectual and administrative content. All of the authors have read and approved the version of the manuscript.
Funding statement:
This study was financially supported by BTCST College authority. No funds had been received from any agencies.



Open Access By Aditum Open Access Journals id licensed under Creative Commons Attribution 4.0 International License. Based On a Work at aditum.org


