International Journal of Business Research and Management
OPEN ACCESS | Volume 4 - Issue 3 - 2026
ISSN No: 3065-6753 | Journal DOI: 10.61148/3065-6753/IJBRM


Rakotozandry A. Ignace 1*, Ravalison A. François 1,2,3
1University of Antananarivo, Project Engineering-Industrial Engineering, Madagascar.
2Centre National de Recherches Industrielle et Technologique, Madagascar.
3ISCAM Business School, Antananarivo, Madagascar.
*Corresponding author: Rakotozandry A. Ignace, 1University of Antananarivo, Project Engineering-Industrial Engineering, Madagascar.
Received: May 19, 2025
Accepted: May 20, 2025
Published: June 03, 2025
Citation: Rakotozandry A. Ignace, Ravalison A. François a, (2025). ‘Breakdowns Reduction and Reliability Improvement: Lean Engineering and TRIZ Based Methodologies”. International Journal of Business Research and Management 2(4); DOI: 10.61148/3065-6753/IJBRM/047.
Copyright: © 2025. Rakotozandry A. Ignace, This is an open access article distributed under the Creative Commons Attribution License, which permits unrestricted use, distribution, and reproduction in any medium, provided the original work is properly cited.
The textile industry, a basis of the global economy, faces determined challenges in maintaining competitiveness due to unplanned production stoppages and equipment breakdowns, which disrupt productivity, increase costs, and reduce profit margins. This study addresses the critical issue of reliability improvement in textile production systems, using the Malagasy company Btextile Sarl as a case study. The methodology, based on the Function Analysis System Techniques approach and stabilized by Lean Engineering through the Define Measure Analyse Improve Control framework, involves key steps: analogy-based modelling to define system dynamics, data simulations for graphical analysis, Gradient Descent optimization to enhance productivity, and Teoriya Resheniya Izobretatelskikh Zadatch principles to develop innovative solutions for minimizing breakdowns. The main results highlight practical strategies including preventive maintenance programs, sensor-based monitoring, and the implementation of digital solutions such as digital twins and Internet of Things, enabling agile and sustainable management approaches to effectively minimize breakdowns and enhance system reliability. While the findings present significant advancements, limitations such as the context-specific nature of the study and the partial applicability of thermal conduction analogies highlight the need for further research. The analogy used is not fully perfect, and the study's focus was limited to thermal conduction. Future research should explore the application of this methodology in industries beyond textiles to enhance its generalizability and tackle broader reliability challenges.
1. Introduction
The textile industry has been at the core of the global economy, making significant contributions in terms of revenue, employment, and innovations [1]. It plays a strategic role in global value chains while meeting essential needs such as the production of clothing, technical textiles, and household items [2]. Among these challenges are cost pressures, rapid technological advancements, and the growing demand for sustainability [3]. In this context, the reliability of industrial systems becomes a critical issue for maintaining competitiveness and meeting consumer demands. In particular, un-planned production stoppages, or breakdowns, have a significant impact on the performance of textile companies. These breakdowns not only cause delivery delays and slow down productivity but also incur additional costs, such as reliance on air transport, thereby reducing profit margins [4]. The example of the Malagasy company Btextile Sarl perfectly illustrates these challenges. Faced with high costs and unpredictable timelines, the company identified breakdowns as one of the main obstacles to its productivity. These breakdowns, often linked to other factors, remain particularly problematic due to their high frequency [3]. This raises the following research question: how can breakdowns be minimized while ensuring the reliability of equipment in garment production factories? Proactive and innovative management of industrial systems is essential to ensure reliable and efficient production. This article, therefore, focuses on improving reliability in the textile industry by specifically addressing the issue of machine stoppages. By combining approaches such as Lean engineering, modelling, artificial intelligence, and tools like TRIZ, this study aims to reduce the occurrence, frequency, and impact of breakdowns on productivity. It proposes practical, innovative, and strategic solutions within an adaptable management framework for textile companies operating in complex and competitive environments.
2. Literature Review
The results obtained from previous studies show that the application of Total Productive Maintenance or TPM combined with Lean practices has a direct impact on improving productivity in manufacturing processes, particularly in the garment industry [5]. By reducing losses related to machine breakdowns, optimizing cycle times, and minimizing waste, companies can significantly enhance their overall efficiency. The TPM approach helps reduce unplanned breakdowns through preventive and proactive maintenance, leading to improved machine availability, increased uptime, and reduced production costs [6] [7]. According to several studies, companies that have adopted TPM practices have observed an improvement in their OEE or Overall Equipment Effectiveness, which has directly contributed to increased productivity and reduced repair costs [8]. For example, Jagdeep Singh, Harwinder Singh, and Vinayak Sharma (2018) demonstrated that the systematic application of TPM can increase OEE by 17.08% [9]. Meanwhile, S. Nallusamy and Gautam Majumdar (2017) emphasized that this approach also promotes better utilization of human and material resources [10]. The combined application of TPM and Lean tools has also led to an improvement in product quality. By reducing breakdowns and optimizing processes, these approaches contribute to more stable and higher-quality production [11]. Proactive maintenance management helps prevent breakdowns that could affect product quality. The results show that companies adopting these practices experience a reduction in production defects, which leads to increased customer satisfaction and a decrease in costs associated with rework or waste [8]. Although many studies have highlighted the benefits of TPM and Lean tools, few have explored a methodological approach to scientifically model the production process to improve its reliability. In particular, there is a lack of work utilizing dynamic models capable of drawing scientific analogies between the operation of production lines and physical phenomena, thus enabling the identification of innovative solutions.
3. Research method
The following figure illustrates the research method. It summarizes the key steps as well as the tools used and applied throughout the process.
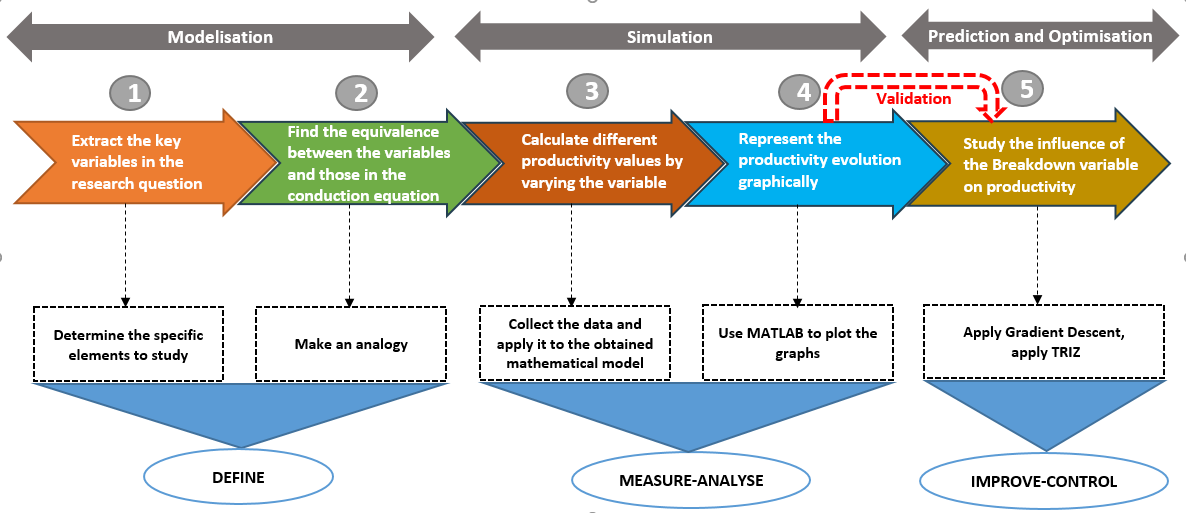
Fig 1. Research process
The design of the steps was based on the Function Analysis System Technique or FAST. FAST structures the method to ensure a logical and coherent progression throughout the research process. The method obtained reveals a Define Measure Analyse Improve Control or DMAIC. The latter is Lean Six Sigma method, by this means enriching the research method and strengthening its robustness. The first step of the method is to define the variables by extracting the key elements from the research question. The second step is about establishing an analogy between the identified variables and those in the conduction equation. This analogy facilitates the translation toward a mathematical framework. These two steps that form the modeling phase can be assimilated to Define. The third step concerns the calculation of productivity by varying the variables. To do this, data must be collected and applied to the mathematical model. The fourth step is to visualize the evolution of productivity through graphical representations. MATLAB is used to generate the necessary graphs. Steps 3 and 4 constitute the simulation phase which outlined to the Measure and Analyze stages of DMAIC. The final step involves studying the influence of variables on productivity. The Gradient Descent algorithm is applied to numerically validate the results obtained. Then, TRIZ is used to explore innovative solutions and optimize the system parameters. This final step is called the Prediction and Optimization phase, which aims to predict the system's behavior and identify optimization levers. It is structured around the Improve and Control stages.
3.1 DMAIC Process
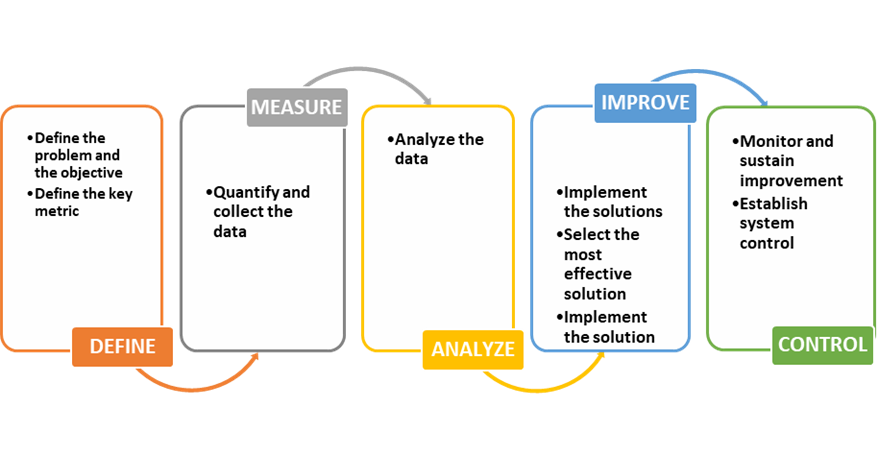
Fig 2. DMAIC Process
DMAIC, an acronym standing for Define, Measure, Analyze, Improve, and Control, is a generic problem-solving and improvement process [14]. The Define phase generally involves identifying the problem, classifying the project objectives, or characterizing the needs. In the Measure phase is about quantifying the data, gathering relevant indicators, and measuring key parameters. These steps are crucial for establishing a solid baseline and providing precise quantitative data for subsequent analysis in the improvement process [14] [15]. Related to the Analyze phase of the process, the collected data is analyzed using specific tools to identify the key relationships or underlying causes of the identified problems. This helps pinpoint areas of waste and inefficiency within the process, making it easier to identify improvement opportunities. Concerning the Improve phase, the most effective solutions are selected and implemented to achieve the defined objectives. This phase involves validating the proposed solutions and applying them to the process. Actions are taken to integrate the necessary changes and ensure their effectiveness in improving the system. About the Control phase, the focus is on continuous monitoring and maintaining the improvements made. This involves setting up control systems to track the performance of the process and ensure that the changes remain effective and sustainable. Actions are taken to maintain the improved system and ensure its long-term robustness, keeping the process under control and achieving the set objectives [16] [14] [15].
Related to figure 1, in the Define phase, key variables from the research question are identified and mapped to those in the conduction equation. The Measure-Analyze phase involves calculating different productivity values by varying variables, studying their influence, and graphically representing their evolution using MATLAB. The Improve-Control phase focuses on prediction and optimization through methods such as Gradient Descent and TRIZ, ultimately leading to an optimal and innovative solution.
3.3 Analogy
The method used to model a specific operation in a clothing production line is to represent it as a wall with thickness e, thermal conductivity λ, and surface area S, through which a heat flux ϕ passes. The idea is to make an abstraction, a simplified representation that allows for a deeper understanding of the inherent aspects of the operation. The analogy between the flow in the production system and the heat flux in thermodynamics relies on the principles of functional similarity and conceptual analogies. Functional similarity or functional analogy is a concept used in engineering and design to find solutions to problems by identifying analogies between different fields. It involves finding similarities in the functions or objectives of systems, even when they are used in different contexts. Conceptual analogy compares abstract concepts or ideas to illustrate a point. The following figure illustrates an analogy between the phenomenon of conduction and a specific production system.
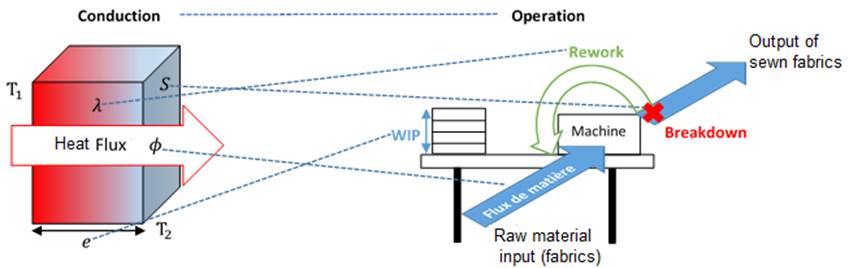
Fig 4. Analogy
To determine the analogical equivalence between the other variables of the two domains, figure number 5 summarizes the key common points.
The equivalence between production system parameters such as productivity, rework, WIP, breakdowns, and those of thermal conduction for example heat flux, thermal conductivity, surface area, thickness, is based on functional analogies. Productivity corresponds to heat flux, representing the efficiency of transfer, while rework is associated with thermal conductivity, reflecting the system's ability to operate without interruptions. WIP relates to thickness, symbolizing storage capacity, and breakdowns to the surface area, which disrupts the flow. Finally, the ordered quantity acts like the temperature difference, triggering the production flow, just as a thermal gradient drives heat transfer. These parallels highlight conceptual similarities, showing how imperfections, accumulations, or interruptions affect process fluidity, whether in production or thermal conduction.
The equivalence between breakdowns in a production system and surface area in thermal conduction relies on strong conceptual logic. In a wall, an abrupt variation in surface area disrupts the normal flow of heat: part of the heat is reflected rather than transferred, creating inefficiency. Similarly, breakdowns in a company disrupt workflow by halting production operations, reducing overall efficiency. Furthermore, the mechanical resistance of a wall, proportional to its surface area, can be compared to the operational resilience of a company facing disruptions. Just as surface roughness in a wall causes temperature discontinuities, irregularities due to equipment failures disrupt production flow. Thus, the surface area in thermal conduction and breakdowns in a production system share functional and conceptual characteristics, illustrating their roles in maintaining stability and efficiency in their respective processes.
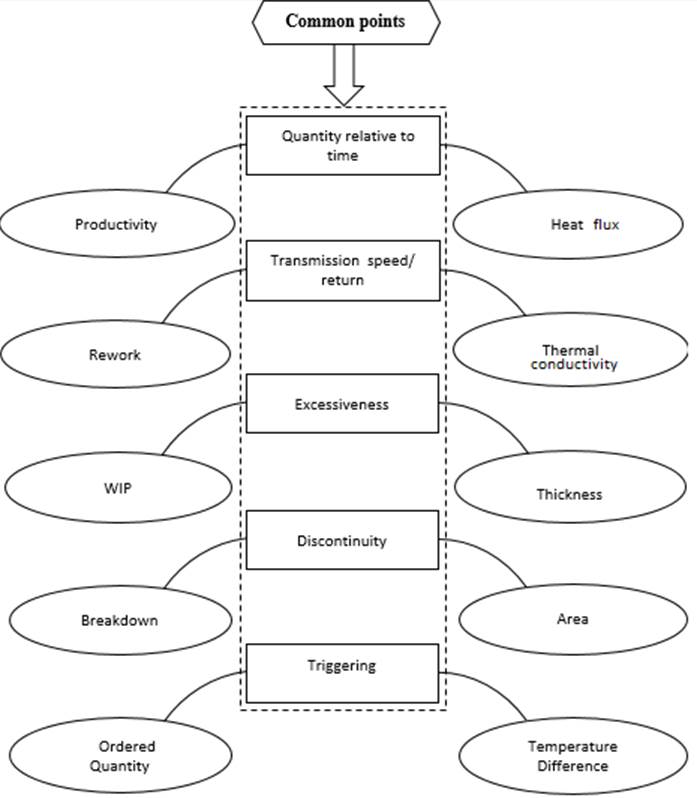
Fig 5. Analogy explanation
3.4 Heat conduction equation through a simple wall
The one-dimensional heat conduction equation will be applied through a wall of thickness ????, thermal conductivity ????, and large transverse dimensions, with no energy generation or storage. Consequently, the incoming flux is equal to the outgoing flux, and there are no heat losses at the edges [18].
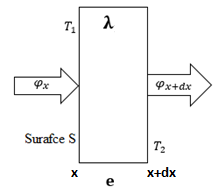
Fig 6. Heat balance through a simple wall
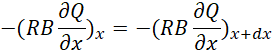
In term of production field,the balance gives:
|
φx=φx+dx |
(1) |
|
-(RB∂Q∂x)x=-(RB∂Q∂x)x+dx R is rework, B is breakdown and Q is quantity. |
(2) |
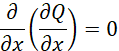
Which then gives:
|
∂∂x∂Q∂x=0 |
(3) |
|
|
∂2Q∂x2=0 By integrating this differential equation, the expression is of the form: |
(4) |
|
|
Qx=Cx+D |
(5) |
|
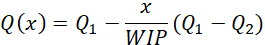
The integration constants C and D are obtained from the application of the boundary conditions. Q(0) = Q1 et Q(e) = Q2. This leads to the following equation : [19]
|
Qx=Q1-xWIP(Q1-Q2) |
(6) |
|
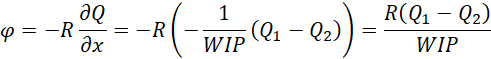
φ=-R∂Q∂x=-R-1WIPQ1-Q2=RQ1-Q2WIP The productivity for one workstation is deduced by: |
(7) |
|
P=Q1-Q2R*WIP*B |
(8) |
The case of a multilayer wall in series
Given the previous equation, the temperature differences for each layer are:
|
The inversions in the final formula reflect the inverse relationship between rework and thermal conductivity, where higher quality (lower rework) improves productivity, and between breakdown and surface area, where larger surfaces reduce failures. By replacing λ with 1/rework and S with 1/breakdown, the model better aligns with real-world conditions, emphasizing how reduced rework and breakdowns enhance system performance. This adjustment yields the final productivity formula : |
||
|
||
|
where K represents order quantity. This was derived by analogical calculation, similar to the total heat flux passing through a multilayer wall composed of n layers in series. Thus, just as heat flow depends on thermal resistance, productivity here depends on rework, WIP, and breakdown, combined in a series structure.
|
3.5 Data Collection
The first step of the simulation involves the meticulous collection of real data from the company Btextile Sarl. The production line under study is detailed in Figure 7, where data collection points are marked with red indicators.
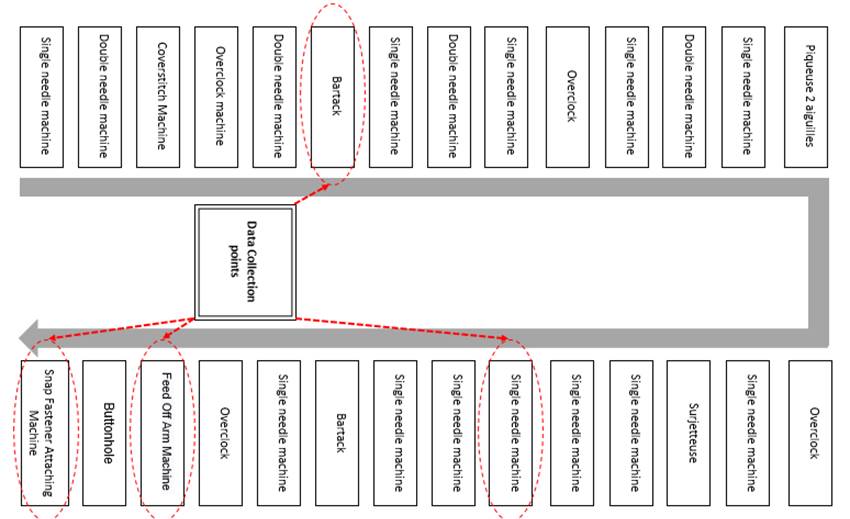
Fig 7. Data collection points
Emphasis was placed on collecting specific data such as rework, WIP, downtime due to breakdowns, and productivity within the garment production line. For all four variables, the collected data is quantitative in nature. At each data collection point, the following information was gathered: the rework rate, representing the percentage of products requiring reprocessing due to manufacturing defects; WIP, indicating the number of products in progress at a given moment; downtime due to breakdowns, measuring the time during which the production line is halted because of mechanical failures or other technical issues; and productivity, defined as the number of finished products per unit of time. Various tools were used for data collection, including a stopwatch to measure the duration of downtimes.
The modelling of the production line is inspired by an analogy with a series of wall layers, where each layer represents a distinct operation in the production process. This structural approach allows for the decomposition of the complex garment manufacturing process into more manageable components, equivalent to the various sequential phases of production.
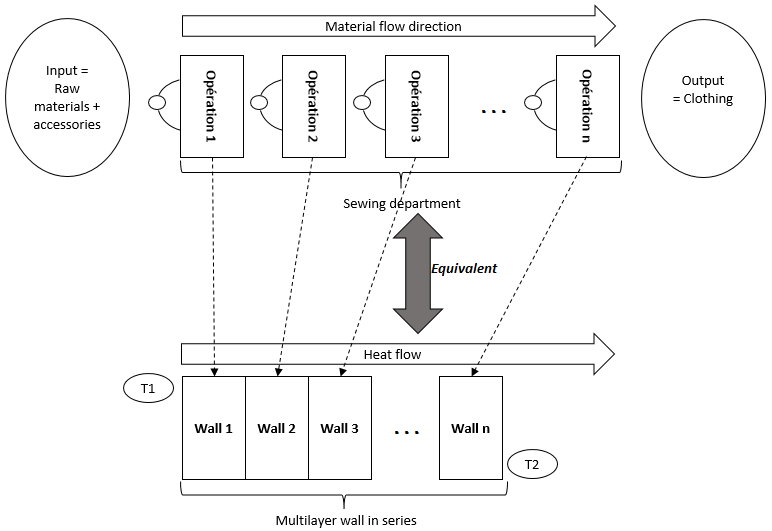
Fig 8. Modeling of the production line
3.6 Gradient Descent Algorithm
Gradient descent is one of the most important optimization strategies used by many machine learning models to find the best parameters that minimize the error between predicted functions and empirical data. This algorithm is widely used in machine learning, neural networks, linear regression, and logistic regression [21]. It is an iterative optimization process used to minimize a cost function by adjusting the model's parameters. The gradient descent method aims to quickly reach a minimum of a function with multiple variables [22]. To maximize a multivariable function using gradient descent, it is sufficient to minimize the negative of the function. Here are the general steps for applying gradient descent to maximize a multivariable function[23]:
1. Initialization: Begin by initializing the parameters with arbitrary or random values.
2. Gradient Calculation: Compute the gradient of the objective function with respect to each parameter. The gradient is characterized by the partial derivatives of the function with respect to each parameter or variable.
|
∇fx1,x2,…,xn=(δfδx1,δfδx2,… , δfδxn) |
(12) |
|
3. Parameter Update: Update the parameters in the direction of the gradient according to the following update rule:
|
X=X+α∇fX avec X= x1,x2,…,xn |
(13) |
4. Repeat steps 2 and 3: repeat the process of computing the gradient and updating the parameters until a stopping criterion is met, such as a maximum number of iterations or the convergence of the objective function to a local or global minimum.
3.7 TRIZ
TRIZ (Theory of Inventive Problem Solving), developed by Russian engineer Genrich Altshuller in the 1940s, is a systematic and innovative method for solving complex problems and stimulating creativity [24]. Based on the analysis of more than 200,000 patents, TRIZ relies on universal principles identified from successful innovations, which are applied across various fields such as engineering, project management, and product design [24]. Four fundamental concepts structure this approach: ideality (seeking an optimal solution with minimal compromises), the law of technical evolution (the systematic progress of systems), contradictions (technical or physical conflicts), and their resolution through 40 inventive principles. TRIZ also provides practical tools such as a contradiction matrix and 39 generic design parameters, facilitating effective resolution of technical conflicts [25].
The TRIZ approach is characterized by a methodical progression in several steps. It begins with formulating the specific problem and identifying contradictions, followed by modelling the problem in a generic framework [26]. This abstraction allows the exploration of universal principles and solutions that can be applied in different contexts. Once identified, the generic solutions are adapted and refined to meet the specific needs of the initial problem through an iterative process. The contradiction matrix, which links the 40 principles with the 39 technical parameters, offers strategic recommendations to overcome the identified conflicts, fostering innovation aimed at efficiency and ideality [27]. This methodology thus provides a structured and creative framework for designing optimal technical solutions.
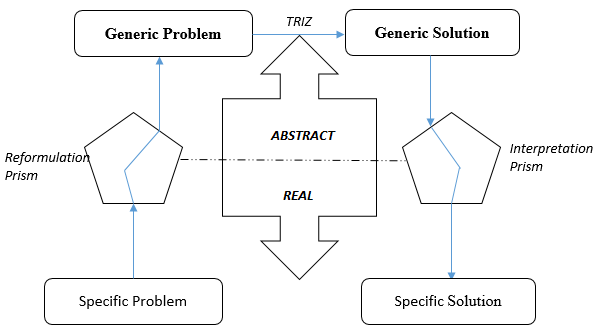
Fig 9. TRIZ methodology
4. Results
4.1 Productivity variation based on Breakdown
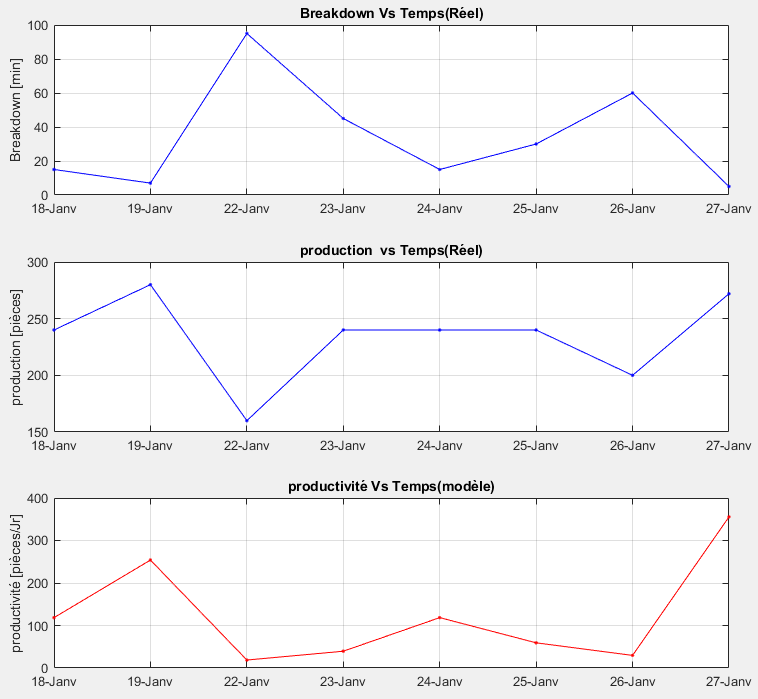
This section deals with productivity fluctuations based on the duration of breakdown incidents. As mentioned earlier, some curves will reflect actual collected data, while others will represent simulation results. The two other variables, namely the rejection rate and WIP level, are kept constant in this analysis, allowing for the isolation of the specific impact of breakdown incident duration on productivity. This graphical approach is implemented to visually demonstrate the influence of breakdown incident duration on productivity in detail. For increased accuracy, graphs will be developed to show the sensitivity of productivity to machine repair time. The approach involves plotting the variation in breakdowns, both with real data and during simulations, and then calculating the productivity levels.
Fig 10. Pant GRDF
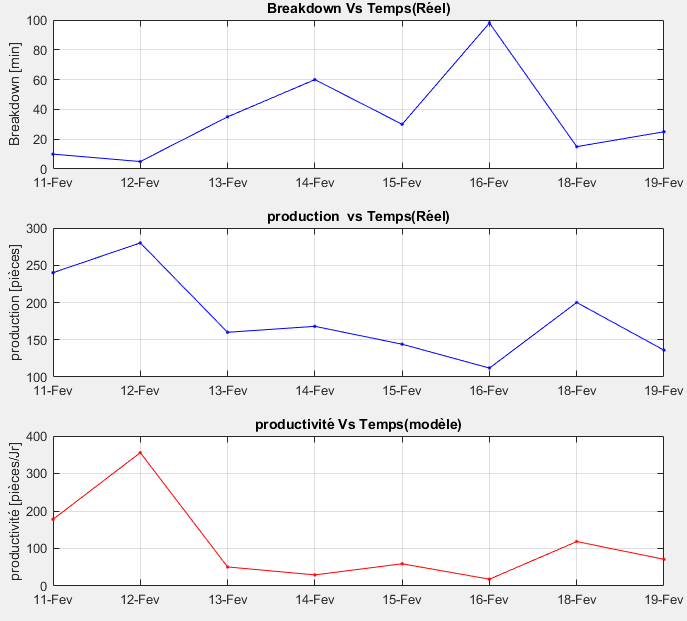
Fig 11. Rex Jacket
4.2 Optimization result using Gradient Descent algorithm
In the context of optimization, the gradient descent algorithm is applied to determine the optimal values of the parameters in order to maximize productivity. This iterative algorithm gradually adjusts the system's parameters based on the gradient of the cost function associated with the production flow. At each iteration, the parameters are updated in the direction of the gradient, allowing convergence toward a global maximum of productivity. The following figures illustrate the evolution of these parameter values for each iteration, providing a visual overview of the optimization process and convergence toward the optimal values.
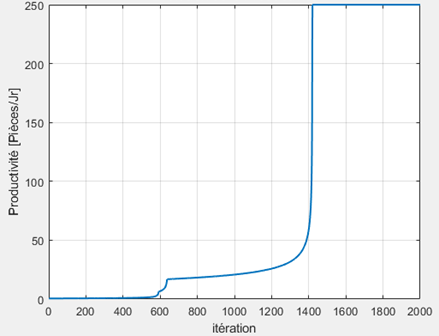
Fig 12. Productivity evolution
The figure 12 shows the evolution of productivity value over the iterations of the gradient descent algorithm. Initially, productivity gradually increases with each iteration as the system's parameters are adjusted to maximize its value. In more detail, at the beginning, productivity is low but progressively increases during the iterations, eventually reaching a peak. This increase is represented by a curve that gradually slopes upward, then takes on a concave shape before becoming vertical, rapidly reaching its peak, after which it remains constant. Despite some local fluctuations, the curve shows an overall upward trend. This marks the increasing efficiency of the optimization algorithm over time. This continuous increase is the result of optimizing the parameters. At a certain point, productivity reaches its maximum possible value, indicating that the model's variables are optimized to their fullest capacity to maximize the objective. At this stage, productivity remains constant because it is no longer possible to increase it further with the current parameters. The stabilization at its maximum value marks the end of the gradient descent algorithm and indicates that convergence toward an optimal solution has been achieved.
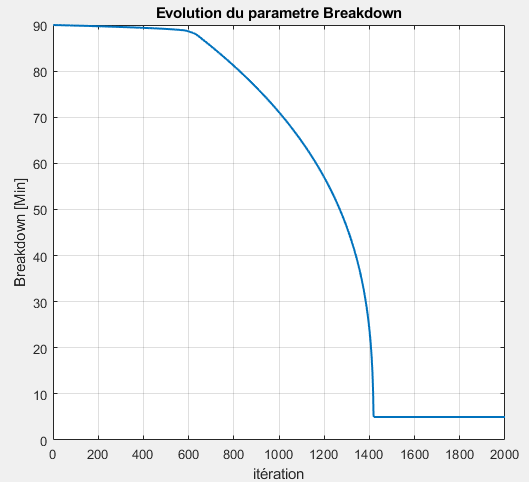
Fig 13. Breakdown evolution
Figure 13 shows the evolution of the breakdown parameter over the iterations. At the beginning of the algorithm, the breakdown parameter is randomly defined between 10 and 190 minutes, in accordance with the actual data from the production line. During the initial phase (iterations 0 to 623), the curve exhibits a slow, almost horizontal descent. Then, phase 2 (iterations 623 to 1419) shows a curvilinear, almost circular descent. Finally, in phase 3, starting from the 1419th iteration, the curve stabilizes at its minimum value, indicating that the parameter has reached an optimum and can no longer be reduced further. Analyzing the evolution of the curve reveals a general downward trend until it stabilizes, confirming that minimizing breakdown is crucial for maximizing productivity. This trajectory highlights the importance of optimizing the breakdown parameter to improve performance, ultimately reaching an optimal equilibrium point where productivity maximization is achieved.
4.3 The solutions provided by TRIZ
4.3.1 Formulation of technical contradictions
To optimize productivity, which is analogous to thermal flux in this context, it is important to maximize both thermal conductivity and the transfer surface while simultaneously minimizing the material thickness. However, these actions generate technical contradictions. By adjusting these variables to optimize them, compromises in other aspects may occur, which is undesirable. These compromises can be visualized in the following table before being integrated into the Altshuller matrix for further analysis. This matrix allows for exploring different contradiction resolution principles to find solutions that optimize multiple parameters simultaneously while minimizing compromises.
If the goal is to maximize the surface area of an object, compromises may arise, particularly concerning weight and volume among the 39 TRIZ parameters. Firstly, increasing the surface area may lead to an increase in the object's total weight, especially if it requires the use of additional materials to create the extended surface. Secondly, this increase in weight can pose challenges in applications where mobility or handling of the object is critical. Similarly, expanding the surface area can result in an increase in the object's overall volume. This can be problematic in environments where space is limited or when size restrictions are imposed. These compromises highlight the importance of finding a balance between optimizing surface area and minimizing the impacts on weight and volume, in order to meet the specific needs of the application while ensuring an efficient and functional design.
4.3.2 The solution directions according to TRIZ
Once the parameters associated with the specific aspects of the problem are identified, they are used to search for solutions within Altshuller’ s solution matrix. This matrix contains inventive principles and solutions derived from the analysis of numerous patents and problems. By associating the identified parameters with the corresponding principles in the matrix, one can discover ideal solution directions to address the specific problem. The variables to be improved are placed on the vertical axis of the table, while the variables that degrade are arranged horizontally. The proposed solutions are found at the intersection of these variables and are presented as principles, among the 40 available in the matrix. Finally, the last step of the process involves returning to the real domain, meaning interpreting the solutions so that they are practically applicable. This step involves carefully examining the proposed solutions from the solution matrix base.
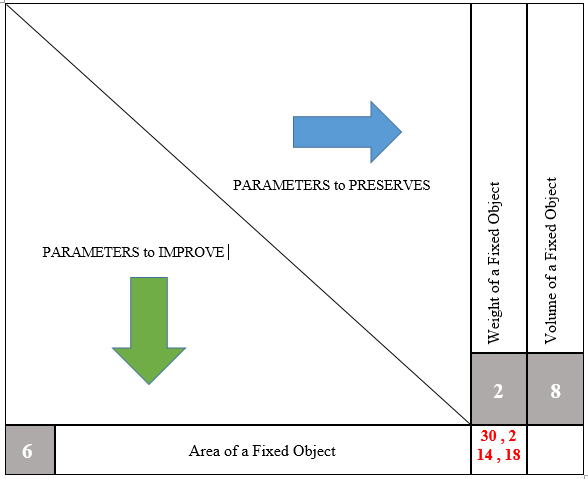
Fig 14. Solutions to reduce breakdowns by TRIZ
Principle No. 18 of the TRIZ method, which deals with vibrations or oscillations, can be interpreted as follows in the context of breakdowns or failures in industrial production: Early Detection of Failures: Abnormal vibrations or oscillations in industrial machines can often be early signs of imminent failures. By regularly monitoring the vibration levels of equipment, potential issues can be identified before they develop into major breakdowns. This allows for planned preventive maintenance interventions to avoid costly production interruptions. Vibration-Based Preventive Maintenance: By using vibrations as an indicator of the machine's health status, maintenance teams can implement preventive maintenance programs based on predefined vibration thresholds. This involves regular inspections of the equipment and making adjustments or repairs as soon as abnormal vibrations are detected. Continuous Monitoring: Installing vibration sensors on machines allows for continuous monitoring of their operational state. The collected data can be analyzed in real-time or periodically to detect trends and significant changes, facilitating decision-making for maintenance and repair planning.
The integration of periodic maintenance is an essential component for effectively applying TRIZ Principle No. 18 in managing breakdowns in industrial production. The following method can be incorporated: plan regular maintenance, that is, establish a periodic maintenance schedule for all critical machines and equipment in the factory. These regularly scheduled maintenance tasks allow for the detection and prevention of potential issues before they turn into major failures. The integration of Digital Twins and the Internet of Things further enhances this approach. Digital Twins provide a virtual replica of physical machines, allowing for in-depth analysis and real-time performance simulation. Combined with IoT, these technologies enable continuous data collection from vibration sensors and other critical parameters. The data can be analyzed by advanced algorithms to predict failures, thus optimizing maintenance interventions. This integration not only improves the accuracy of early failure detection but also allows for proactive maintenance planning, ensuring maximum operational efficiency and reducing unexpected downtime.
Integrating periodic training or employee refresher courses in maintenance, in relation to TRIZ Principle No. 18 on vibrations, significantly improves responsiveness and troubleshooting skills. By raising awareness among workers about the importance of vibrations as an indicator of the health status of equipment, these sessions aim to strengthen their ability to detect potential issues early. Through practical exercises and breakdown scenario simulations, workers are able to apply their knowledge and refine their diagnostic and problem-solving skills. Furthermore, regularly updating knowledge on the latest technologies and best maintenance practices ensures that staff have the most current tools and skills to effectively manage breakdowns. This helps minimize unplanned downtime, increase productivity, and ensure equipment reliability.
Principle No. 2, which concerns extraction-separation, can be applied in the sewing industry to minimize breakdowns by quickly identifying and isolating defective components or sources of dysfunction in production processes. For example, if a sewing machine shows signs of failure, operators can use this principle to isolate the problematic component and replace or repair it without disrupting the rest of the production line. The application of the extraction-separation principle also allows for quickly removing a malfunctioning machine from the production line and replacing it with one in good working condition. By having spare machines on hand, operators can make this switch without interrupting the production process, thus minimizing downtime and disruptions. While the defective machine is removed for repair, operators can work calmly on its maintenance, without the pressure to quickly resume production. This approach ensures continuity of operations while ensuring that machines remain operational and efficient.
Furthermore, by using extraction-separation techniques to analyze the root causes of breakdowns, companies can implement preventive solutions to avoid future occurrences. For instance, if a specific type of thread is frequently associated with breakdowns, companies may choose to separate it from other threads in the storage or supply process, thereby reducing the risks of cross-contamination or dysfunction. TRIZ's extraction-separation principle can be applied to minimize breakdowns by implementing preventive and proactive maintenance techniques. By using this principle, companies can plan scheduled downtimes to extract critical components from machines and inspect them thoroughly for signs of potential failure. These regular inspections help identify emerging issues before they become major breakdowns, enabling quick interventions to perform necessary repairs. Moreover, by following this principle, companies can also establish preventive replacement programs for worn or aging parts, ensuring that essential components remain in good working condition. By integrating these proactive maintenance techniques based on the extraction-separation principle, companies can significantly reduce the risks of unexpected breakdowns, ensuring a more stable and reliable production process.
Principle No. 14, "Sphericity": In the context of sewing machines, the application of TRIZ's Sphericity principle involves paying particular attention to the design and quality of mechanical components. For example, a bent needle or a needle tip with burrs could lead to unexpected production interruptions. Similarly, rounded hook tips could also cause long-term malfunctions. Therefore, by applying the principle of sphericity, sewing machine manufacturers should strive to produce mechanical components with more regular shapes and smooth surfaces, thus reducing the risk of defects and breakdowns. By adopting a proactive approach to ensuring the quality and integrity of mechanical components, they can improve the overall performance of their machines and reduce production interruptions caused by breakdowns.
On the other hand, in the context of reducing breakdowns, the analogy with the circular or revolving aspect of the sphericity principle in TRIZ can be interpreted as follows: by adopting a cyclical approach to preventive maintenance rather than only reacting to breakdowns when they occur, companies can implement a regular maintenance program based on periodic cycles. This process involves regularly inspecting machines, performing minor adjustments and repairs, and replacing worn parts before they cause major breakdowns. By following this continuous cycle of preventive maintenance, companies can prevent potential failures, extend the lifespan of equipment, and minimize production interruptions due to breakdowns.
Principle No. 30 "Flexible Membrane and Thin Walls": First, this can mean adopting a flexible approach in planning and executing maintenance, taking into account the specific needs of each piece of equipment and adjusting strategies based on evolving conditions and requirements. Secondly, it may involve maintaining an agile and adaptable organizational structure capable of quickly adjusting to unforeseen changes and challenges. Finally, this could also translate into implementing preventive maintenance management systems based on flexible and scalable performance indicators, enabling proactive monitoring of equipment conditions and swift intervention when necessary. By integrating these principles of flexibility and adaptability into maintenance management, companies can enhance their ability to anticipate and respond to potential issues, thus reducing downtime and optimizing the overall performance of their operations.
Adopting a flexible approach in maintenance planning and execution means designing maintenance programs that can be adapted to the changing needs of the equipment. This involves not being limited to fixed schedules but instead establishing preventive maintenance triggers based on real-time monitoring of machine performance. For example, rather than following a standard preventive maintenance schedule, maintenance teams could actively monitor key performance indicators of the equipment, such as vibration levels, temperature, or energy consumption, and trigger maintenance when these indicators show signs of deterioration. This allows for proactive and targeted interventions, reducing the risk of unexpected breakdowns and unplanned downtime.
Furthermore, a flexible approach to maintenance also involves the ability to quickly adjust maintenance plans based on operational priorities, production constraints, and available resources. This may include reallocating maintenance resources in real time to address the most urgent needs or adjusting maintenance schedules to minimize production interruptions. This can be achieved by developing algorithms and real-time monitoring software that continuously analyze machine performance and trigger maintenance when anomalies are detected.
5. Discussions
The main finding highlights that reducing breakdowns leads to improved productivity, a conclusion that aligns with other studies. Indeed, when machines break down, it disrupts the entire production system, which can directly result in a decrease in production volume per unit of time. These production interruptions have a significant impact on operational efficiency. Further studies could strengthen this observation by emphasizing the importance of maintaining smooth equipment operation to ensure optimal production.
This study, titled "Improvement of Productivity in the Circular Knitting Area, using Lean Methodologies in SMEs of the Textile Sector" by Jean Piero Primo-Valdiviezo and Pedro Ramos-Luque, highlights the positive impact of applying Lean methodologies on operational efficiency in SMEs within the textile sector. The results obtained show a significant improvement in machine performance, productivity, and OEE (Overall Equipment Effectiveness) after the implementation of Lean tools. Specifically, machine availability, performance, and productivity increased notably, from 62.5% to 84.17%, from 57.69% to 80.77%, and from 66.11% to 84.17%, respectively. These results further reinforce the conclusion of our study, highlighting that reducing breakdowns increases productivity while improving equipment availability. The successful application of Lean tools, such as 5S and SMED, in this study confirms the effectiveness of these approaches in reducing non-productive time and improving the overall performance of textile sector businesses.
The study titled "Productivity Improvement by Reducing Waiting Time and Over Production Using Lean Manufacturing Technique" conducted by Ramasubramaniam P, strengthens and emphasizes the importance of reducing waiting times, including non-productive times such as production stoppages, to improve productivity. The results of this study show that after implementing techniques to reduce waiting times, the production rate increased, and the productivity loss rate was significantly reduced, from 18.5% to 13.88%. Additionally, the study reports a reduction in overproduction percentage from 6% to 3% for the same product reference. These results confirm and highlight that minimizing non-productive time, including production stoppages, leads to measurable improvements in productivity in the manufacturing sector. In alignment with the conclusions of our study, this research demonstrates that reducing waiting times, particularly production stoppages, is an effective strategy for optimizing operations and increasing productivity in companies using Lean manufacturing techniques.
The study titled "An Investigation on Downtime Minimization Techniques for Sri Lankan Textile & Apparel Industry" conducted by Nisayini K and Mr. Deegahawathura also confirms the findings of the present study. The objective of this research was to determine downtime minimization techniques, enabling the organization to improve productivity by leveraging both human and technical factors at work. The study identified several critical factors leading to downtime, including staff absenteeism, machine breakdowns, and style changes. Using both quantitative and qualitative data obtained through questionnaires and interviews, the researchers thoroughly analyzed the issues related to downtime. The results demonstrated a negative relationship between downtime and productivity, emphasizing the importance of controlling downtime to avoid production bottlenecks. In summary, this study supports the idea that minimizing breakdowns is essential for improving productivity in the textile and apparel industry.
The study titled "Reducing machine breakdown time using DMAIC approach in a garment industry" conducted by Muhammad Mustafa Ibrahim confirms the importance of reducing machine downtime in the garment industry, as it directly impacts production hours, customer orders, and financial losses. The DMAIC approach is presented as an effective method for reducing downtime and improving operational efficiency in this industry. The study highlights the importance of scheduled, corrective, and preventive maintenance to detect and resolve issues before they cause breakdowns. It proposes effective tactics such as preventive maintenance, as well as data-driven approaches using machine learning algorithms and real-time monitoring. A case study is also presented, demonstrating how the DMAIC methodology was used in the real textile industry to significantly minimize machine downtime. The conclusion underscores that the garment industry can benefit significantly from reducing machine downtime by adopting the DMAIC approach and implementing the suggested techniques, resulting in increased production, faster order fulfillment, and reduced financial losses. Thus, the results and conclusions of this study align perfectly with those of the present thesis, emphasizing that reducing machine downtime leads to an increase in productivity in the textile and apparel industry.
The study "Optimization of machine downtime in the plastic manufacturing" conducted by S.C. Nwanya et al. highlights the positive impact of reducing machine downtime on productivity in the plastic manufacturing sector. Using an optimization model, machine availability was maximized, leading to reduced downtime. The results showed a significant increase in production rates for different product categories after optimization. This study also emphasizes that higher frequencies of downtime can lead to a significant reduction in productivity, which confirms the findings of the present study. Although the present thesis and this research focus on different industries, the results converge toward a common conclusion. Reducing machine downtime leads to an increase in productivity, a conclusion that appears to be valid across various industrial sectors. This consistency strengthens the robustness of this conclusion and suggests its general applicability, regardless of the specific industry context.
6. Conclusions
In conclusion, the textile industry plays a crucial role in the global economy, particularly in Madagascar, where it is considered a strategic sector. Despite its dynamism, it faces complex challenges related to production lead time reduction and increased competitiveness. Optimizing productivity and the reliability of systems, particularly machines, appears to be key levers for ensuring the sustainability of businesses. Approaches such as Lean Manufacturing and TRIZ principles offer innovative solutions, particularly through the implementation of preventive maintenance programs, continuous monitoring via sensors, and the use of digital tools such as digital twins and the Internet of Things. These methods not only help prevent breakdowns but also reduce downtime through flexible strategies and agile management of equipment.
However, the proposed solutions have limitations that need to be highlighted. The study focuses on a specific production line and a given period, which limits the scope of the conclusions. Additionally, it does not integrate all factors that may influence system reliability, requiring a more comprehensive approach. Finally, the analogy made between textile production lines and phenomena like thermal conduction, while instructive, is not fully applicable at all levels. Further research, integrating a holistic vision and diverse data, is needed to thoroughly address the structural and operational challenges of the textile industry.
Funding
This research did not receive any specific grant from funding agencies in the public, commercial, or not-for-profit sectors.


Open Access By Aditum Open Access Journals id licensed under Creative Commons Attribution 4.0 International License. Based On a Work at aditum.org