International Journal of Business Research and Management
OPEN ACCESS | Volume 4 - Issue 3 - 2026
ISSN No: 3065-6753 | Journal DOI: 10.61148/3065-6753/IJBRM


EYONG AKO 1, NGWANG NJESHI PECULIAR2
1The University of Bamenda, Northwest Region, Cameroon, School: Higher Institute of Commerce and Management, Department: Organisational Sciences.
2The University of Bamenda, Northwest Region, Cameroon School: Higher Institute of Commerce and Management, Department: Organisational Sciences.
*Corresponding author: EYONG AKO, The University of Bamenda, Northwest Region, Cameroon, School: Higher Institute of Commerce and Management, Department: Organisational Sciences.
Received: April 07, 2025
Accepted: April 14, 2025
Published: April 22, 2025
Citation: EYONG AKO, NGWANG N PECULIAR, (2025). ‘Procurement Management Pracces as A Strategic Tool for Project Performance: The Case of Construction Companies in the Northwest Region Cameroon”. International Journal of Business Research and Management 2(4); DOI: 10.61148/3065-6753/IJBRM/040
Copyright: © 2025. EYONG AKO, This is an open access article distributed under the Creative Commons Attribution License, which permits unrestricted use, distribution, and reproduction in any medium, provided the original work is properly cited.
The main objective of this study was to examine the effect of procurement management practices on project performance of construction companies in Bamenda. Firstly, a comprehensive literature review was conducted to establish the theoretical foundation and identify the critical factors associated with procurement management and project performance. The methodology used was designed as quantitative approach since the data was gathered through questionnaires. Also, the study made use of the experimental research design and the target population for this study constituted of project managers and employees working in construction companies within Bamenda A sample size of 106 respondents was selected, and data analysis was performed using statistical package for social sciences version 20. The study employed the linear regression technique to establish the relationship between variables. The findings of the study indicated that need assessment, supplier sourcing and procurement negotiation has a positively significant effect on project performance in the construction industry. The study concluded that application of the procurement practices in the organization is founded on proper need assessment, supplier sourcing and procurement negotiation. Therefore, the study recommended that the key procurement actors should come up with viable ways of managing the procurement process and revitalization of the entire procurement process should be a requirement as it can help in ensuring that organizations embrace modern technological ways and trends in handling and addressing procurement issues.
Introduction
In recent years, procurement practices have been a critical process in project management that includes acquiring goods and services required for project execution. It encompasses identifying project requirements, selecting vendors, negotiating contracts, managing vendor relationships, and monitoring vendor performance throughout the project lifecycle (Project Management Institute [PMI], 2017).
The success of projects heavily relies on the effectiveness of procurement practices and if there exist proper procurement practices, then project performance can definitely be realized. Many procurement activities suffer from neglect, lack of proper direction, poor co-ordination, bureaucracy, lack of open competition and transparency, differing levels of corruption and not having a trained and qualified procurement specialists who are competent to conduct and manage the procurement process in a professional, timely and cost-effective manner. Week project procurement in construction projects results from insufficient planning, shortage of funds, and timely inaccurateness of large procurement, (Karlsson, 2012).
Therefore, one of the major problem of procurement management is being able to identify potential vendors, evaluating their capabilities, and select the most appropriate ones based on factors such as price, quality, and delivery timeframes which is a major problem for most organizations because it requires a thorough understanding of the project requirements and the vendor market, as well as strong negotiation and communication skills. To overcome this challenge, organizations sometimes establish clear compliance standards and regularly monitor supplier performance to ensure that they are meeting these standards.
Apart from vendor selection, other problems associated with procurement involves managing risk and ensuring proper communication throughout the procurement process. Effective communication and collaboration between project stakeholders and suppliers are crucial for smooth procurement. Challenges can arise due to language barriers, cultural differences, coordination issues, and inadequate information sharing, leading to misunderstandings and delays.
Effective SRM contributes to better supplier performance, reduced risks, and enhanced project outcomes. Recent disruptions, such as the COVID-19 pandemic and supply chain vulnerabilities, have highlighted the importance of risk mitigation and resilience in procurement. Organizations are placing greater emphasis on identifying and managing risks in the supply chain, diversifying suppliers, and implementing contingency plans. The ability to mitigate risks effectively contributes to improved project performance by minimizing disruptions and ensuring continuity of supplies.
Despite these positive trends, challenges persist in procurement management. These include managing supply chain disruptions, addressing geopolitical uncertainties, navigating regulatory complexities, adapting to emerging technologies, and attracting and retaining procurement talent. Organizations need to continue investing in developing procurement capabilities, fostering collaboration, and staying agile in response to changing market dynamics to optimize project performance. Therefore, in this study the researcher seeks to examine the effect of procurement management on project performance using the case of construction companies in Bamenda. By identifying the factors that contribute to poor procurement management practices and how organizations can better implement best procurement practices to ensure the overall success of projects, the study seek to answer the following questions.
Theoretical Literature
The agency theory is a widely discussed concept in the field of economics and organizational behaviour. One of the prominent early contributors to the agency theory is Michael C. Jensen and William H. Meckling. They published a seminal paper titled "Theory of the Firm: Managerial Behaviour, Agency Costs and Ownership Structure" in 1976. Agency theory is concerned with resolving problems that can exist in agency relationships; that is, between principal (such as shareholders) and agents of the principal (for example, company executive and project managers). The two problems that agency theory addresses: the problems that arise when the desires or goals of the principal and agent are in conflict, and the principal is unable to verify what the agent is actually doing and the problems that arise when the principal and agent have different attitudes towards procurement.
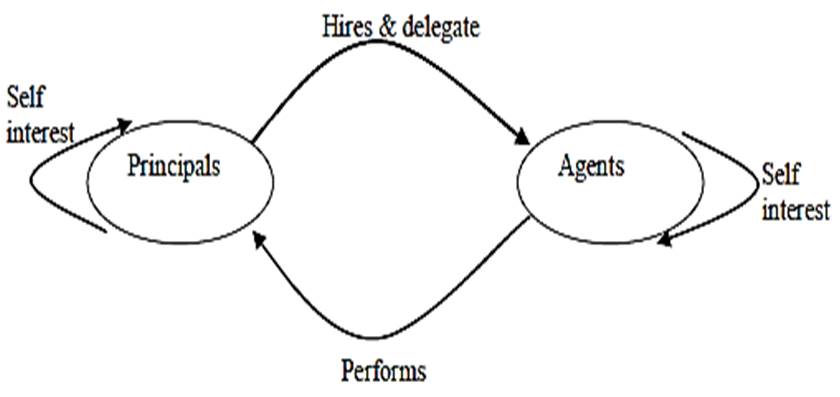
Figure 2.3: The Agency Theory Framework
Source: Tyari (2023)
This theory is relevant to this study because the agency theory provides a framework for understanding and addressing the challenges and opportunities in the principal-agent relationship within procurement management. By applying the theory's principles, procurement managers can enhance alignment, reduce agency costs, and improve project performance.
The stakeholder theory was developed by, R. Edward Freema 1984.The success of a firm is a complete function of successful management of the various relationships that a firm has with stakeholders considering that less can be achieved without Stakeholders, and the organization would cease to exist is that which is enriched in stakeholders’ Theory.
From a project management perspective, stakeholder theory means considering the needs of all parties with a vested interest in a particular project. According to the Project Management Institute, stakeholders are “individuals and organizations who are actively involved in the project, or whose interests may be positively or negatively affected as a result of project execution or successful project completion.”
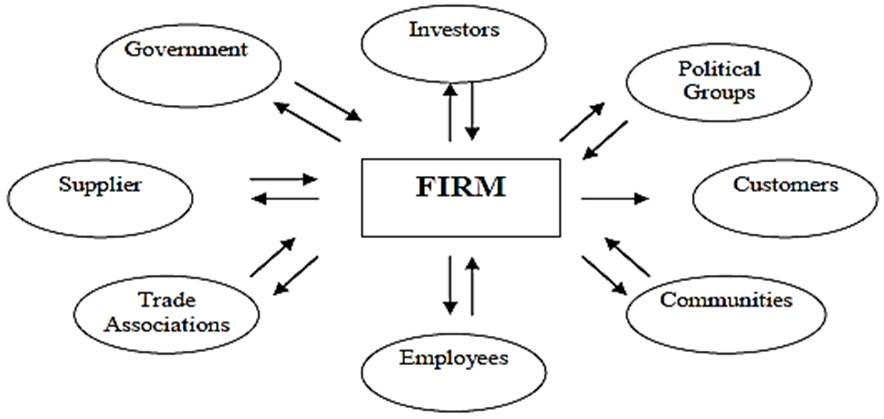
Figure 2.5: The Stakeholder Theory Framework
Source: Tyari (2023)
This theory is important to this study in that, the stakeholder theory focuses on the recognition and management of the various stakeholders who have a vested interest in an organization or project. In procurement management, stakeholders can include internal groups, such as project teams and departments, as well as external entities like suppliers, customers, communities, and regulatory bodies.
The transaction cost theory was developed by economist Oliver E. Williamson in the 1970s. The transaction cost theory, originally proposed by economist Oliver Williamson, seeks to explain the choice of governance structures in economic transactions based on the costs involved in conducting those transactions. It suggests that organizations aim to minimize transaction costs when deciding how to organize their economic exchanges.
In summary, the transaction cost theory provides a framework for understanding the costs involved in economic transactions and how organizations can minimize those costs. In the context of procurement management, the theory helps in making make-or-buy decisions, selecting suppliers, designing contracts, choosing governance mechanisms, mitigating opportunistic behaviour, and fostering long-term relationships. By considering transaction costs, procurement managers can optimize procurement decisions and practices, ultimately leading to improved project performance.
The transmission mechanism refers to the summary of theories which aims at showing how the theories are applicable to the various variables used.
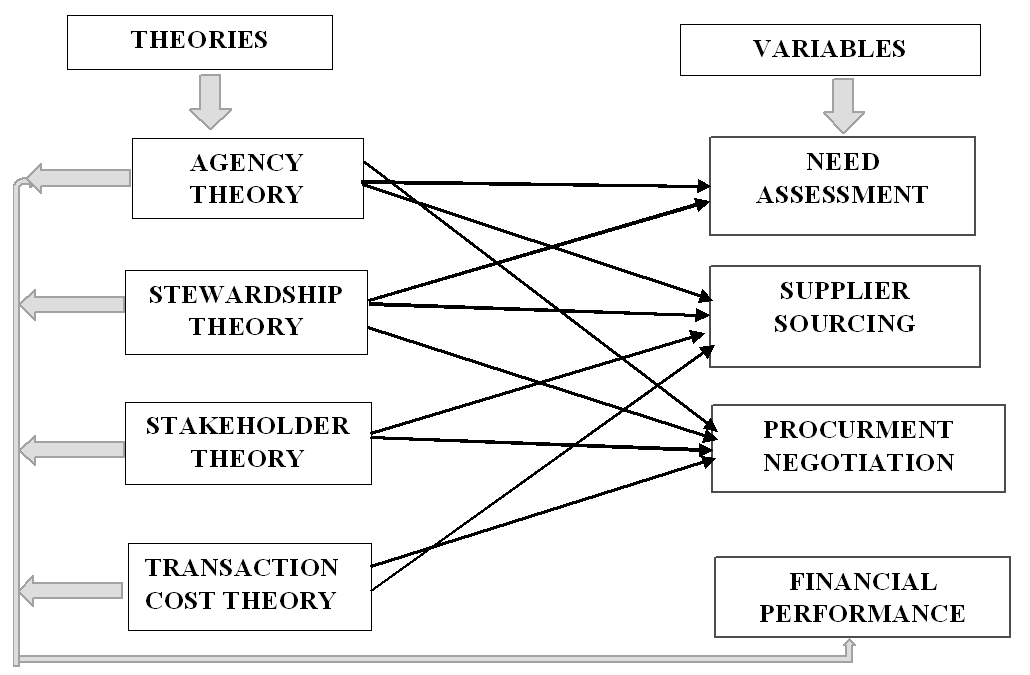
Figure 2.6: The Transmission Mechanism
Source: Author (2024)
Despite the extensive review there are still gaps in the contextual views as we have little or no research directly dealing with construction sector in Bamenda as whereas thematic gaps on procurement management and its effect on project performance. Therefore, the researcher intends to bridge the existing gaps by conducting this research.
The approach which was followed by the researcher in this study is the quantitative approach since the data was gathered through questionnaires. In the model specification, the researcher presented the structure of the relationship that was to be studied by the researcher.
PPCCB = f (NA, SS, PN) ……………………………………………………….….(3.1)
This model is expressed as
PPCCB = β0 + β1NA+ β2SS + β2PN + β3PP+ β4IM µ……………………………..…….(3.2)
Where:
β0 is the intercept
β1to β2 are the coefficients to be determined,
µ represent the error term.
PPCCB represents project performance of Construction Companies in Bamenda
NA represents need assessment
SS represents supplier sourcing
NP represents procurement negotiation
PP represents procurement planning
IM represents inventory management
The study targeted senior project managers and employees thus a sample population of 106 respondents. To determine the sample size, the researcher used Yemane’s statistical instrument formula. A research with a high population size needs to use a formula with conventional confidence level of 95% to ensure more accurate results and a margin error of 5%.
n = N/1+ (e) 2 where N= population size
145/1+145(0.05)2 n= sample size
e= level of procession
N= 106
Presentation And Discursion Of Findings
Distribution of Respondents by Gender
The results indicate that (63.2%) of the respondents were male. On the other hand, (36.8 %) of the employees were female.
Table 4.1: Distribution of Respondent by Gender
|
|
Frequency |
Percent |
|
|
Valid |
Female |
39 |
36.8 |
|
Male |
67 |
63.2 |
|
|
Total |
106 |
100.0 |
|
Source: Author (2024)
Distribution of Respondents by Age
The results provided that (42.5%) of the respondents were within the age bracket of 25-34 years. On the other hand about (36.8%) of the respondents were within the age bracket of 35-44 years in addition to the result of (9.4%) of the respondents were within in the age bracket of 45-50 years. The other results of respondents’ showed (0.9%) of them were aged above 51 years. Lastly only (10.4%) of respondents were below 25 years. This indicates that the workers of the construction companies who participated in this research were adults.
Table 4.2: Distribution of Respondents by Age
|
Age Bracket in Years |
Frequency |
Percent |
|
|
Valid |
25-34 |
45 |
42.5 |
|
35-44 |
39 |
36.8 |
|
|
45-50 |
10 |
9.4 |
|
|
Above 51 |
1 |
.9
|
|
|
below 25 |
11 |
10.4
|
|
|
Total |
106 |
100.0
|
|
Source: Author (2024)
Distribution of Respondents by Education Level
The results of education level showed in Table 4.3 indicate that (60.4%) of the respondents had undergraduate degrees, ( 28.3%) of the employees had attained Masters Level, and (2.8%) had PhD. Lastly about (8.5%)of the employees owned the secondary certificate education level. Nevertheless there was no one with certificate as their highest level of education. These findings show that the employees who work at the construction companies had prerequisite education level which enabled them to fit well at their respective positions.
Table 4.3: Distribution of Respondents by level of education
|
|
Frequency |
Percent |
|
|
Valid |
Degree |
64 |
60.4 |
|
Masters level |
30 |
28.3 |
|
|
PHD |
3 |
2.8 |
|
|
Secondary Certificate |
9 |
8.5 |
|
|
Total |
106 |
100.0 |
|
Source: Author (2024)
Distribution of Respondents by Work Experience
Table 4.4 gives the distribution on duration of work. The findings indicate that (45.3%) of the respondents had worked for period of between 2-5 years, (28.3%) percent had served at their respective work place for a period of between 6-10 years. (2.8 %) of respondents had worked for above 10 years and lastly (23.6%) of the respondents had worked for below 2 years. These findings indicate that the employees under investigation have worked at the construction companies long enough to comprehend the operations of the purchasing process
Table 4.4: Distribution of Respondents by Work Experience
|
Duration of Work |
Frequency |
Percent |
|
|
Valid |
2-5 years |
48 |
45.3 |
|
6-10 years |
30 |
28.3 |
|
|
Less than two years |
25 |
23.6 |
|
|
More than 10 years |
3 |
2.8 |
|
|
Total |
106 |
100.0 |
|
Source: Author (2024)
Adoption of Procurement Practices
This section sought to investigate the extent at which construction companies have adopted procurement practices. The practices under study were Need Procurement Practices, Supplier Sourcing in procurement practices and Procurement Negotiation. The analysis of this section was done based on Rensis likert scale, (1932) the mean score value of 1 – 5 where; Mean = 1 represented very low extent, Mean = 2 is for low extent, Mean = 3 represented moderate extent, Mean = 4 represented great extent and Mean = 5 represented very great extent. Rensis suggest that the determination of the overall mean score value less than (2.5) considered as low extent While, overall mean score value between (2.5- 3.5) considered as moderate extent and the overall mean score value greater than(3.5) considered as great extent.
Need Assessment and Project Performance
Table 4.5 gives the distribution of how need assessment is conducted in the organization. The findings indicate that (55.7%) of the respondents conduct need assessment frequently, (39.6%) conduct need assessment occasionally, (.9%) of respondents rarely carry out need assessment and lastly (3.8%) of the respondents conduct need assessment very frequently. These findings indicate that the employees under investigation have conducted need assessment at the construction companies long enough to comprehend the operations of the purchasing process.
Table 4.5: How often do you conduct a need assessment for your projects?
|
|
Frequency |
Percent |
|
|
Valid |
Frequently |
59 |
55.7 |
|
Occasionally |
42 |
39.6 |
|
|
Rarely |
1 |
.9 |
|
|
Very frequently |
4 |
3.8 |
|
|
Total |
106 |
100.0 |
|
Source: Author (2024)
Table 4.6 gives the distribution of key stakeholders involved in need assessment in the organization. The findings indicate that (8.5%) of the respondents mentioned that need assessment is conducted specifically with clients/customers, (8.5%) of the respondents stated that need assessment involves both clients/customers and end-users, (13.2%) of the respondents mentioned that need assessment is conducted with project team members, (1.9%) of the respondents stated that need assessment includes project team members, clients/customers, and end-users, (1.9%) of the respondents mentioned that need assessment involves project team members, clients/customers, end-users, and subject matter experts, while majority of the respondents (39.6%) reported that need assessment includes project team members, clients/customers, end-users, subject matter experts, and senior management. Also (6.6%) respondents reported that need assessment includes senior managers, (10.4%) respondents reported that need assessment includes subject matter experts. This indicates a comprehensive approach to need assessment involving multiple stakeholders. This study contributes to the existing literature and knowledge base, providing evidence-based insights, best practices, and guidelines for effective interventions and improved outcomes.
Table 4.6: Who are the key stakeholders involved in the need assessment process for your projects? (Select all that apply)
|
|
Frequency |
Percent |
|
|
|
Clients/Customers |
9 |
8.5 |
|
Clients/Customers, End-users |
2 |
1.9 |
|
|
End-users |
9 |
8.5 |
|
|
End-users, Senior management |
1 |
.9 |
|
|
Project team members |
14 |
13.2 |
|
|
Project team members, Clients/Customers |
1 |
.9 |
|
|
Project team members, Clients/Customers, End-users |
2 |
1.9 |
|
|
Project team members, Clients/Customers, End-users, Subject matter experts |
2 |
1.9 |
|
|
Project team members, Clients/Customers, End-users, Subject matter experts, Senior management |
42 |
39.6 |
|
(Table 4.6: Continued)
|
|
Project team members, Clients/Customers, End-users, Subject matter experts, Senior management, |
1 |
.9 |
|
Project team members, Clients/Customers, Senior management |
2 |
1.9 |
|
|
Project team members, Clients/Customers, Subject matter experts, Senior management |
1 |
.9 |
|
|
Project team members, Subject matter experts, Senior management |
1 |
.9 |
|
|
Project team members, Subject matter experts, Senior management, |
1 |
.9 |
|
|
Senior management |
7 |
6.6 |
|
|
Subject matter experts |
11 |
10.4 |
|
|
Total |
106 |
100.0 |
Source: Author (2024)
Table 4.6 presents the distribution of respondents' ratings on the effectiveness of need assessment in identifying project requirements. The findings indicated that (1.9%) of the respondents rated need assessment as extremely effective in identifying project requirements, (0.9%) of the respondents rated need assessment as ineffective in identifying project requirements, (3.8%) of the respondents rated need assessment as somewhat effective in identifying project requirements, (14.2%) of the respondents rated need assessment as moderately effective in identifying project requirements, and lastly the majority of respondents (79.2%) rated need assessment as highly effective in identifying project requirements. This indicates that a significant portion of participants believed that need assessment process was successful in accurately identifying project requirements.
Table 4.7: How would you rate the effectiveness of need assessment in identifying project requirements?
|
|
Frequency |
Percent |
|
|
Valid |
Extremely effective |
2 |
1.9 |
|
Highly effective |
84 |
79.2 |
|
|
Ineffective |
1 |
.9 |
|
|
Moderately effective |
15 |
14.2 |
|
|
Somewhat effective |
4 |
3.8 |
|
|
Total |
106 |
100.0 |
|
Source: Author (2024)
Table 4.7 provides the distribution of respondents' experiences regarding how conducting a thorough need assessment impacts project performance. The findings indicated that (5.7%) of the respondents reported that conducting a thorough need assessment has an extremely positive impact on project performance, (21.7%) of the respondents indicated that conducting a thorough need assessment moderately improves project performance, (9.4%) of the respondents stated that conducting a thorough need assessment does not have a significant impact on project performance and lastly majority of respondents (63.2%) reported that conducting a thorough need assessment significantly improves project performance. This indicates that a significant portion of participants strongly believe that a thorough need assessment plays a crucial role in enhancing project performance.
Table 4.8: In your experience, how does conducting a thorough need assessment impact project performance?
|
|
Frequency |
Percent |
|
|
Valid |
Extremely improves project performance |
6 |
5.7 |
|
Moderately improves project performance |
23 |
21.7 |
|
|
No significant impact on project performance |
10 |
9.4 |
|
|
Significantly improves project performance |
67 |
63.2 |
|
|
Total |
106 |
100.0 |
|
Source: Author (2024)
Table 4.8 presents the distribution of the number of responses related to the contribution of need assessment to project performance in various aspects. The findings indicated that, a significant number of (38) respondents reported a significant contribution of need assessment to meeting project objectives, (50) respondents reported a significant contribution of need assessment to stakeholder satisfaction, (54) respondents reported a significant contribution of need assessment to resource allocation and utilization, (41) reported a significant contribution of need assessment to risk management, and (51) respondents reported a significant contribution of need assessment to budget control. Therefore, the findings suggest that need assessment contributes significantly to project performance in various aspects.
Table 4.9: Contribution of Need Assessment to Project Performance
|
Distribution of Number of Responses |
||||||||
|
No |
Aspects |
No contribution |
Little contribution |
Average contribution |
A fair contribution |
Significant contribution |
N |
|
|
1 |
Meeting project objectives |
9 |
2 |
34 |
23 |
38 |
106 |
|
|
2 |
Stakeholder satisfaction |
3 |
7 |
17 |
29 |
50 |
106 |
|
|
3 |
Resource allocation and utilisation |
1 |
7 |
17 |
27 |
54 |
106 |
|
|
4 |
Risk management |
0 |
4 |
24 |
37 |
41 |
106 |
|
|
5 |
Budget control |
1 |
5 |
11 |
38 |
51 |
106 |
|
Source: Author (2024)
4.1.3.2 Adoption of Need Procurement Practices
The study established the extent in which the construction companies had adopted need procurement practices and Table 4.10 shows the distribution on the findings. The results in this Table indicate that need functions, planning, assessing the risk was adopted to a great extent (Number of responses = 45), Advertising was adopted to a great extent (Number of responses = 42). International competitive bidding was adopted to a great extent (Number of responses = 50), (63) respondents reported that the procurement review committee is adopted to a great extent, (60) respondents stated that a scorecard for procurement evaluation is adopted to a great extent, (60) respondents reported that a procurement database is adopted to a great extent, (55) stated that procurement plans are adopted to a great extent and (63) respondents reported that an annual procurement report is adopted to a great extent. To conclude, the findings suggest that the majority of participants perceive the adoption of need procurement practices to be effective in various aspects.
Table 4.10: Adoption of Need Procurement Practices
|
|
|
Distribution of Number of Responses |
|||||
|
No |
Aspects |
Very low extent |
Low extent |
Moderate extent |
Great extent |
Very great extent |
N |
|
1 |
Need functions, planning, assessing the risk |
7 |
6 |
37 |
45 |
11 |
106 |
|
2 |
Advertising |
1 |
15 |
30 |
42 |
18 |
106 |
|
3 |
International competitive bidding |
1 |
8 |
31 |
50 |
16 |
106 |
|
4 |
Procurement review committee |
3 |
7 |
20 |
63 |
13 |
106 |
|
5 |
Score card for procurement evaluation |
4 |
2 |
28 |
60 |
12 |
106 |
|
6 |
Procurement database |
1 |
5 |
23 |
60 |
17 |
106 |
|
7 |
Procurement plans |
2 |
2 |
27 |
55 |
20 |
106 |
|
8 |
Annual procurement report |
2 |
4 |
18 |
63 |
19 |
106 |
Source: Author (2024)
Suppler Sourcing and Project Performance
Table 4.11 presents the data on how respondents typically identify potential suppliers for their projects. The findings showed that, (0.9%) of the respondents, indicated they typically contact potential suppliers directly when identifying suppliers for their projects, (18.9%) of the respondents indicated that they typically utilize supplier databases or directories to identify potential suppliers, 3.8% of the respondents reported that they typically conduct internet searches and research to identify potential suppliers, (11.3%) of the respondents stated that they typically rely on recommendations from colleagues, (41.5%) reported that they typically use the Request for Proposals (RFPs) method to identify potential suppliers and (23.6%) of the respondents indicated that they typically use the Request for Quotations (RFQs) method to identify potential suppliers. Overall, the findings suggest that the most commonly used methods for identifying potential suppliers are utilizing supplier databases/directories, followed by RFPs and RFQs.
Table 4.11: How do you typically identify potential suppliers for your projects?
|
|
Frequency |
Percent |
|
|
Valid |
Contact supplier directly |
1 |
.9 |
|
Supplier databases/directories |
20 |
18.9 |
|
|
Internet search and research |
4 |
3.8 |
|
|
Recommendations from colleagues/professional networks |
12 |
11.3 |
|
|
Request for Proposals (RFPs) |
44 |
41.5 |
|
|
Request for Quotations (RFQs) |
25 |
23.6 |
|
|
Total |
106 |
100.0 |
|
Source: Author (2024)
Table 4.12 presents the data on how respondents evaluate potential suppliers during the sourcing process. The findings indicated that (3.8%) of the respondents indicated that they evaluate potential suppliers based on their compliance with project requirements,( 12.3%) of the respondents reported that they evaluate potential suppliers based on price comparison, (14.2%) of the respondents indicated that they evaluate potential suppliers based solely on quality assessments, (39.6%) reported that they evaluate potential suppliers based on price, quality, supplier capabilities and capacity, reputation and track record, as well as compliance with project requirements, 10.4% of the respondents indicated that they evaluate potential suppliers based on reputation and track record, (9.4%) of the respondents reported that they evaluate potential suppliers based on their capabilities and capacity. This indicates that a significant number of participants consider multiple criteria when evaluating potential suppliers. These results highlight the importance of considering various factors in the supplier evaluation process to select suppliers that best meet project requirements and organizational needs.
Table 4.12: How do you evaluate potential suppliers during the sourcing process?
|
|
Frequency |
Percent |
|
|
|
|
Compliance with project requirements |
4 |
3.8 |
|
|
It depends I would say all of the above play a significant part in the decision making process |
1 |
.9 |
|
|
|
Price comparison |
13 |
12.3 |
|
|
|
Price comparison, Compliance with project requirements |
1 |
.9 |
|
|
|
Price comparison, Quality assessments |
2 |
1.9 |
|
|
|
Price comparison, Quality assessments, Supplier capabilities and capacity |
2 |
1.9 |
|
|
|
|
Price comparison, Quality assessments, Supplier capabilities and capacity, Reputation and track record |
2 |
1.9 |
|
|
Price comparison, Quality assessments, Supplier capabilities and capacity, Reputation and track record, Compliance with project requirements |
42 |
39.6 |
||
|
Quality assessments |
15 |
14.2 |
||
|
Quality assessments, Reputation and track record |
1 |
.9 |
||
|
Quality assessments, Supplier capabilities and capacity, Reputation and track record, Compliance with project requirements |
1 |
.9 |
||
|
Reputation and track record |
11 |
10.4 |
||
|
Supplier capabilities and capacity |
10 |
9.4 |
||
|
Supplier capabilities and capacity, Reputation and track record |
1 |
.9 |
||
|
Total |
106 |
100.0 |
||
Source: Author (2024)
Table 4.13 presents the data on the importance of establishing long-term relationships with suppliers for project success. The findings indicated that, (8.5%) of the respondents indicated that establishing long-term relationships with suppliers is extremely important for project success, (13.2%) of the respondents reported that establishing long-term relationships with suppliers is moderately important for project success, (2.8%) of the respondents reported that establishing long-term relationship is not important,( 6.6%) of the respondents indicated that establishing long-term relationships with suppliers is somewhat important for project success, a majority of respondents (68.9%) reported that establishing long-term relationships with suppliers is very important for project success. To conclude, the findings suggest that the majority of participants consider establishing long-term relationships with suppliers as very important for project success and also this highlights the recognition of the strategic value that long-term partnerships can bring, such as increased trust, collaboration, and reliability in the supplier relationship.
Table 4.13: How important is it for you to establish long-term relationships with suppliers for project success?
|
|
Frequency |
Percent |
|
|
Valid |
Extremely important |
9 |
8.5 |
|
Moderately important |
14 |
13.2 |
|
|
Not important at all |
3 |
2.8 |
|
|
Somewhat important |
7 |
6.6 |
|
|
Very important |
73 |
68.9 |
|
|
Total |
106 |
100.0 |
|
Source: Author (2024)
The study established the extent in which the construction companies had adopted suppler sourcing and Table 4.14 shows the distribution on the findings. Employees of the construction companies have fully adopted acceptable tendering regulations to a great extent (Number of responses = 54), (70) respondents reported that the organization's management has fully implemented the procurement policy to a great extent, (47) respondents stated that the implementation of the purchasing manual is complete to a great extent, (72) respondents rated the project implementation efficiency as great extent,( 62) respondents reported that the workers of the organization serve suppliers' objectives to a great extent, (63) respondents stated that proposals are made and submitted to all potential suppliers to a great extent, (65) respondents reported that the organization is linked up to its suppliers and end users to a great extent. To conclude the findings indicate that the majority of participants perceive the adoption of supplier sourcing practices to be effective in various aspects.
Table 4.14: Adoption of Supplier Sourcing
|
Distribution of Number of Responses |
|||||||
|
No |
Aspects |
Very low extent |
Low extent |
Moderate extent |
Great extent |
Very great extent |
N |
|
1 |
Employees have fully adopted acceptable tendering regulations |
7 |
8 |
32 |
54 |
5 |
106 |
|
2 |
Organization’s management has fully implemented procurement policy |
3 |
8 |
18 |
70 |
7 |
106 |
|
3 |
The implementation of the purchasing manual is complete |
3 |
6 |
30 |
47 |
20 |
106 |
|
4 |
To what extent do you think is the project implementation efficient1 |
3 |
5 |
18 |
72 |
10 |
106 |
|
5 |
The workers of the organization serve suppliers’ objective |
9 |
4 |
20 |
62 |
11 |
106 |
|
6 |
Proposals are made and submitted to all potential suppliers |
3 |
7 |
19 |
63 |
14 |
106 |
|
7 |
The organization is linked up to its suppliers and end users |
4 |
3 |
16 |
65 |
18 |
106 |
Source: Author (2024)
4.1.6 Procurement Negotiation on Project Performance
Table 4.15 presents the data on the factors considered during procurement negotiation. The findings indicated that, (6.6% )of the respondents reported that contract terms and conditions are a significant factor in their procurement negotiation,( 9.4% )of the respondents considered delivery time as an important factor during procurement negotiation, (15.1%) of respondents indicated that price is a critical factor during procurement negotiation, (14.2%) of the respondents stated that quality is an essential consideration during procurement negotiation, ( 4.7%) of the respondents mentioned that supplier reputation plays a role in their procurement negotiation. These results emphasize the importance of balancing factors such as cost, quality, reliability, and contractual terms when engaging with suppliers. By prioritizing these factors, organizations can strive to establish favorable and mutually beneficial procurement agreements that meet their specific requirements and objectives.
Table 4.15: What factors do you consider during procurement negotiation?
|
|
Frequency |
Percent |
|
|
|
All of the above play a vital part in the decision making process |
1 |
.9 |
|
Contract terms and conditions |
7 |
6.6 |
|
|
Delivery time |
10 |
9.4 |
|
|
Delivery time, Contract terms and conditions |
1 |
.9 |
|
|
Price |
16 |
15.1 |
|
|
Price, Delivery time, Contract terms and conditions |
1 |
.9 |
|
|
Price, Quality, Delivery time |
2 |
1.9 |
|
|
Price, Quality, Delivery time, Contract terms and conditions |
1 |
.9 |
|
|
Price, Quality, Delivery time, Supplier reputation |
4 |
3.8 |
|
|
|
Price, Quality, Delivery time, Supplier reputation, Contract terms and conditions |
41 |
38.7 |
|
Price, Quality, Supplier reputation, Contract terms and conditions |
1 |
.9 |
|
|
Quality |
15 |
14.2 |
|
|
Quality, Delivery time |
1 |
.9 |
|
|
Supplier reputation |
5 |
4.7 |
|
|
Total |
106 |
100.0 |
|
Source: Author (2024)
Adoption of Procurement Negotiation
The study established the extent in which the construction companies had adopted procurement negotiations and Table 4.16 shows the distribution on the findings. Employees of the construction companies minimize procurement expenditure to a great extent (Number of responses = 48), (68) respondents reported that the levels of cost reduction control are to a great extent, (59) respondents rated the usability of goods procured as great extent, (67) rated the quality of goods procured to a great extent, (60) rated the fund utilization in their organization in the past five years to a great extent. Overall, the findings suggest that the majority of participants perceive the adoption of procurement negotiation to have a positive impact in various aspects.
Table 4.16: Adoption of Procurement Negotiation
|
Distribution of Number of Responses |
||||||||
|
No |
Aspects |
Very low extent |
Low extent |
Moderate extent |
Great extent |
Very great extent |
N |
|
|
1 |
What is the level of minimization of procurement expenditure |
10 |
4 |
37 |
48 |
7 |
106 |
|
|
2 |
What are the levels of cost reduction control |
1 |
12 |
14 |
68 |
11 |
106 |
|
|
3 |
How would you rate usability of goods procured |
3 |
2 |
30 |
59 |
12 |
106 |
|
|
4 |
What quality would you give goods procured |
3 |
0 |
19 |
67 |
17 |
106 |
|
|
5 |
How can you rate fund utilization in your organization in the past five years |
0 |
3 |
30 |
60 |
13 |
106 |
|
Source: Author (2024)
Table 4.17 presents a distribution on how respondents define project success. The findings indicated that, (13.2%)of the respondents defined project success as achieving a high level of customer satisfaction, (7.5% )of the respondents stated that completing the project within the allocated budget is a defining factor for project success,( 8.5%) of the respondents defined project success as delivering the project on time, (16.0%) indicated that meeting project objectives is a crucial aspect of project success and lastly (2.8%) of the respondents stated that meeting quality standards is an important factor in defining project success. Overall, the findings highlight that project success is defined by a combination of factors, including customer satisfaction, budget adherence, and timely delivery, meeting project objectives, and maintaining high-quality standards. These results demonstrate the multidimensional nature of project success and indicate that organizations and project stakeholders consider various factors when determining the overall success of a project. By considering these diverse elements, project managers and teams can strive to achieve comprehensive success by meeting the expectations and requirements of customers, staying within budget, delivering on time, and achieving project objectives with a focus on quality.
Table 4.17: How do you define project success? (Select all that apply)
|
|
Frequency |
Percent |
|||||||||
|
|
Achieving a high level of customer satisfaction |
14 |
13.2 |
||||||||
|
All of the above |
1 |
.9 |
|||||||||
|
Completing the project within the allocated budget |
8 |
7.5 |
|||||||||
|
Completing the project within the allocated budget, Achieving a high level of customer satisfaction |
2 |
1.9 |
|||||||||
|
Delivering the project on time |
9 |
8.5 |
|||||||||
|
Meeting project objectives |
17 |
16.0 |
|||||||||
|
Meeting project objectives, Completing the project within the allocated budget, Achieving a high level of customer satisfaction, Meeting quality standards |
1 |
.9 |
|||||||||
|
Meeting project objectives, Completing the project within the allocated budget, Delivering the project on time |
3 |
2.8 |
|||||||||
|
Meeting project objectives, Completing the project within the allocated budget, Delivering the project on time, Achieving a high level of customer satisfaction |
1 |
.9 |
|||||||||
|
|
Meeting project objectives, Completing the project within the allocated budget, Delivering the project on time, Achieving a high level of customer satisfaction, Meeting quality standards |
45 |
42.5 |
|
|||||||
|
|
Meeting project objectives, Delivering the project on time |
1 |
.9 |
|
|||||||
|
|
Meeting project objectives, Meeting quality standards |
1 |
.9 |
|
|||||||
|
Meeting quality standards |
3 |
2.8 |
|
||||||||
|
Total |
106 |
100.0 |
|
||||||||
Source: Author (2024)
Table 4.18 presents the data on how respondents typically evaluate project performance. The finding shows that, (3.8%) of the respondents indicated that they evaluate project performance by analyzing project deliverables against defined requirements, (12.3%) of the respondents stated that they assess project performance using key performance indicators (KPIs), (20.8%) of the respondents mentioned that they evaluate project performance by conducting stakeholder surveys or feedback sessions, (1.9%) of the respondents stated that they evaluate project performance by holding project review meetings with the team and lastly, (11.3%) of the respondents mentioned that they evaluate project performance by reviewing project documentation and reports. In conclusion, the findings indicate that project performance evaluation involves multiple methods, including analyzing project deliverables against defined requirements, assessing KPIs, conducting stakeholder surveys or feedback sessions, holding project review meetings with the team, and reviewing project documentation and reports.
Table 4.18: How do you typically evaluate project performance? (Select all that apply)
|
|
Frequency |
Percent |
|
|
|
All of the above should be part of the evaluation process |
1 |
.9 |
|
Analysing project deliverables against defined requirements |
4 |
3.8 |
|
|
Analysing project deliverables against defined requirements, Conducting stakeholder surveys or feedback sessions |
1 |
.9 |
|
|
Analysing project deliverables against defined requirements, Holding project review meetings with the team |
1 |
.9 |
|
|
Assessing key performance indicators (KPIs) |
13 |
12.3 |
|
|
Assessing key performance indicators (KPIs), Analysing project deliverables against defined requirements, Conducting stakeholder surveys or feedback sessions |
1 |
.9 |
|
(Table 4.8: Continued)
|
|
Assessing key performance indicators (KPIs), Analysing project deliverables against defined requirements, Conducting stakeholder surveys or feedback sessions, Holding project review meetings with the team |
1 |
.9 |
|
Assessing key performance indicators (KPIs), Analysing project deliverables against defined requirements, Conducting stakeholder surveys or feedback sessions, Reviewing project documentation and reports |
1 |
.9 |
|
|
Assessing key performance indicators (KPIs), Analysing project deliverables against defined requirements, Conducting stakeholder surveys or feedback sessions, Reviewing project documentation and reports, Holding project review meetings with the team |
43 |
40.6 |
|
|
Assessing key performance indicators (KPIs), Analysing project deliverables against defined requirements, Conducting stakeholder surveys or feedback sessions, Reviewing project documentation and reports, Holding project review meetings with the team, By feedback from beneficiaries |
1 |
.9 |
|
|
Assessing key performance indicators (KPIs), Conducting stakeholder surveys or feedback sessions, Holding project review meetings with the team |
1 |
.9 |
|
|
Assessing key performance indicators (KPIs), Conducting stakeholder surveys or feedback sessions, Reviewing project documentation and reports |
1 |
.9 |
|
|
Conducting stakeholder surveys or feedback sessions |
22 |
20.8 |
|
|
Holding project review meetings with the team |
2 |
1.9 |
|
|
Reviewing project documentation and reports |
12 |
11.3 |
|
|
Reviewing project documentation and reports, Holding project review meetings with the team |
1 |
.9 |
|
|
Total |
106 |
100.0 |
Source: Author (2024)
Procurement Practices and Project Performance
The study further sought to determine whether procurement practices had contributed in the project performance of construction companies in Bamenda. The results in table 19 indicates that effective project planning and management improves project performance to a great extent (Number of responses = 57), Adequate allocation of resources ensures that the project stays within the budget to a great extend (number of responses = 70), (56) respondents indicating that their organization moderately extent reduces cost through procurement functions, (70) respondents reported that clear communication and collaboration among stakeholders to a great extent increases project performance, (69) respondents stated that adapting to changing project requirements and circumstances greatly extent leads to increased project performance. These results highlight the significance of these procurement practices in ensuring successful project outcomes in construction companies in Bamenda.
Table 4.19. Procurement planning and project performance
|
No |
Aspects |
Very low extent |
Low extent |
Moderate extent |
Great extent |
Very Great extent |
N |
|
1 |
project budgets were approved prior to project commencement |
2 |
10 |
29 |
61 |
4 |
106 |
|
2 |
the procurement was cost as per the project budget approved |
1 |
10 |
25 |
68 |
2 |
106 |
|
3 |
professional advice and support that is training and counselling was provided to individual procuring entities |
11 |
0 |
31 |
64 |
4 |
106 |
|
4 |
all procurements were submitted on time and consistent with the procurement plan and schedule |
1 |
7 |
27 |
67 |
4 |
106 |
|
5 |
Realistic timelines for delivery of project equipment and services were provided |
7 |
0 |
27 |
71 |
1 |
106 |
|
6 |
Quality standards for goods and services were agreed upon by its users |
5 |
0 |
36 |
62 |
3 |
106 |
|
7 |
Overall, the procurement planning improved performance |
7 |
0 |
18 |
80 |
1 |
106 |
Source: Author (2024)
Table 4.19. Above presents the distribution of how procurement planning affects project performance. The findings of the study shows that, (61) respondents reported that project budgets were approved to a great extent before project commencement, a significant proportion of respondents (68) stated that the procurement was costed to a great extent in accordance with the approved project budget, (64) reported that professional advice and support, including training and counseling, were provided to a great extent to individual procuring entities. Also, (67) reported that all procurements were submitted to a great extent on time and in accordance with the procurement plan and schedule, (71) indicated that realistic timelines for the delivery of project equipment and services were provided to a great extent, (62) respondents stated that quality standards for goods and services were agreed upon to a great extent by the users and lastly, (80) reported that procurement planning improved project performance to a great extent. Overall, the data from Table 4.19 highlights the importance of comprehensive procurement planning in achieving project success.
Table 4.20. Inventory management and project performance
|
No |
Aspects |
Very low extent |
Low extent |
Moderate extent |
Great extent |
Very Great extent |
N |
|
1 |
Inventory purchases sometimes fail to meet the demand and supply of the project |
6 |
13 |
43 |
35 |
9 |
106 |
|
2 |
Rate your Organization level of stores’ management practice |
3 |
16 |
46 |
36 |
5 |
106 |
|
3 |
Organization level of reduction in inventory costs |
21 |
0 |
37 |
46 |
2 |
106 |
|
4 |
Able to deliver quality service to end users of the project |
3 |
19 |
27 |
54 |
3 |
106 |
|
5 |
Procuring of goods and services add to cost reduction to the organization |
2 |
10 |
43 |
49 |
2 |
106 |
Source: Author (2024)
Table 4.20 presents data on inventory management and its impact on project performance. The findings above showed that, A notable proportion of respondents (43) reported that inventory purchases sometimes fail to meet the demand and supply of the project to a moderate extent, (46) rated their organization's level of stores' management practice as moderate, (46) reported a great extent of reduction in inventory costs at the organization level. In addition, majority of respondents (54) stated that they are able to deliver quality service to end users of the project to a great extent and lastly, majority of respondents (54) stated that they are able to deliver quality service to end users of the project to a great extent. This is to show that, by focusing on improving inventory management practices, organizations can enhance their ability to meet project demands, reduce costs, and deliver high-quality service, ultimately leading to improved project performance.
Table 4.21: Project Performance
|
|
|
Distribution of Number of Responses |
|||||
|
No |
Aspects |
Very low extent |
Low extent |
Moderate extent |
Great extent |
Very great extent |
N |
|
1 |
Effective project planning and management improves project performance |
7 |
5 |
26 |
57 |
11 |
106 |
|
2 |
Adequate allocation of resources ensures that the project stays within the budget so as to avoid cost overruns and thereby increasing performance |
9 |
9 |
10 |
70 |
14 |
106 |
|
3 |
To what extend does your organization reduce cost through procurement functions?] |
1 |
5 |
30 |
56 |
14 |
106 |
|
4 |
Clear communication and collaboration among stakeholders increase project performance |
3 |
1 |
18 |
70 |
14 |
106 |
|
5 |
Adapting to changing project requirements and circumstances leads to increased project performance |
1 |
5 |
13 |
69 |
18 |
106 |
Source: Author (2024)
Model Determination
The goodness of fit results is as displayed in Table 4.20. The regression model provided an R Square value of 0.676. This implies that the predictors used in this model can explain 67.6% of the variations of the dependent variable the remaining percentage can be accounted for by other variables other than those used in the study. The study presents a Durbin-Watson value of 2.027 which is within the range 1.5 to 2.5, indicating the model does not suffer from autocorrelation.
|
Model |
R |
R Square |
Adjusted R Square |
Std. Error of the Estimate |
Durbin-Watson |
|
1 |
.822a |
.676 |
.659 |
.35270 |
2.027 |
|
a. Predictors: (Constant), Inventory management, Procurement negotiation, Procurement planning, Need Assessment, Supplire Sourcing |
|||||
|
b. Dependent Variable: Project performance |
|||||
Source: Author (2024)
Test of Significance
The test of significance was estimated by the use of ANOVA as indicated in Table 4.21. The model gave ANOVA regression sum squares of 25.915 and residual sum square of 12.440. The mean square for regression is 5.183and a residual mean of O. 124. The output provided an F- statistics value of 41.664 with a p– value of 0.000. From the ANOVA result the processed data had a significance level of 0.000 which shows that the data is ideal for making a conclusion. This is an implication that all the variables used in the model namely, need assessment, suppler sourcing and procurement negotiation are significant in predicting project performance of construction companies. Therefore, from the results on the overall p – value of F – statistics given, it can be assumed that the model used in the study is significant since the confidence interval used was 95% leaving an allowance of 5%.
|
Model |
Sum of Squares |
df |
Mean Square |
F |
Sig. |
|
|
1 |
Regression |
25.915 |
5 |
5.183 |
41.664 |
.000b |
|
Residual |
12.440 |
100 |
.124 |
|
|
|
|
Total |
38.355 |
105 |
|
|
|
|
Source: Author (2024)
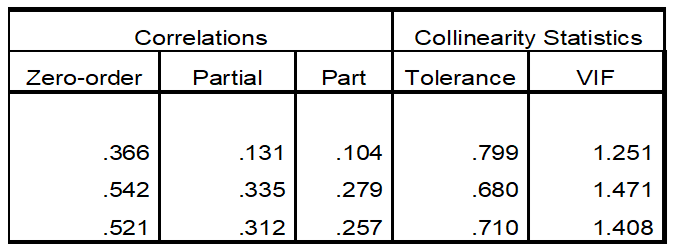
Multicolinearity Test
The presence of multi-co-linearity test for more than two or more independent variables can be checked from the coefficient of the variables. Table 4.22, multi-co-linearity statistics indicates that variance inflation factor (VIF) < 5 or the tolerance > 0.2. According to hairetal, (2006) the importance of test existence of multi-co linearity is to check whether the independent variable are correlated each other to check the tolerance and variance inflation factor (VIF) value and when there is high multi-co linearity and instability of the B and beta coefficient VIF is higher than 5 the tolerance less than 0.2, hence there is no multicollinearity among independent variable. Therefore, it is possible to use correlation and multiple regression analysis.
Table 4.22: Collinearity Statistics
Source: Author (2024)
Normality, Linearity and Outliers Testing (test for existence of outliers)
Figure 4.1 indicates scores on each variable were normally distributed and linearity test shows the relationship between the variables were linear. This can be checked by inspecting the histogram of scores on each variable to describe a symmetrical bell-shaped curve which has the greatest frequency of scores in the middle, with smaller frequency towards the extremes. According to field (2005), the existence of outliers can influence the value of the estimated regression coefficient and it should be removed before running the regression analysis while multivariate outliers can be detected by using cooks distance. In order to check normality whether the residual or error terms were normally distributed or not and linearity, a graph is plotted using SPSS regression graph and the assumption of linearity and normality is shown by the graphs in Figure 4.1 and Figure 4.2 below and both linearity and normality testing are accepted and no outlier were detected in the study.
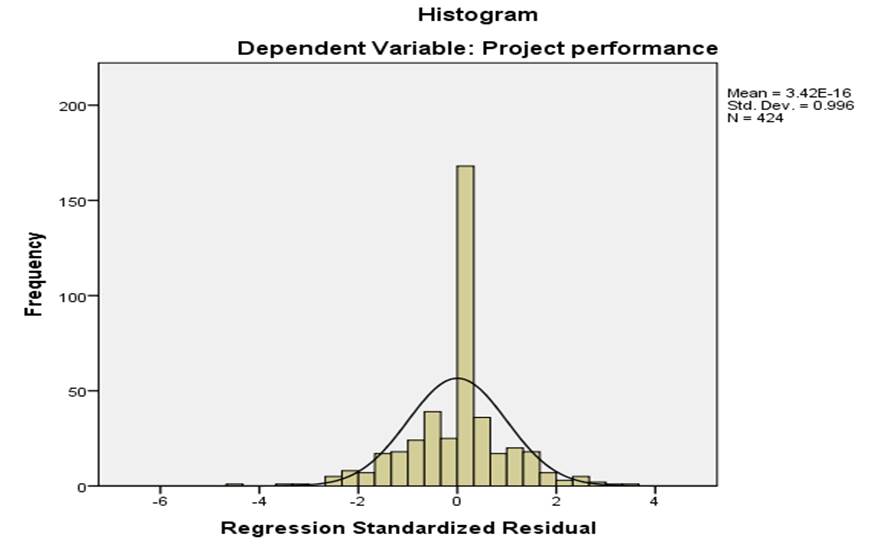
Figure 4.1: Normality, Linearity and Outliers Testing
Source: Author (2024)
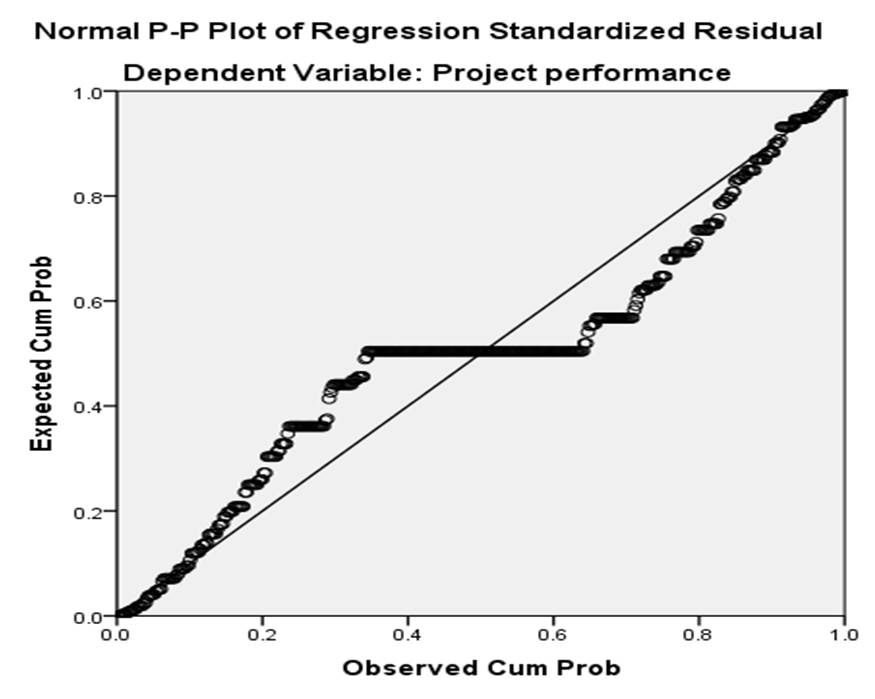
Figure 4.2: Normal P-P Plot
Source: Author (2024)
. Homoscedasticity Test
Figure 4.3 shows the variability in scores for independent variables would be similar at all values of dependent variable. It can be checked by using scatter plot which shows a fairly even cigar shape and absence of cone-like scatter plot.
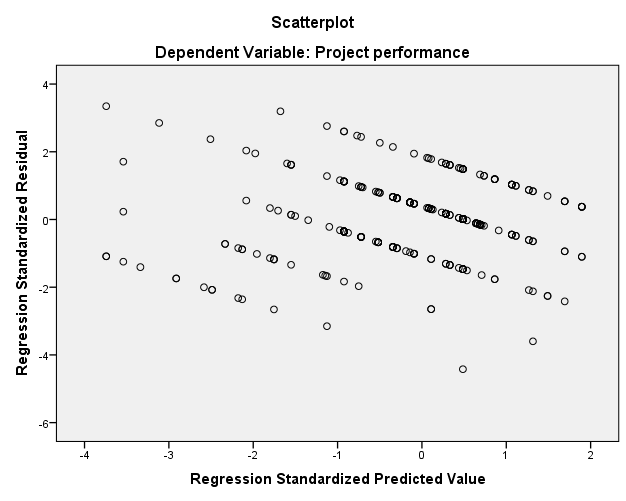
Figure 4.3: Scatterplot
Source: Author (2024)
Linear Regression and Coefficients of the Variables
Before linear regression analysis, assumptions for linear regression: linearity, normality, multi-co linearity, and homoscedasticity were checked. Table 4.23 provides the coefficient findings? It is clear that need assessment has a positive significant effect on the project performance of construction companies in Bamenda, as it gave a coefficient value of 0.108 (t = 5.568) and a significance level of 0.007. Similarly, supplier sourcing has a highly positive significant impact on the project performance of construction companies in Bamenda with a coefficient value of .335 (t = 7.291) and significance level of 0.000. In addition to this procurement negotiation equally has a highly significant impact on the project performance of construction companies in Bamenda with coefficient values of 0.309 (t = 6.723) and a significant level of 0.000.
Furthermore, procurement planning and inventory management was seen to have a negative significant effect on project performance of construction companies in Bamenda as it gave a coefficient value of 0.021 (t = 0.256) and a significant level of 0. 799 for procurement planning and for inventory management it was seen to have a coefficient value of 0.029 (t = 0 -.460) and a significant level of 0.646. Therefore, from the findings it can be concluded that project performance can be improved through the adoption of proper need assessment, supplier sourcing and procurement negotiation. The predictive model provided by the research findings is as expressed below:
PCCB = 0.984 + 0.108NA+ 0.335SS + 0.309PN + 0.021PP+0-.029 µ………………..…. (1)
Table 4.23: Coefficientsa and Multi-collinearity Statistics Test
|
Coefficientsa |
||||||||
|
Model |
Unstandardized Coefficients |
Standardized Coefficients |
t |
Sig. |
Collinearity Statistics |
|||
|
B |
Std. Error |
Beta |
Tolerance |
VIF |
||||
|
1 |
(Constant) |
.984 |
.177 |
|
5.568 |
.000 |
|
|
|
Need Assessment |
.108 |
.040 |
.116 |
2.716 |
.007 |
.454 |
2.203 |
|
|
Supplier Sourcing |
-.335 |
.046 |
.338 |
7.291 |
.000 |
.250 |
3.997 |
|
|
Procurement negotiation |
.309 |
.046 |
.305 |
6.723 |
.000 |
.251 |
3.988 |
|
|
Procurement planning |
.021 |
.084 |
.015 |
.256 |
.799 |
.928 |
1.077 |
|
|
Inventory management |
-.029 |
.063 |
-.026 |
-.460 |
.646 |
.983 |
1.018 |
|
|
a. Dependent Variable: Project performance |
||||||||
Source: Author (2024)
. Hypothesis Testing
The first hypothesis stated that need assessment has no significant effect on project performance of construction companies in Bamenda was rejected as the studies indicated that need assessment has a positive significant effect on the project performance of construction companies in Bamenda, as it gave a coefficient value of 0.108 (t = 5.568) and a significance level of 0.007.
Also the second hypothesis stated that supplier sourcing does not have a significant effect on project performance of construction companies in Bamenda was rejected as the studies indicated that has a highly significant effect on the project performance of construction companies in Bamenda with a coefficient value of .335 (t = 7.291) and significance level of 0.000.
Lastly the assumption that procurement negotiation has no significant on project performance of Construction Companies in Bamenda was reject indicating that, procurement negotiation equally has a highly significant impact on the project performance of construction companies in Bamenda with coefficient values of 0.309 (t = 6.723) and a significant level of 0.000.
Conclusion
Based on the findings the study concludes that construction companies in Bamenda has adopted the procurement practices to a great extent and that there is a relationship between the practices of procurement and project performance. A procurement process which is termed to be well prepared and implemented increases the possibilities to organizations inventories cost reduction which encompasses good services to customers as well as aid fast turns of inventory. With Suppliers as an external stakeholder, organizations must communicate with them because it is very important to maintain good supplier relationship as they provide the goods and services needed for project implementation. However, need assessment, supplier sourcing and procurement negotiation was found to have a significant effect on project performance. This implies that, through proper need assessment, supplier sourcing and procurement negotiation, construction companies can be sure of increasing its performance level in form of quality of goods and services delivered as well as deliveries being made on time. Findings of this study are as well of great importance to researchers and academicians as this research adds to other scholars’ literature and knowledge gap in procurement practices and filled the existing gaps as far as project performance is concerned and therefore, avail them with option for further research in relation to project performance based on procurement practices. This study therefore concluded that that an increase in each of the aforementioned procurement functions increase the performance of a project implemented in in construction companies.
Recommendations
This study therefore recommends that those in charge of procurement should come up with viable ways of managing the procurement process. To ensure better project performance, organizations should not only focus on need assessment, supplier sourcing and procurement negotiation but also on the procurement planning, procurement inventory and training workforces. Critical revitalization of the procurement process is a requirement as it can assist in ensuring that organizations embrace modern technological ways and trends in handling and addressing procurement issues. The organization’s management in partnership with other stakeholders should embrace modern ways in need assessment, procurement negotiation and supplier sourcing on practices of procurement, and as well came up with well-tailored training programs and proper procurement inventory management.


Open Access By Aditum Open Access Journals id licensed under Creative Commons Attribution 4.0 International License. Based On a Work at aditum.org