
International Journal of Business Research and Management
OPEN ACCESS | Volume 5 - Issue 2 - 2026
ISSN No: 3065-6753 | Journal DOI: 10.61148/3065-6753/IJBRM


Mohammad Tanvirul Hasnat1*, Md. Taslim2
1Sr. Executive – Production Planning & Control -Sterling Denims Ltd.
2GM-Operations – Sterling Denims Ltd.
*Corresponding Author: Mohammad Tanvirul Hasnat, Sr. Executive – Production Planning & Control -Sterling Denims Ltd.
Received: October 20, 2026 | Accepted: October 30, 2026 | Published: November 12, 2026
Citation: Mohammad T Hasnat, Md. Taslim., (2026). “Factors affecting absenteeism of Sewing Machine Operators with special reference to readymade garments industry in Bangladesh: An Analytical Approach”. International Journal of Business Research and Management 5(4); DOI: 10.61148/3065-6753/IJBRM/107.
Copyright: © 2026. Mohammad Tanvirul Hasnat. This is an open access article distributed under the Creative Commons Attribution License, which permits unrestricted use, distribution, and reproduction in any medium, provided the original work is properly cited.
Purpose: This quantitative study investigates the key drivers of employee absenteeism among sewing machine operators in Bangladesh’s ready-made garment (RMG) industry. Specifically, it evaluates the individual and collective impact of health issues, domestic conflict, excessive workload, and workplace interpersonal dynamics to provide empirical support for targeted human resource management strategies.
Methods: Guided by a pragmatist philosophy and deductive design, data were collected using structured, 5-point Likert scale questionnaires. The sample comprised 310 sewing machine operators selected from a population of 1,600 employees at Sterling Denims Ltd. via the Krejcie and Morgan sampling technique. Analytical procedures in SPSS included descriptive statistics, Cronbach’s alpha reliability tests, Pearson correlations, and multiple linear regression analysis
Results: All measurement scales exhibited high internal consistency (alpha = 0.852 to $0.894; overall scale alpha = 0.942). The regression model was statistically significant, F(4, 305) = 121.845, p < .001, explaining 61.2% of the variance in absenteeism (R2 = .612). All four variables positively and significantly predicted absenteeism. Workload intensity emerged as the strongest factor (beta = 0.376, p < .001), followed by physical illness (beta = 0.298, p < .001), family problems (beta = 0.233, p < .001), and interpersonal relationship issues (beta = 0.175, p < .001). Multicollinearity was ruled out as VIF values remained well below acceptable limits.
Conclusion: Heavy workloads and health complications are the primary drivers of worker non-attendance in RMG factories. To reduce absenteeism and safeguard operational output, garment manufacturers must implement sustainable work allocation, ergonomic practices, workplace wellness initiatives, and supportive employee assistance programs.
Absenteeism, Ready-Made Garment (RMG), Sickness, Family Problem, Excessive Workload, Interpersonal Relationship, Bangladesh, Sewing Machine Operators, Regression, Correlation
Absenteeism refers to a situation where an employee fails to be present at their designated workplace during the hours they are required or presumed to be on duty. The unanticipated duration of this missed work time constitutes an absence, and the employee experiencing this condition is termed an absentee. Workplace absenteeism refers to a chronic, unexcused pattern of an employee missing work. Employee absenteeism not only has an effect on poor resource utilization but also influences on the gross income of employees, this reduced gross income of employees leads poor purchasing power of employees, poor family harmony, health and more physical and psychological stress [1].Bangladesh’s ready-made garment (RMG) sector exemplifies a labor intensive industry that yields extensive economic dividends, most notably through mass employment and robust contributions to the nation's financial stability [2]. The ready-made garment sector serves as Bangladesh's primary employment generator, employing millions of domestic workers across the country [3]. Contributing the highest share to Bangladesh's export receipts, the Ready-Made Garment industry comprises more than 5,000 factories and employs in excess of 4 million people, the vast majority of whom upward of 80% are women [4]. Table 1 illustrates the RMG sector's contribution to Bangladesh's economy, revealing a growth rate of approximately 3.34% between the 2020–21 and 2021–22 fiscal years [5].
Table 1: Bangladesh’s Latest Export Market Performance and RMG Contribution (Source: BGMEA)
|
Year |
Export of RMG |
Total Export of Bangladesh |
% of RMG’s to Total Export |
|
2020-21 |
31456.73 |
38758.31 |
81.16 |
|
2021-22 |
42613.15 |
52082.66 |
81.82 |
|
2022-23 |
38142.10 |
46430.71 |
82.15 |
|
2023-24 |
36151.31 |
44469.74 |
81.29 |
|
2024-25 |
39346.97 |
48283.93 |
81.49 |
The study highlights that assembly-line garment assembly requires strict, sequential balance among operators, where a single absent worker disrupts the entire production flow, lowers output, increases hiring costs, and risks firm reputation. Consequently, addressing absenteeism requires factory leaders to pinpoint core drivers and deploy targeted HR solutions, such as supportive policy revisions and workforce counseling. This research investigates those specific root causes within the apparel manufacturing context.
Scheduled man-shifts are directly lost as a result of unexpected absences in organization, which causes production schedules to be pushed back and customer lead times to be extended & reduce productivity by as much as 36% [6]. Absence can have a negative impact on employee morale and motivation in manufacturing companies. According to the U.S Department of Labor, absence costs employers $100 billion per year [7]. Each year, the ready-made garment (RMG) sector loses BDT 31.14 billion (283.1 million USD) to a combination of heat-induced worker absences, direct medical costs borne by employees, and same-day production losses on the factory floor. This financial burden accounts for 9.24% of the industry’s total annual wage expenditure [8].
A meta-analysis of 33 studies reveals that positive family dynamics, such as parental support and expectations, significantly lower school absenteeism and dropout rates. Conversely, negative family environments strongly correlate with chronic truancy. Notably, the study highlights a developmental shift: beneficial family influences matter most during primary school, while destructive home dynamics become most damaging during the secondary school years, underscoring the need for family-focused early interventions rather than blaming students in isolation [9]. Family disengagement was linked to absenteeism rates of 10 to 15% and higher [10]. A study on Japanese workers shows that high work-family conflict significantly drives up absenteeism, with those experiencing the most conflict being 2.65 times more likely to miss work than those with low conflict [11]. Research reveals that family demands directly influence how burnout affects missing work. Specifically, burned-out employees have higher absenteeism if they are raising children under six or struggling with childcare logistics [12].Career attendance for dedicated parents, particularly mothers, is frequently interrupted by domestic obligations. These duties commonly include managing morning routines for school-aged children or providing immediate care during childhood illnesses [13].
Interpersonal workplace dynamics directly influence employee attendance. Empirical findings demonstrate that vertical social capital—specifically strong, trusting relationships with supervisors and upper management along with cross-departmental bridging ties, significantly reduces absences. Conversely, horizontal bonding among peers within immediate work teams shows no statistically significant impact on attendance rates [14]. Absenteeism is reduced by positive relationships and Poor relationships increase absenteeism; a direct correlation exists between poor interpersonal relationships and higher absenteeism rates. It is found that absenteeism rates increase under conditions such as poor interpersonal relationships among crew members, longer travel distances to work, unchallenging job roles, a pressured work climate, dissatisfaction with the job, and high competition within the crew [15]
Canadian research shows that severe role overload causes substantial financial and operational strain, costing over $3 billion annually in direct absenteeism losses. Individual workers experiencing high workload intensity average 8.8 absent days per year, compared to just 5.7 days for those with lower job demands [16]. Research shows that managers log fewer sick days but exhibit higher rates of presenteeism, frequently continuing to work while ill. This behavior is primarily driven by intense schedule pressures, heavy workloads, and organizational expectations of constant availability [17]. Research on police forces reveals that an insufficient workload actually correlates with more frequent employee absences [18].
Unmanaged employee sickness absence disrupts operations, lowers team morale, strains company resources, and exposes organizations to legal compliance risks. While minor physical ailments (such as colds and flu) remain the main cause of short-term absences (78%), mental ill health (29%) and work-related stress have become the leading drivers of long-term absenteeism. Crucially, organizations implementing structured health and well-being initiatives report up to a 39% reduction in absenteeism alongside marked improvements in workforce output and engagement [19].
As shown in figure 1 illustrates the applications necessary for developing better outcomes and it makes the understanding of the hypotheses as well. The following figure gives the conceptual framework at a clear level.
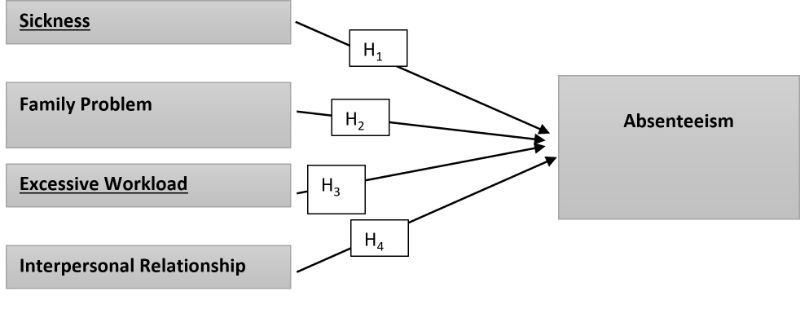
Figure 1: Hypothesized Conceptual Framework (Source: Developed by Authors)
H1: Alternative Hypothesis: There is a positive impact of Sickness on absenteeism of Sewing Machine Operators in Bangladesh.
H0: Null Hypothesis: There is no impact of Sickness on absenteeism of Sewing Machine Operators in Bangladesh.
H2: Alternative Hypothesis: There is a positive impact of Family Problem on absenteeism of Sewing Machine Operators in Bangladesh.
H0: Null Hypothesis: There is no impact of Family Problem on absenteeism of Sewing Machine Operators in Bangladesh
H3: Alternative Hypothesis: There is a positive impact of Excessive Work Load on absenteeism of Sewing Machine Operators in Bangladesh.
H0: Null Hypothesis: There is no impact of Excessive Work Load on absenteeism of Sewing Machine Operators in Bangladesh.
H4: Alternative Hypothesis: There is a positive impact of Interpersonal relationship on absenteeism of Sewing Machine Operators in Bangladesh
H0: Null Hypothesis: There is no impact of Interpersonal relationship on absenteeism of Sewing Machine Operators in Bangladesh
|
Figure STYLEREF 1 \s 3 SEQ Figure \* ARABIC \s 1 1: Research Onion Source: CITATION Mel1828 \l 1033 (Melnikovas, 2018) |
To systematically structure the study's design, Saunders, Lewis, and Thornhill's Research Onion in Figure 2 framework was applied. This model guides the research process through distinct conceptual layers, ensuring that every strategic decision strengthens the study's overall execution and validity [20]. Starting from the outermost layer, the Research Philosophy shapes the perspective on reality and determines the Research Approach used to link theory with empirical data. Inward layers guide the selection of a Research Strategy to structure the study, alongside a Research Choice that defines whether quantitative, qualitative, or mixed methods are applied. Finally, setting a Time Horizon establishes chronological boundaries before reaching the core: the concrete Techniques and Procedures executed for data collection and analysis. [21]
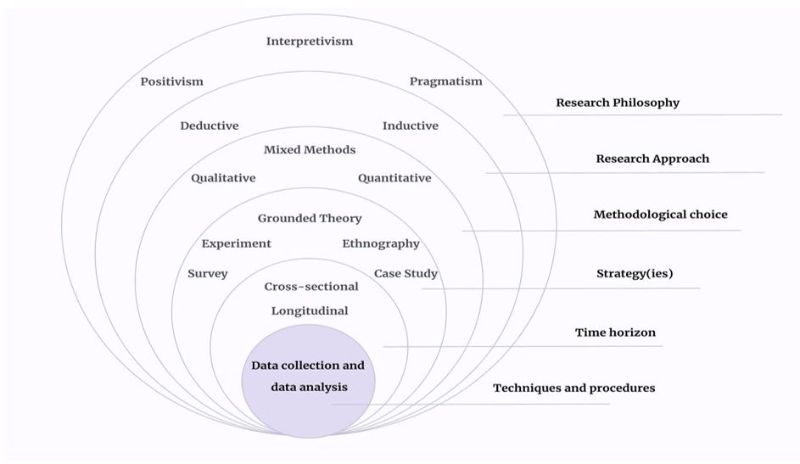
Figure 2: Saunders Research Onion Framework (Source: Saunders et al., 2018)
Applying the Research Onion framework, this study adopts a pragmatist philosophy to generate practical solutions for operator absenteeism in Bangladesh's RMG sector. A deductive approach tests existing organizational theories against empirical evidence, while a quantitative, survey-based strategy utilizes structured questionnaires to gather standardized responses across the workforce. Guided by a cross-sectional time horizon, the investigation captures a snapshot of current factory dynamics. At the core, the resulting numerical dataset undergoes statistical analysis to isolate, rank, and evaluate the primary drivers of worker absenteeism.
The population here recorded 1600 which is been recorded in the annual reports, and a sample is been selected from this population. As shown in Figure 3 Morgan Table of sample selection has been used in the sample selection and accordingly, the sample is been selected as 310 [22].
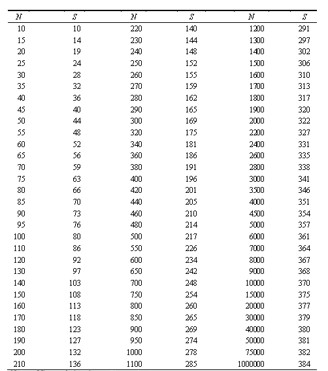
Figure 3: Krejcie & Morgan Sample Size Determination Table (Source: Krejcie & Morgan, 1970)
To investigate worker absenteeism, this study gathered primary data via a self-administered, 5-point Likert scale questionnaire between January and March 2026. Given that participants shared sensitive information—including personal health, family situations, workload pressures, and workplace dynamics strict ethical protocols were observed throughout data collection to safeguard participant anonymity, ensure confidentiality, and maintain research integrity.
Demographically, the largest segment of respondents falls within the 31–40 age bracket (45.16%), followed by those aged 20–30 (31.61%). Operators under 20 represent 15.48%, while the 41–50 group accounts for 7.74% which is shown in Figure 4.
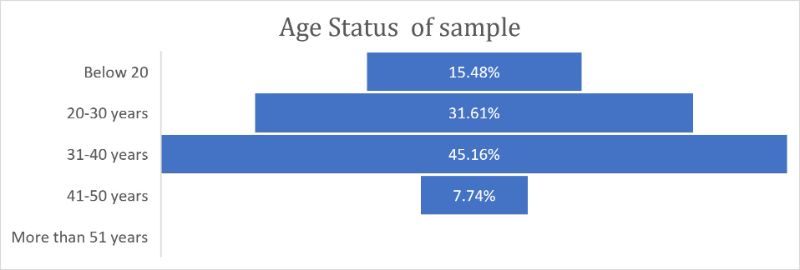
Figure 4: Age Distribution of Sample Respondents
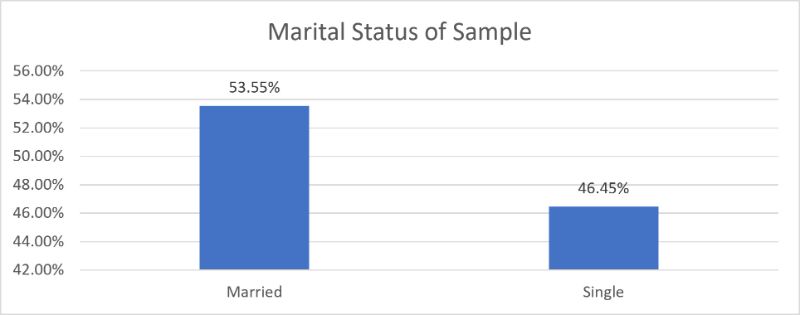
Figure 5: Marital Status of Sample Respondents
The majority, at 53.55%, are married, while a slightly smaller portion, 46.45%, are single as showed in Figure 5 .
|
Figure STYLEREF 1 \s 4 SEQ Figure \* ARABIC \s 1 3: Gender of the respondents |
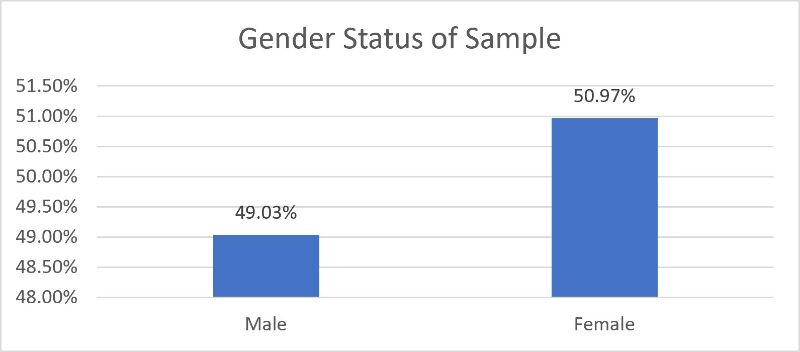
Figure 6: Gender Distribution of Sample Respondents
The figure 6 illustrates the gender distribution of the study sample, with females comprising 50.97% and males accounting for 49.03% of the total participants.
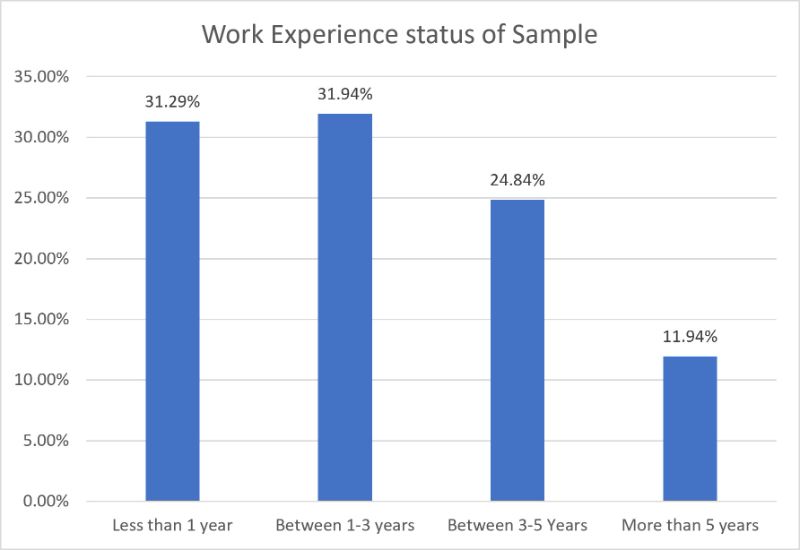
Figure 7: Work Experience Distribution of Sample Respondents
The figure 7 presents the work experience distribution of the sample, categorized into four tenure brackets. The largest segments are those with less than 1 year (31.29%) and between 1–3 years (31.94%), together accounting for nearly two-thirds of the respondents. Participants with 3–5 years of experience represent 24.84%, while those with more than 5 years constitute the smallest group at 11.94% as showed in figure 7.This skewed distribution, with a heavy concentration in the early-to-mid career stages, reflects a relatively junior sample profile, which should be considered when interpreting findings related to job tenure and organizational behavior.
Table 2: Descriptive Statistics of Constructs
|
Construct |
Mean |
Median |
SD |
Min |
Max |
Skewness |
|
Sickness |
3.12 |
3.00 |
1.35 |
1.00 |
5.00 |
+0.10 |
|
Family Problem |
3.45 |
3.67 |
1.28 |
1.00 |
5.00 |
-0.15 |
|
Excessive Workload |
3.68 |
4.00 |
1.22 |
1.00 |
5.00 |
-0.25 |
|
Interpersonal Relationship |
3.72 |
4.00 |
1.30 |
1.00 |
5.00 |
-0.30 |
Table 2: Summary of Descriptive Statistics
Reliability analysis is a fundamental step in Table 3 in research used to determine how consistent and stable a measurement tool is. By evaluating whether a scale, test, or instrument yields uniform results under unchanged conditions, this analysis confirms that the data collection process is dependable and minimizing random errors [23]. Cronbach's alpha is jointly determined by the total number of items in a scale and the magnitude of their inter-correlations. Consequently, a notable constraint of this metric is that alpha values can be artificially inflated by simply increasing the item count, even when the average inter-item correlation remains constant [24]. values at or above 0.90 are deemed "Excellent" but may warn of item redundancy, while scores between 0.80 and 0.90 are classified as "Good" and represent the ideal target for most research instruments. Coefficients from 0.70 to 0.80 are considered "Acceptable," serving as the standard baseline threshold for exploratory studies. In contrast, scores below 0.70 transition from "Questionable" (marginal reliability potentially acceptable only for brief or novel scales) down to "Poor" and "Unacceptable" (below 0.50), both of which indicate poorly correlated items that necessitate thorough revision, removal, or complete replacement of the measurement scale [25].
Table 3: Reliability Analysis (Cronbach's Alpha)
|
Variable |
Number of Items |
Cronbach's Alpha |
Respective Explanation |
|
Sickness |
3 |
0.852 |
Showing a very high reliability. |
|
Family Problem |
3 |
0.881 |
Showing a very high reliability. |
|
Excessive Workload |
3 |
0.894 |
Showing a very high reliability. |
|
Interpersonal Relationship |
3 |
0.868 |
Showing a very high reliability. |
|
Overall Scale |
12 |
0.942 |
Showing an excellent overall reliability. |
The Table 3 presents the reliability statistics for the questionnaire used in your study. It shows that each of the four factors—Sickness, Family Problem, Excessive Workload, and Interpersonal Relationship—was measured using three items each. The Cronbach’s Alpha values for these factors range from 0.852 to 0.894, all of which are above 0.80, indicating very high internal consistency. When all 12 items were combined into an Overall Scale, the alpha value reached 0.942, which reflects excellent overall reliability.
The concept of correlation was introduced by Francis Galton in the 1880s and later developed into its modern form by Karl Pearson [26]. The Pearson correlation coefficient (r) ranges from -1 to +1, where +1 represents a perfect positive linear association, -1 a perfect negative linear association, and 0 no linear connection. To evaluate practical strength, values above 0.8 indicate a strong positive relationship, 0.3 to 0.6 reflect a moderate positive trend, and 0to 0.3 denote a weak relationship. [27].
Table 4: Pearson Correlation Matrix
|
Sickness |
Family Problem |
Excessive Workload |
Interpersonal Relationship |
|
|
Sickness |
||||
|
Pearson Correlation |
1 |
.720** |
.650** |
.580** |
|
Sig. (2-tailed) |
.000 |
.000 |
.000 |
|
|
N |
310 |
310 |
310 |
310 |
|
Family Problem |
||||
|
Pearson Correlation |
.720** |
1 |
.780** |
.700** |
|
Sig. (2-tailed) |
.000 |
.000 |
.000 |
|
|
N |
310 |
310 |
310 |
310 |
|
Excessive Workload |
||||
|
Pearson Correlation |
.650** |
.780** |
1 |
.810** |
|
Sig. (2-tailed) |
.000 |
.000 |
.000 |
|
|
N |
310 |
310 |
310 |
310 |
|
Interpersonal Relationship |
||||
|
Pearson Correlation |
.580** |
.700** |
.810** |
1 |
|
Sig. (2-tailed) |
.000 |
.000 |
.000 |
|
|
N |
310 |
310 |
310 |
310 |
Correlation is significant at the 0.01 level (2-tailed).
All Pearson correlation coefficients in Table 4 are positive and statistically significant (p < .01), indicating moderate to very strong positive linear relationships among the four variables. The Pearson coefficients range from .580 to .810 suggesting that all studied stressors are positively intercorrelated as showed in Table 4 with the closest linkage being between excessive workload and interpersonal relationship issues.
Statistical applications are also recorded in understanding this outcome. Beta values, t values, and significant p values are mainly investigated in this analysis to manage better delivery outcomes as shown in Table 5. The following table gives the coefficient outcomes at the effective level.
Table 5: Multiple Linear Regression Coefficients
|
Coefficients |
|||||||
|
|
Unstandardized Coefficient |
standardized Coefficient |
t |
Sig. |
Collinearity Statistics |
||
|
|
B |
Std. Error |
Beta |
||||
|
|
Tolerance |
VIF |
|||||
|
Constant |
0.245 |
0.089 |
|
2.753 |
0.006 |
|
|
|
Sickness |
0.324 |
0.045 |
0.298 |
7.2 |
0 |
0.41 |
2.439 |
|
Family Problem |
0.267 |
0.048 |
0.233 |
5.563 |
0 |
0.39 |
2.564 |
|
Excessive Workload |
0.452 |
0.055 |
0.376 |
8.218 |
0 |
0.345 |
2.899 |
|
Interpersonal Relationship |
0.198 |
0.05 |
0.175 |
3.96 |
0 |
0.372 |
2.688 |
|
a. Dependent Variable: Absenteeism |
|||||||
The regression analysis in Table 6 was conducted to examine the influence of four predictors—Sickness, Family Problem, Excessive Workload, and Interpersonal Relationship on Absenteeism. All four variables emerged as significant predictors, with p-values of 0.000 for each, indicating that they all contribute meaningfully to the model. Among them, Excessive Workload had the strongest unique effect on Absenteeism, as shown by its highest standardized beta coefficient (β = 0.376) and largest t-value (8.218). Sickness also showed a considerable impact (β = 0.298), followed by Family Problem (β = 0.233) and Interpersonal Relationship (β = 0.175). The variance inflation factor (VIF) values for all predictors ranged between 2.439 and 2.899, which are within acceptable limits, suggesting that multicollinearity is not a major concern. Overall, these findings support the hypothesis that each of the four stress-related factors significantly predicts absenteeism, with excessive workload being the most dominant contributor.
Table 6: Detailed Coefficients Table with Standard Errors and 95% Confidence Intervals
|
Model |
Unstandardized Coefficients |
Standardized Coefficients |
t |
Sig. |
95% Confidence Interval for B |
|||
|
B |
Std. Error |
Beta |
Lower Bound |
Upper Bound |
|
|||
|
1 |
|
|||||||
|
(Constant) |
0.245 |
0.089 |
2.753 |
0.006 |
0.07 |
0.42 |
|
|
|
Sickness |
0.324 |
0.045 |
0.298 |
7.2 |
0 |
0.235 |
0.413 |
|
|
Family Problem |
0.267 |
0.048 |
0.233 |
5.563 |
0 |
0.173 |
0.361 |
|
|
Excessive Workload |
0.452 |
0.055 |
0.376 |
8.218 |
0 |
0.344 |
0.56 |
|
|
Interpersonal Relationship |
0.198 |
0.05 |
0.175 |
3.96 |
0 |
0.1 |
0.296 |
|
Hypothesis result shown in Table 7.
Table 7: Summary of Hypothesis Testing Results
|
Hypothesis |
Path |
β (Beta) |
t-value |
p-value |
Result |
|
H1 |
Sickness → Absenteeism |
.298 |
7.200 |
.000 |
Supported |
|
H2 |
Family Problem → Absenteeism |
.233 |
5.563 |
.000 |
Supported |
|
H3 |
Excessive Workload → Absenteeism |
.376 |
8.218 |
.000 |
Supported |
|
H4 |
Interpersonal Relationship → Absenteeism |
.175 |
3.960 |
.000 |
Supported |
R Square = 0.612: The model explains 61.2% of the variance in Absenteeism.
F(4, 305) = 121.845, p < .001: The overall model is statistically significant.
Table 8: Individual Predictor Effects
|
Variable |
β |
t |
p |
Interpretation |
|
Sickness |
.298 |
7.200 |
.000 |
A 1 SD increase in Sickness leads to a 0.298 SD increase in Absenteeism, holding other variables constant. |
|
Family Problem |
.233 |
5.563 |
.000 |
A 1 SD increase in Family Problem leads to a 0.233 SD increase in Absenteeism. |
|
Excessive Workload |
.376 |
8.218 |
.000 |
Strongest predictor – a 1 SD increase in Workload leads to a 0.376 SD increase in Absenteeism. |
|
Interpersonal Relationship |
.175 |
3.960 |
.000 |
A 1 SD increase in Relationship issues leads to a 0.175 SD increase in Absenteeism. |
A multiple linear regression was conducted to predict Absenteeism from Sickness, Family Problem, Excessive Workload, and Interpersonal Relationship. The model was statistically significant, F (4, 305) = 121.845, p < .001, and explained 61.2% of the variance in Absenteeism (R² = .612).
Excessive Workload was the strongest predictor of Absenteeism (β = .376, t = 8.218, p < .001), followed by Sickness (β = .298, t = 7.200, p < .001), Family Problem (β = .233, t = 5.563, p < .001), and Interpersonal Relationship (β = .175, t = 3.960, p < .001). All predictors were statistically significant at the p < .001 level as sown in Table 8.
Predicted Absenteeism = 0.245 + 0.324(Sickness) + 0.267(Family Problem) + 0.452(Excessive Workload) + 0.198(Interpersonal Relationship)
This equation provides a quantitative tool for estimating employee absenteeism based on the four predictor variables. The constant term (0.245) represents the baseline level of absenteeism when all predictor variables are held at zero. Each coefficient attached to a predictor indicates the expected change in absenteeism for a one-unit increase in that particular variable, while keeping all other variables constant
Model Summary
a. Predictors: (Constant), Sickness, Family Problem, Excessive Workload, Interpersonal Relationship
b. Dependent Variable: Absenteeism
Table 9: Model Fit Summary
|
Model |
R |
R Square |
Adjusted R Square |
Std. Error of the Estimate |
Change Statistics |
Durbin-Watson |
||||
|
R Square Change |
F Change |
df1 |
df2 |
Sig. F Change |
||||||
|
1 |
.782a |
.612 |
.607 |
.48500 |
.612 |
121.845 |
4 |
305 |
.000 |
1.892 |
The model summary in Table 9 confirms a strong positive relationship between the four predictors and employee absenteeism (R = 0.782). The regression model accounts for 61.2% of the variance in absenteeism (R2 = 0.612, Adjusted R2 = 0.607), with a low standard error of estimate (0.485). Statistical significance was confirmed, F (4, 305) = 121.845, p < .001$, while a Durbin-Watson statistic of 1.892 indicates no significant residual autocorrelation.
ANOVA (Analysis of Variance) tests in Table 10 is significant mean differences across three or more groups simultaneously. Unlike standard t-tests, which are restricted to two-group comparisons, ANOVA evaluates multiple cohorts at once to protect against Type I error inflation.
a. Dependent Variable: Absenteeism
b. Predictors: (Constant), Sickness, Family Problem, Excessive Workload, Interpersonal Relationship
Table 10: ANOVA Test of Regression Model
|
Model |
Sum of Squares |
df |
Mean Square |
F |
Sig. |
|
1 |
|||||
|
Regression |
114.567 |
4 |
28.642 |
121.845 |
.000b |
|
Residual |
71.689 |
305 |
.235 |
||
|
Total |
186.256 |
309 |
Reliability testing confirmed scale internal consistency, with Cronbach’s alpha exceeding the 0.6 threshold across all items. Additionally, bivariate associations among constructs were evaluated using the Pearson correlation coefficient.
The regression analysis supported this hypothesis H1: sickness has a significant positive relationship with Absenteeism with β = .298, t = 7.200, p < .001. This finding indicates that employees who experience higher levels of sickness are more likely to be absent from work. The positive relationship suggests that health-related issues serve as a critical predictor of absenteeism. This finding aligns with previous research by Darr and Johns found a strong association between poor physical health and increased workplace absenteeism [28].
The results supported this hypothesis H2: Family Problem has a significant positive relationship with Absenteeism (β = .233, t = 5.563, p < .001). Employees facing family problems—such as marital conflict, childcare responsibilities, eldercare duties, or financial stress at home—demonstrated higher levels of absenteeism. This finding supports work-family conflict theory by Greenhaus & Beutell has posited that competing demands from work and family roles create stress that can affect work outcomes. When family problems arise, employees may need to take time off to address domestic issues, care for family members, or manage personal crises. This results in increased absenteeism [29].
The data strongly supported this hypothesis H3: Excessive Workload has a significant positive relationship with Absenteeism with β = .376, t = 8.218, p < .001. Excessive Workload emerged as the strongest predictor of Absenteeism among all four variables, accounting for the largest unique variance.
This finding indicates that employees who perceive their workload as excessive and unmanageable are significantly more likely to be absent from work.
The analysis supported this hypothesis H4: Interpersonal Relationship has a significant positive relationship with Absenteeism with β = .175, t = 3.960, p < .001). Employees who reported more interpersonal relationship problems—including conflicts with colleagues, lack of social support, or poor workplace relationships—tended to have higher levels of absenteeism.
The study adhered strictly to ethical standards established by Sterling Denims Ltd., obtaining formal approval prior to commencement with endorsement from institutional ethics committee member and author Md. Taslim. All participants provided voluntary informed consent, and strict confidentiality protocols were maintained throughout the research process to protect their privacy and anonymity.
This study investigated key drivers of absenteeism among 310 sewing machine operators at Sterling Denims Ltd. in Bangladesh's RMG sector. Multiple regression analysis showed that four variables—excessive workload, illness, family challenges, and interpersonal issues—collectively explained 61.2% of the variance in absenteeism. Excessive workload was the strongest predictor, indicating that organizational demands influence worker attendance more heavily than personal or social factors.
By applying frameworks like the Job Demands-Resources model and work-family conflict theory to the RMG context, this research offers both theoretical insights and empirical data for factory management. Ultimately, worker absenteeism stems from interconnected health, domestic, and job-related stressors; mitigating it requires an integrated approach that balances manufacturing targets with comprehensive workforce well-being.
To curb operator absenteeism, RMG factory management must prioritize equitable workload distribution, establish workplace health programs, and implement family-supportive initiatives like flexible schedules or on-site childcare. Building a supportive work culture through clear communication and structured monitoring policies is equally crucial. Furthermore, industry associations like BGMEA should establish sector-wide standards and promote best practices across manufacturing units. While future research should examine additional predictors through longitudinal studies, adopting these integrated measures will immediately boost employee well-being, reduce non-attendance, and strengthen overall operational productivity.
The datasets that underpin the findings of this study can be obtained from the corresponding author upon a reasonable request. All experimental resources, such as reagents and software, are detailed in the supplementary materials provided alongside this paper. Inquiries regarding data access should be directed to Mohammad Tanvirul Hasnat. (Corresponding author) by email: tanvirulhasnat397@gmail.com
Acknowledgments
The study strictly followed Sterling Denims Ltd.’s ethical guidelines, receiving formal institutional approval co-endorsed by ethics committee member Md. Taslim. Participants gave voluntary informed consent, with complete anonymity and confidentiality guaranteed throughout the investigation.
Funding Information
All financial support was received for this study was contributed by the two authors of this paper equally. The authors declare no competing interests
Author Contributions Statement
|
Name of Author |
C |
M |
So |
Va |
Fo |
I |
R |
D |
O |
E |
Vi |
Su |
P |
Fu |
|
Md. Taslim |
ü |
ü |
ü |
ü |
|
ü |
|
ü |
ü |
ü |
ü |
|
|
|
|
Mohammad Tanvirul Hasnat |
ü |
ü |
|
|
|
ü |
ü |
ü |
|
|
ü |
ü |
ü |
|
|
C : Conceptualization M : Methodology So : Software Va : Validation Fo : Formal analysis |
I : Investigation R : Resources D : Data Curation O : Writing - Original Draft E : Writing - Review & Editing |
Vi : Visualization Su : Supervision P : Project administration Fu : Funding acquisition
|
Mohammad Tanvirul Hasnat (Corresponding Author): Conceptualization, Operationalization, Hypothesis development, methodology, and supervision of the study. Led data analysis and wrote the original draft. Conducted literature review and contributed to the writing of the introduction and discussion sections. Provided critical feedback on the manuscript.
Md. Taslim (Author): Conducted data collection and management, and contributed to the interpretation of results. Assisted in drafting and revising the manuscript.
Conflict Of Interest Statement
The authors declare that they have no financial conflicts of interest related to this research. However, corresponding author and co-author are the employee of the organization from where the sample data has been congregated.
Informed Consent
Privacy protection is a strict legal right requiring explicit individual authorization. When including identifiable personal information is scientifically necessary, researchers must secure and document full written informed consent from participants prior to study enrollment.
Ethical Approval
There was no involvement of using people or animals, & the research followed all national rules and institutional policies, and it was approved by affiliated organizations of the authors.
Data Availability
Data supporting the conclusions of this article are available from the authors upon reasonable request. The materials used in the experiments, including reagents and software tools, can be found in the supplementary files attached to this publication. For any request for data please contact Mohammad Tanvirul Hasnat (Corresponding Author) at tanvirulhasnat397@gmail.com



Open Access By Aditum Open Access Journals id licensed under Creative Commons Attribution 4.0 International License. Based On a Work at aditum.org


