
International Journal of Business Research and Management
OPEN ACCESS | Volume 5 - Issue 2 - 2026
ISSN No: 3065-6753 | Journal DOI: 10.61148/3065-6753/IJBRM


Asst. Prof. Mehmet Çağrı Kızıltaş1*, Asst.Prof. Ömer Faruk Kültür2
1Department of Civil Engineering, Faculty of Engineering and Architecture, Istanbul Beykent University.
2Department of Civil Engineering, Faculty of Engineering, Istanbul University Cerrahpaşa.
*Corresponding Author: Asst. Prof. Mehmet Çağrı Kızıltaş, Department of Civil Engineering, Faculty of Engineering and Architecture, Istanbul Beykent University.
Received: September 30, 2026 | Accepted: October 05, 2026 | Published: October 09, 2026
Citation: Mehmet Ç Kızıltaş, Ömer F Kültür., (2026). “An Analysis of Metropolization and High-Capacity Transportation of Brazil Via Clustering Methods”. International Journal of Business Research and Management 5(3); DOI: 10.61148/3065-6753/IJBRM/105.
Copyright: © 2026. Mehmet Çağrı Kızıltaş. This is an open access article distributed under the Creative Commons Attribution License, which permits unrestricted use, distribution, and reproduction in any medium, provided the original work is properly cited.
High capacity and advanced technology mobility is one of the most vital parameter of transportation on today’s case. It is a transport choice that produces mobility among cities and settlement clusters within high speed, high capacity, and high volume. This transport way has a crucial role for tourism centers and settlements too. It is an effective way of sustainable mobility engineering that enhances intercity and inter regional scale tourism systematics. It is also an important dynamic for advancement of nationalities. In this paper, a cluster-based analysis was made for Central East Africa by usage of population and related parameters via clustering mathematical connections. Recommendations were given by considering the competitive operation intervals of high capacity transportation between specified clustering cities and lastly results were given on this context.
Clustering analysis, urban, high speed, tourism, economy
Transportation is at the heart of development, attracting tourism, social activity, economic growth, and cultural relations. Transportation services increase the emphasis on tourism travel at city, regional, national, and international levels. Today, tourism is one of the main pillars of economic development for countries. Multi-sectoral improvement is a challenging issue, especially for developing countries. And the mentioned countries strengthen their core sectors such as construction, healthcare, tourism, heavy industry, infrastructure, energy, military, or light industry. The driving force behind tourism is a well-developed transportation system. High-speed systerms and well planned urban clusterings are important asset, capacity, and opportunity for national based tourism.
Cental East Afirca is a very large region. They have a vaat naturel integration between them in terms of their culture and same/similar ethnolenguistic base. Swahili language is same for a very large Population on Congo, Republic of Congo, Kenya, Somalia, Tanzania, Uganda, Ethiopia, Burundi and Zambia. Also this region has the highest fertility rates and population increase rates all over the World. Besides all of these, young population is very high and the region has very big, important and high populated urban clusters like Mombasa, Kinshasa, Mogadishu, Timbuktu, Dar es Salaam, Zanzibar, Nairobi, Kampala and Entebbe.
These are also Worldwide important cities too. So, because of all of these reasons and conditions the integration and unity of the region has a strategic point of view. And also it is strongly related to infrastructural balanced development. And all of these have closer connections with energy and geography. Finally urbanization and mobilization trends measuring and analysis will be determinant for all of these conditions. These two parameters has a strong, robust, reliable and rational bound with high speed, high capacity and high comfort mobility. High-speed system network proposal developed in this way will integrate East Africa more quickly with each other and neighbouring countries too. Within the scope of this study, the provinces of Central East Africa were listed according to parameters such as population, gross domestic product, and level of development, and were subjected to cluster analysis using statistical methods in the R Studio program. In this context, priority cities were determined by considering the number of clusters and cluster lists that emerged based on the most suitable clustering method. The aforementioned priority cities were evaluated based on distance, ultimately leading to a high-speed network system proposal for region.
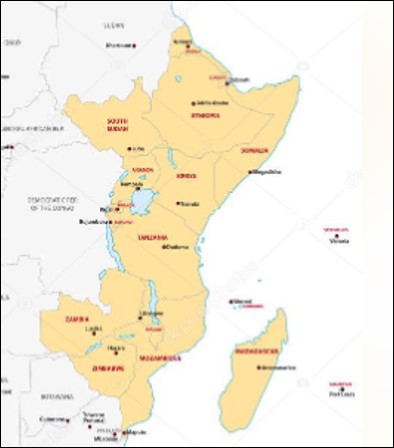
Fig. 1. Big Urbans of Central East Africa (Deposit Photo, 2025)
In Figure 2 region’s state map is presented (Arthipo, 2025). Figure 3 shows region’s Geographical Map (Milliyet Eğitim, 2025). Table 1 shows region’s cities’ populations and livabilities (OECD, 2020).
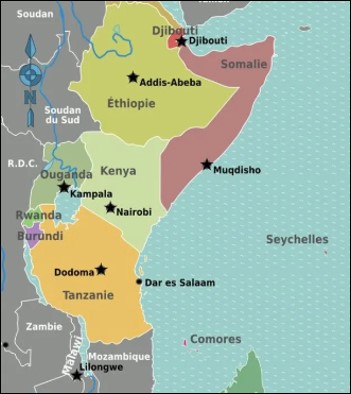
Fig. 2. Central East Africa State Map (Arthipo, 2025)
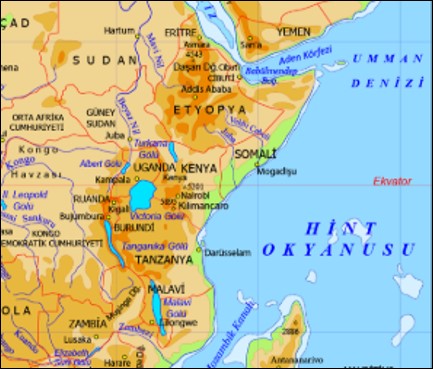
Fig. 3. Central East Africa Geographical Map (Milliyet Eğitim, 2025)
Table 1: Central East Africa Cities Populations And Liveavilities (Oecd, 2020)
|
City |
Liveability |
Population |
|
Kinshasa |
32 |
11900000 |
|
Bukavu |
22 |
871000 |
|
Lubumbashi |
22 |
1790000 |
|
Mbuji-Mayi |
21 |
1560000 |
|
Kananga |
20 |
1970000 |
|
Kisangani |
20 |
936000 |
|
Uvira |
19 |
590000 |
|
Kolwezi |
19 |
573000 |
|
Mbandaka |
19 |
1190000 |
|
Tshikapa |
18 |
732000 |
|
Likasi |
18 |
423000 |
|
Matadi |
18 |
306000 |
|
Mbanza-Ngungu |
18 |
100000 |
|
Bunia |
18 |
328000 |
|
Boma |
17 |
163000 |
|
Mwene-Ditu |
17 |
196000 |
|
Gandajika |
17 |
146000 |
|
Isiro |
17 |
183000 |
|
Kikwit |
17 |
187000 |
|
Kalemie |
17 |
147000 |
|
Kindu |
17 |
172000 |
|
Beni |
17 |
232000 |
|
Butembo |
16 |
218000 |
|
Gemena |
15 |
139000 |
|
Bumba |
15 |
103000 |
|
Brazzaville |
25 |
1830000 |
|
Pointe-Noire |
20 |
829000 |
|
Kinkala |
16 |
16100 |
|
Kayes |
15 |
62500 |
|
Madingou |
14 |
27500 |
|
Gamboma |
13 |
19700 |
|
Nairobi |
60 |
5550000 |
|
Thika |
42 |
279000 |
|
Machakos |
36 |
114000 |
|
Meru |
34 |
1830000 |
|
Mombasa |
33 |
1200000 |
|
Kisumu |
32 |
410000 |
|
Nakuru |
32 |
308000 |
|
Eldoret |
32 |
194000 |
|
Mumias |
29 |
100000 |
|
Malindi |
25 |
120000 |
|
Luanda |
41 |
2490000 |
|
Benguela |
40 |
562000 |
|
Ambriz |
40 |
17000 |
|
Huembo |
39 |
844000 |
|
Lobito |
39 |
393000 |
|
Cabinda |
38 |
739000 |
|
Luena |
37 |
357000 |
|
N'zeto |
35 |
47800 |
|
Kampala |
47 |
1680000 |
|
Entebbe |
28 |
70000 |
|
Kira Town |
28 |
317000 |
|
Jinja |
22 |
72900 |
|
Gulu |
19 |
152000 |
|
Mbale |
19 |
96200 |
|
Tororo |
18 |
41900 |
|
Arua |
16 |
62000 |
|
Kasese |
14 |
115000 |
|
Dar es Salaam |
56 |
4720000 |
|
Zanzibar |
34 |
206000 |
|
Stone Town |
31 |
18000 |
|
Morogoro |
29 |
207000 |
|
Arusha |
27 |
416000 |
|
Dodoma |
27 |
214000 |
|
Moshi |
26 |
145000 |
|
Tanga |
25 |
244000 |
|
Mbeya |
25 |
292000 |
|
Mwanza |
23 |
386000 |
|
Mogadishu |
17 |
2120000 |
|
Baidoa |
11 |
950000 |
|
Hargeisa |
11 |
760000 |
|
Borama |
8 |
68100 |
|
Lusaka |
37 |
2470000 |
|
Kitwe |
26 |
504000 |
|
Ndola |
26 |
528000 |
|
Chingola |
24 |
147000 |
|
Kapiri Mposhi |
24 |
241000 |
|
Mufulira |
23 |
122000 |
|
Kasama |
22 |
168000 |
|
Choma |
22 |
122000 |
|
Mansa |
22 |
129000 |
|
Bangui |
9 |
889000 |
|
Berberati |
5 |
76900 |
|
Bria |
3 |
35200 |
2. Literature Review
In the 21st century, in addition to urbanization, digitalization and sustainability also seem to be at the forefront. What strengthens the trend of digitalization is a continuous and uninterrupted process of technological development and innovation. This has created a constant dynamic of change in our lives. Transportation and urbanization have been and will continue to be affected by this dynamic.
Sustainability trends have strengthened even further today. Western countries and developed countries have a role to play in this regard. In this context, sustainability, digitalization, and urbanization indicate that more investment should be made in high-speed train lines, metro lines, and high-capacity high-speed bus lines. These three systems could be the initial driving force for autonomous transportation systems in developing countries. As a developed country in this context, the spread of well-planned metropolization and high standard transportation in Italy is an important saving. At the center of all of this, there are well planning, detailed analysis and true approaches (Givoni, 2006).
3. Methodology
Clustering Analysis
Clustering statistical analysis have been conducted via K means method, PAM and Clara method.
Here are results for number of clusters and cluster visulation in terms of K means method in Figure 4 and Figure 5.
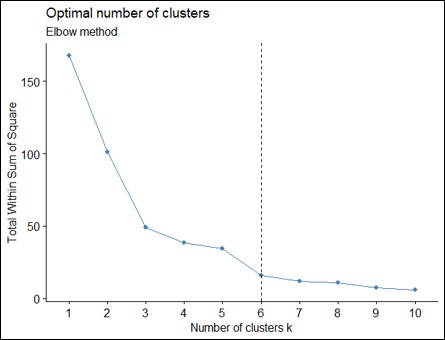
Fig. 4. Number of Clusters in Terms of K Means Method
Cluster Visulation
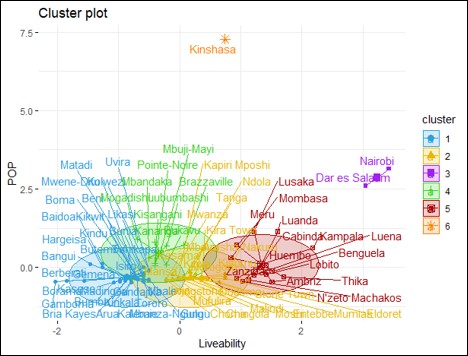
Fig. 5. Cluster Visulation in Terms of K Means Method
Here are results for number of clusters and cluster visulation in terms of PAM in Figure 6 and Figure 7.
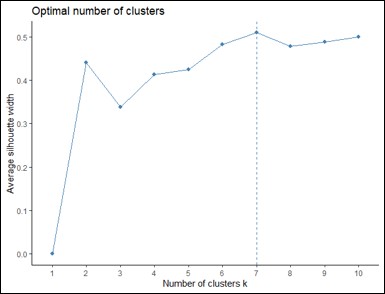
Fig. 6. Number of Clusters in Terms of PAM
Cluster Visulation
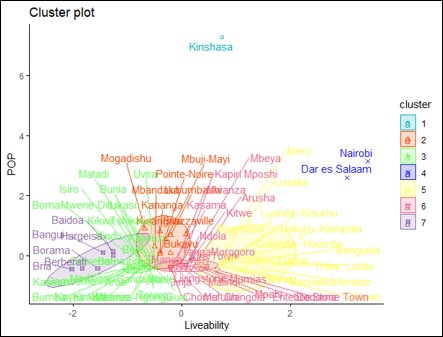
Fig. 7. Cluster Visulation in Terms of PAM
Here are results for number of clusters and cluster visulation in terms of Clara method in Figure 8 and Figure 9.
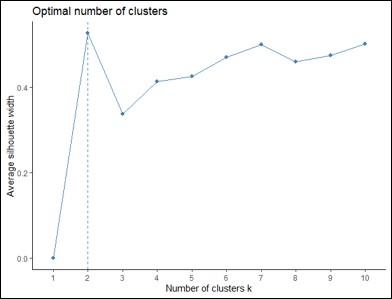
Fig. 8. Number of Clusters in Terms of Clara Method
Cluster Visulation
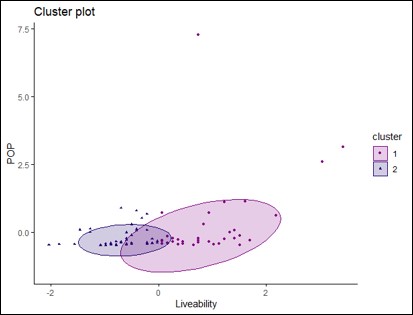
Fig. 9. Cluster Visulation in Terms of Clara Method
As a result of all methods and agglomerations, the biggest cities has been emerged into two clusters, 4 main clusters has emerged for these dataset. On Table 2, clustering list of the cities has been given.
Table 2: Cluster List Of Central East African Cities
|
City |
Liveability |
Cluster |
|
Kinshasa |
32 |
6 |
|
Bukavu |
22 |
4 |
|
Lubumbashi |
22 |
4 |
|
Mbuji-Mayi |
21 |
4 |
|
Kananga |
20 |
4 |
|
Kisangani |
20 |
4 |
|
Uvira |
19 |
1 |
|
Kolwezi |
19 |
1 |
|
Mbandaka |
19 |
1 |
|
Tshikapa |
18 |
1 |
|
Likasi |
18 |
1 |
|
Matadi |
18 |
1 |
|
Mbanza-Ngungu |
18 |
1 |
|
Bunia |
18 |
1 |
|
Boma |
17 |
1 |
|
Mwene-Ditu |
17 |
1 |
|
Gandajika |
17 |
1 |
|
Isiro |
17 |
1 |
|
Kikwit |
17 |
1 |
|
Kalemie |
17 |
1 |
|
Kindu |
17 |
1 |
|
Beni |
17 |
1 |
|
Butembo |
16 |
1 |
|
Gemena |
15 |
1 |
|
Bumba |
15 |
1 |
|
Brazzaville |
25 |
4 |
|
Pointe-Noire |
20 |
4 |
|
Kinkala |
16 |
1 |
|
Kayes |
15 |
1 |
|
Madingou |
14 |
1 |
|
Gamboma |
13 |
1 |
|
Nairobi |
60 |
3 |
|
Thika |
42 |
5 |
|
Machakos |
36 |
5 |
|
Meru |
34 |
5 |
|
Mombasa |
33 |
5 |
|
Kisumu |
32 |
2 |
|
Nakuru |
32 |
2 |
|
Eldoret |
32 |
2 |
|
Mumias |
29 |
2 |
|
Malindi |
25 |
2 |
|
Luanda |
41 |
5 |
|
Benguela |
40 |
5 |
|
Ambriz |
40 |
5 |
|
Huembo |
39 |
5 |
|
Lobito |
39 |
5 |
|
Cabinda |
38 |
5 |
|
Luena |
37 |
5 |
|
N'zeto |
35 |
5 |
|
Kampala |
47 |
5 |
|
Entebbe |
28 |
2 |
|
Kira Town |
28 |
2 |
|
Jinja |
22 |
2 |
|
Gulu |
19 |
1 |
|
Mbale |
19 |
1 |
|
Tororo |
18 |
1 |
|
Arua |
16 |
1 |
|
Kasese |
14 |
1 |
|
Dar es Salaam |
56 |
3 |
|
Zanzibar |
34 |
5 |
|
Stone Town |
31 |
2 |
|
Morogoro |
29 |
2 |
|
Arusha |
27 |
2 |
|
Dodoma |
27 |
2 |
|
Moshi |
26 |
2 |
|
Tanga |
25 |
2 |
|
Mbeya |
25 |
2 |
|
Mwanza |
23 |
2 |
|
Mogadishu |
17 |
4 |
|
Baidoa |
11 |
1 |
|
Hargeisa |
11 |
1 |
|
Borama |
8 |
1 |
|
Lusaka |
37 |
5 |
|
Kitwe |
26 |
2 |
|
Ndola |
26 |
2 |
|
Chingola |
24 |
2 |
|
Kapiri Mposhi |
24 |
2 |
|
Mufulira |
23 |
2 |
|
Kasama |
22 |
2 |
|
Choma |
22 |
2 |
|
Mansa |
22 |
2 |
|
Bangui |
9 |
1 |
|
Berberati |
5 |
1 |
|
Bria |
3 |
1 |
4. Results
After statistical analysis, prior urbans were gathered on 6, 3 and 5 no clusters’ urbans. On Table 3 selected cities are listed below.
Table 3. Selected cities via clustering analyse
|
City |
Liveability |
Cluster |
Country |
|
Kinshasa |
32 |
6 |
Dem. Rep. Congo |
|
Nairobi |
60 |
3 |
Kenya |
|
Thika |
42 |
5 |
Kenya |
|
Machakos |
36 |
5 |
Kenya |
|
Meru |
34 |
5 |
Kenya |
|
Mombasa |
33 |
5 |
Kenya |
|
Luanda |
41 |
5 |
Angola |
|
Benguela |
40 |
5 |
Angola |
|
Ambriz |
40 |
5 |
Angola |
|
Huembo |
39 |
5 |
Angola |
|
Lobito |
39 |
5 |
Angola |
|
Cabinda |
38 |
5 |
Angola |
|
Luena |
37 |
5 |
Angola |
|
N'zeto |
35 |
5 |
Angola |
|
Kampala |
47 |
5 |
Uganda |
|
Dar es Salaam |
56 |
3 |
Tanzania |
|
Zanzibar |
34 |
5 |
Tanzania |
|
Lusaka |
37 |
5 |
Zambia |
The cities and urban areas selected above are regions that exhibit region’s highest level of metropolitanization and have the trend of producing the most life expectancy and motion. Rely on to the important role, these urbans are going to play a significant role on region’s economic, cultural, technic, national safety and wealth and Social aspects in mid term future period. Also a high speed and high capacity mobility network occurance is crucial and a priority for this region’s countries to be unit, integrated and advanced.
Sustainability, urbanization, and digitalization are among the mobility phenomena of the 21st century. These phenomena can best take place in developed countries. Central Africa must take significant steps regarding these mobility phenomena. Central Africa still constitutes one of the most important centers in the world. Sustainable transportation, reducing traffic congestion, increasing traffic safety, decreasing noise and air pollution, expanding railway investments, advancing autonomous vehicle technologies, equipping infrastructure facilities with current advanced technologies, and the integrated renewal of cities are the most important aspects of modern transportation and urbanization (Kiziltas, 2020).
Along with emerging technology, there are many alternative modes of transportation that provide high-quality service at high inter-city speeds. These can be classified as magnetically driven trains (Maglev), high-speed trains, airlines, high-comfort road transport. These modes of transport are highly competitive in cross-city travel, but their interconnections are combined or isolated accordingly.
These modes of transportation involve the priority, integration or substitution of cities according to their size, human characteristics, demand for transportation, urban features, interconnected spatial and technical locations, requirements, distances between cities and a number of fundamental parameters. Among the various cities in Western Europe, this is the case with high-speed trains and airlines (Marta et al, 2010).
5. Discussion And Conclusions
In this context, Figure 10 shows metropolization map of Central East Africa.
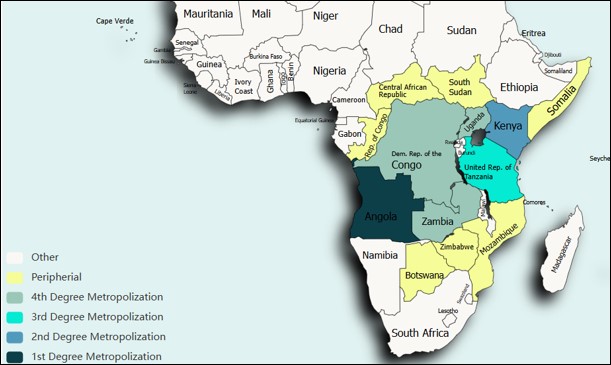
Fig. 10. Central East Africa Metropolization Map (Dark Legend: The highest metropolization)
As shown in the map, the cities proposed as a result of deep analysis on this paper are cumulated mainly on south west and mid-south part of the region which are also include most central and densely populated areas of Central East Africa. When these areas are equipped a reliable regional planning perspective and high standard mobility services according to national principles, a regional metropolization unique map will emerge that trigger international integration of east Africa, central Africa and west Africa. On the other hand, with the completion of all the proposed planning and execution, a big integration will occur on south of continent, center of continent and north of continent too. Due to the region’s wide geography, the extension of the proposal clusters will accelerate a variety of various strategic dynamics.



Open Access By Aditum Open Access Journals id licensed under Creative Commons Attribution 4.0 International License. Based On a Work at aditum.org


