
International Journal of Business Research and Management
OPEN ACCESS | Volume 5 - Issue 2 - 2026
ISSN No: 3065-6753 | Journal DOI: 10.61148/3065-6753/IJBRM


Mehmet Çağrı Kızıltaş1*, Ömer Faruk Kültür2
1Department of Civil Engineering, Faculty of Engineering and Architecture, Istanbul Beykent University.
2Department of Civil Engineering, Faculty of Engineering, Istanbul University Cerrahpaşa.
Corresponding Author: Mehmet Çağrı Kızıltaş, Department of Civil Engineering, Faculty of Engineering and Architecture, Istanbul Beykent University.
Received: September 15, 2026 | Accepted: September 26, 2026 | Published: October 02, 2026
Citation: Mehmet Ç Kızıltaş, Ömer F Kültür., (2026). “Data-Driven Cluster Analysis for High-Speed Transportation Network Planning in the Nigeria-Centered Region”. International Journal of Business Research and Management 5(2); DOI: 10.61148/3065-6753/IJBRM/102.
Copyright: © 2026. Mehmet Çağrı Kızıltaş. This is an open access article distributed under the Creative Commons Attribution License, which permits unrestricted use, distribution, and reproduction in any medium, provided the original work is properly cited.
High-speed mobility is an important dynamic of new century transport that ensures high-speed, high-capacity and high-comfort transportation across high densely populated cities. Beyond its operational supports, the high speed transport has a strategic role in increasing of regional attraction and developing sustainable mobility mentality. Also, it has an important position for emphases of socio-economic advancement in developing economies. The main objective of this study is giving a network proposal idea about innovative infrastructural design in terms of robust clustering analysis. PAM, Clara and K means are main statistical methods which are used on this study via R Studio Program. PAM is portioning around medoids method and CLARA is clustering large applications method. K means is a widely used clustering method in terms of Euclidean distance metrics. This study shares a cluster-essential analysis that focus to Nigeria centered region that has not yet applied a high-speed transportation and is has developmental dynamics. Clustering methods were applied to designate ideal potential clustering metropolization for high-speed mobility, with usage of key indicators like population and other socioeconomic dynamics. Based on the competitive distances for urbanization and integration, proposals about connections between clusters were shared. The findings ensure practical solutions and opinions to inform future infrastructure plans and projections under conditions that related to sustainable mobility in Nigeria and its periphery.
Clustering analysis, urban, high speed, tourism, economy
I. Introduction
Transportation plays a central role in driving development by facilitating tourism, strengthening social connections, boosting economic growth, and promoting cultural exchange. Efficient transportation systems increase tourism activities at local, regional, national, and international levels. In today's global economy, tourism has become a vital pillar of economic development, especially for developing countries where multi-sectoral progress poses significant challenges. These countries often prioritize strengthening key sectors such as construction, healthcare, tourism, and heavy industry.
Nigeria is at the center of its region. It is surrounded by Niger, Chad, Cameroon, Benin, Mali, Ghana, Burkina Faso, Togo, Equatorial Guinea, and Gabon. Most of these countries have populations ranging from 20 to 35 million, with Ghana and Cameroon being the largest. Niger, Chad, and Mali, on the other hand, cover vast areas. Nigeria has a very high population density and is a cornerstone of West Africa. The region in question, based in Nigeria, is a socio-economic summary of West Africa. The integration of this region is of great importance for the political, social, infrastructural, cultural, and geographical future of West Africa. In the future, this region will be populated with a focus on Nigeria. This region also includes the Berber-Sub-Saharan transition regime in the north. In this study, high-speed transportation and urbanization trends were attempted to be measured for the region's integration. Within this framework, major and important cities in Nigeria and other regional countries are listed according to population and livability index. Subsequently, they were subjected to classification analysis in the R Studio program according to various statistical analysis methods. Subsequently, the most suitable class numbers and distributions that emerged were selected. Then, classes were determined based on the appropriate number of classrooms, and the priority class was identified. The cities included in this class have been listed, and high-speed mobility and metropolitan trends have been analyzed and interpreted, taking distance into account. In this context, the results and recommendations have been presented.
Figure 1 illustrates the major urban centers of Nigeria, providing a spatial reference for understanding the country's infrastructural and demographic distribution, which is pertinent to planning high-speed rail networks.
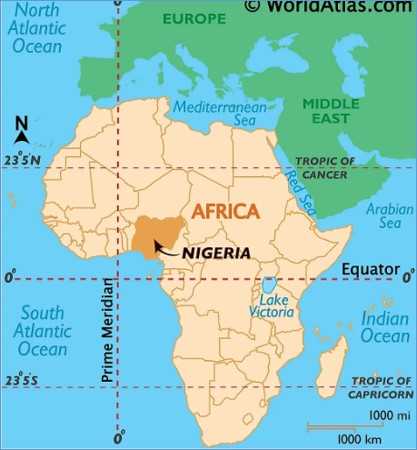
Fig. 1. Nigeria Centered Region (World Atlas Nigeria, 2025)
Due to its location, Nigeria is among the largest and most important countries in Africa and the world. With a population of 238,424,674 (Worldometer, 2025), high population density and growth rate, rich underground resources, industrialization trends, a large young population, sporting achievements, and a land area of 923,768 km2, the country is a significant player in the region. It is the largest country in Africa by population and the 6th largest country in the world. It is also the 14th largest country in Africa and the 31st largest in the world by land area.
The big urbans of Nigeria centered region are outlined below on Fig 2 (Nations Online, 2025), while Fig 3 provides a geographical map illustrating the region's topographic features (Uydu Harita, 2025). Table 1 displays population data for region’s major cities and their livability indexes (OECD, 2020).
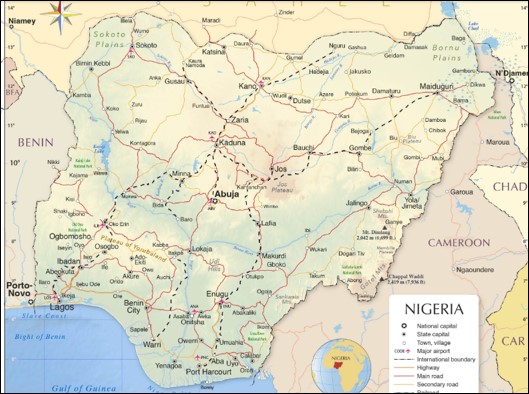
Fig. 2. Nigeria Centered Region Big Urbans (Nations Online, 2025)
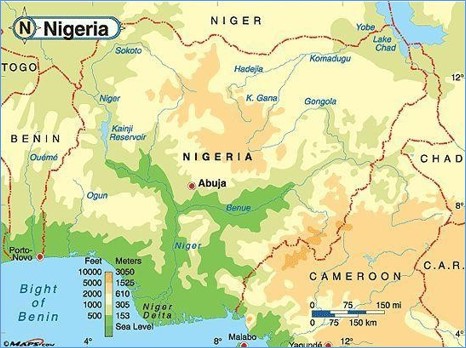
Fig. 3. Nigeria Centered Region Geographical Map (Uydu Harita, 2025)
TABLE 1: Nigerian Centered Region’s Cities Populations And Liveabilities (Oecd, 2020)
|
City |
Liveability |
Population |
|
Lagos |
40 |
14900000 |
|
Abuja |
35 |
1570000 |
|
Ibadan |
21 |
2550000 |
|
Ife |
17 |
502000 |
|
Abeokuta |
17 |
889000 |
|
Akure |
16 |
848000 |
|
Ado Ekiti |
16 |
447000 |
|
Oyo |
16 |
387000 |
|
Osogbo |
15 |
396000 |
|
Benin |
15 |
1150000 |
|
Ilorin |
14 |
848000 |
|
Kano |
14 |
3850000 |
|
Onitsha |
14 |
1480000 |
|
Enugu |
14 |
716000 |
|
Port Harcourt |
13 |
1010000 |
|
Owo |
13 |
222000 |
|
Aba |
13 |
1160000 |
|
Awka |
12 |
302000 |
|
Kaduna |
12 |
760000 |
|
Umuahia |
12 |
359000 |
|
Calabar |
12 |
371000 |
|
Minna |
11 |
322000 |
|
Owerri |
11 |
908000 |
|
Zaria |
10 |
408000 |
|
Sokoto |
10 |
428000 |
|
Bauchi |
10 |
694000 |
|
Jos |
9 |
623000 |
|
Warri |
9 |
363000 |
|
Katsina |
9 |
318000 |
|
Gusau |
8 |
383000 |
|
Maiduguri |
7 |
1200000 |
|
Mubi |
3 |
129000 |
|
Damaturu |
3 |
88000 |
|
Niamey |
22 |
1030000 |
|
Maradi |
14 |
267000 |
|
Zinder |
13 |
236000 |
|
Douala |
35 |
2770000 |
|
Yaounde |
27 |
2440000 |
|
Bafoussam |
23 |
600000 |
|
Bamenda |
22 |
270000 |
|
Buea |
20 |
131000 |
|
Garoua |
19 |
1750000 |
|
Kumba |
19 |
144000 |
|
Limbe |
18 |
84200 |
|
Ngaoundere |
18 |
190000 |
|
Maroua |
16 |
201000 |
The implementation of an effective high-speed transportation system on the region holds transformative potential for mid-west Africa transportation—particularly for enhancing mobility along the central segment of the Africa. Such a development would not only enhance the region’s internal connectivity but also catalyze broader Central African integration by improving cultural, political, and economic linkages through Central and East Africa.
II. Literature Review
In the 21st century, three dominant global trends – urbanization, digitalization, and sustainability – are redefining the framework within which transportation systems are planned and developed. Transportation serves as a central hub for integrating these movements, enabling efficient connectivity while supporting broader policy goals related to climate, economic resilience, and social inclusion.
Simultaneously, digitalization, driven by rapid technological advancements and continuous innovation, has introduced new paradigms in the functioning of cities and transportation systems. Digital transformation has led to the emergence of real-time data integration, automation, and smart mobility solutions, all of which have changed traditional transportation planning frameworks.
In this context, rail systems, especially high-speed trains, offer a viable and effective solution by providing long-term benefits in terms of capacity, efficiency, and sustainability (Givoni, 2006).
III. Methodology
Cluster Analysis
To identify potential high-speed rail corridors and regional connectivity patterns across Nigeria, a multivariate cluster analysis was performed using several established statistical clustering techniques. Specifically, the K-Means, Partitioning Around Medoids (PAM), and Clustering Large Applications (CLARA) methods were applied to a dataset comprising demographic and economic indicators such as population and gross domestic product (GDP).
Euclidean distance metric was used and there is no normalization process except R Studio program’s random process.
K means is a general and useful clustering method for nearly all data types. PAM is a very specific spatial statistical limited data method. Clara is used for big data and understanding the clustering limitations for related data with a precise way. At this analysis, data has a general amount so K means gives the cluster number as 4. Because of all of these, cluster number of 4 is a good selection for a good and robust analysis.
Figure 4: Correlation Matrice of Nigeria Centered Region Cities
1. K-Means Clustering
K-Means clustering, a centroid-based iterative partitioning method, was applied to determine optimal groupings of Nigerian cities based on their economic and demographic characteristics. The analysis aimed to minimize intra-cluster variance. The results for the optimal number of clusters and their visual distribution are shown in:
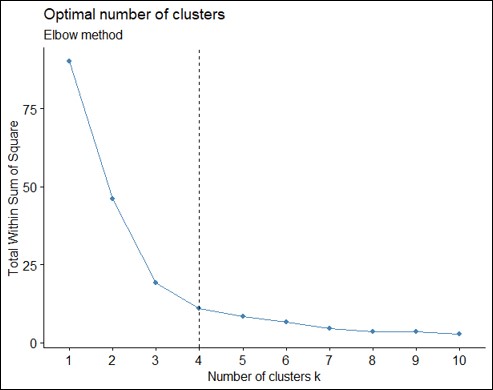
Figure 5: Optimal Number of Clusters (K-Means)
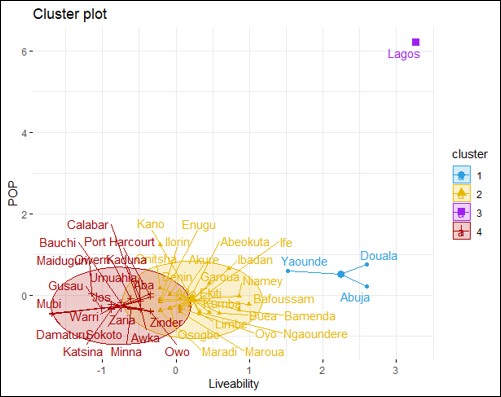
Figure 6: Cluster Visualization using K-Means
2. Partitioning Around Medoids (PAM)
PAM clustering, known for its robustness to outliers, was employed as a comparative method to validate the stability and interpretability of the K-Means results. This technique choices representative data points (medoids) to minimize dissimilarities within the clusterings. The outputs are presented below:
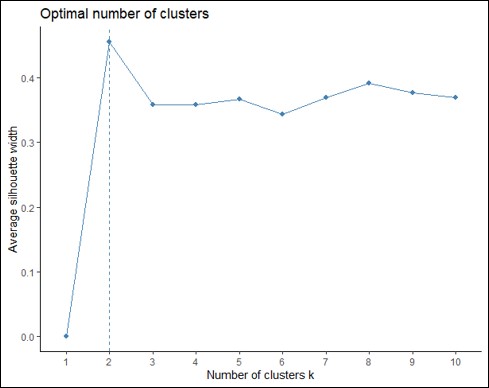
Figure 7: Optimal Number of Clusters (PAM)
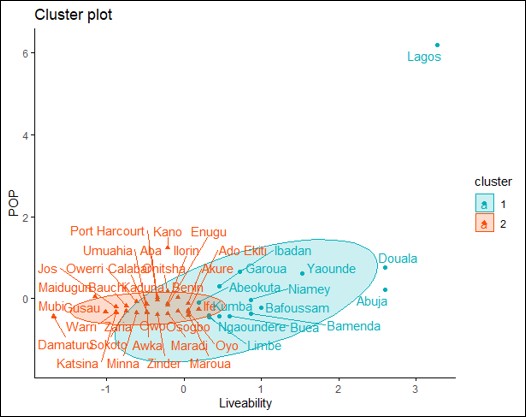
Figure 8: Cluster Visualization using PAM
3. Clustering Large Applications (CLARA)
CLARA, an extension of PAM suitable for large datasets, was used to handle the computational demands of extensive city-level data.
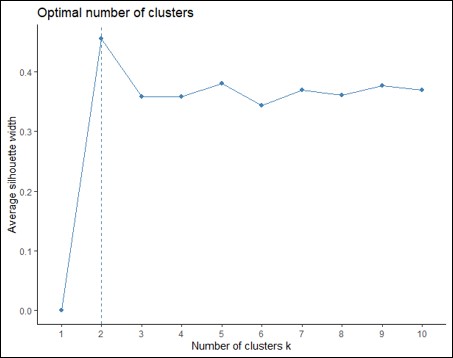
Figure 9: Optimal Number of Clusters (CLARA)
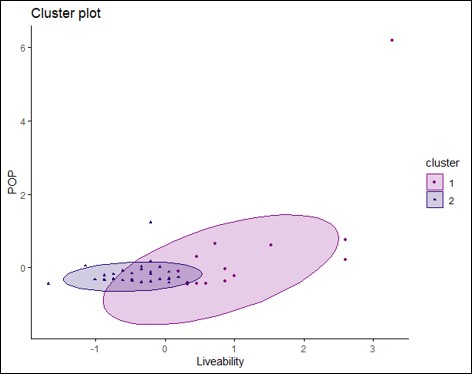
Figure 10: Cluster Visualization using CLARA
Table 2 presents the final clustering results, listing the assignment of each city to its respective cluster group.
TABLE 2. Cluster List Of Nigeria Centered Region’s Cities
|
City |
Cluster |
Population |
|
Lagos |
3 |
14900000 |
|
Abuja |
1 |
1570000 |
|
Ibadan |
2 |
2550000 |
|
Ife |
2 |
502000 |
|
Abeokuta |
2 |
889000 |
|
Akure |
2 |
848000 |
|
Ado Ekiti |
2 |
447000 |
|
Oyo |
2 |
387000 |
|
Osogbo |
2 |
396000 |
|
Benin |
2 |
1150000 |
|
Ilorin |
2 |
848000 |
|
Kano |
2 |
3850000 |
|
Onitsha |
2 |
1480000 |
|
Enugu |
2 |
716000 |
|
Port Harcourt |
4 |
1010000 |
|
Owo |
4 |
222000 |
|
Aba |
4 |
1160000 |
|
Awka |
4 |
302000 |
|
Kaduna |
4 |
760000 |
|
Umuahia |
4 |
359000 |
|
Calabar |
4 |
371000 |
|
Minna |
4 |
322000 |
|
Owerri |
4 |
908000 |
|
Zaria |
4 |
408000 |
|
Sokoto |
4 |
428000 |
|
Bauchi |
4 |
694000 |
|
Jos |
4 |
623000 |
|
Warri |
4 |
363000 |
|
Katsina |
4 |
318000 |
|
Gusau |
4 |
383000 |
|
Maiduguri |
4 |
1200000 |
|
Mubi |
4 |
129000 |
|
Damaturu |
4 |
88000 |
|
Niamey |
2 |
1030000 |
|
Maradi |
2 |
267000 |
|
Zinder |
4 |
236000 |
|
Douala |
1 |
2770000 |
|
Yaounde |
1 |
2440000 |
|
Bafoussam |
2 |
600000 |
|
Bamenda |
2 |
270000 |
|
Buea |
2 |
131000 |
|
Garoua |
2 |
1750000 |
|
Kumba |
2 |
144000 |
|
Limbe |
2 |
84200 |
|
Ngaoundere |
2 |
190000 |
|
Maroua |
2 |
201000 |
IV. Results
Following statistical analysis, urban centers were grouped into four distinct clusters, as presented in Table 2. The selected cities and their respective cluster assignments are listed below that contains Cluster 3, Cluster 1 and over 500000 populated cities of Cluster 2.
TABLE 3. Selected Cities Via Clustering Analyse
|
City |
Cluster |
Population |
|
Lagos |
3 |
14900000 |
|
Abuja |
1 |
1570000 |
|
Ibadan |
2 |
2550000 |
|
Ife |
2 |
502000 |
|
Abeokuta |
2 |
889000 |
|
Akure |
2 |
848000 |
|
Benin |
2 |
1150000 |
|
Ilorin |
2 |
848000 |
|
Kano |
2 |
3850000 |
|
Onitsha |
2 |
1480000 |
|
Enugu |
2 |
716000 |
With enhancement in technique, various alternative transport sub modes now ensure high-cpmfort and high capacity services at increased intercity speeds. Those contain magnetic levitated trains (Maglev), high-speed trains, airlways, and high standart freeways. While these modes are quite competitive for intercity travel, their connections to each other vary from integrated systems to isolated operations.
The key factors affecting their work and competition are:
The choice and priority of these transportation modes depend on city size, demographic characteristics, travel demand, urban morphology, spatial and technical connectivity, travel distances, and other key parameters. For example, in Western Europe, both high-speed rail and air transport play significant roles depending on these factors (Marta et al., 2010).
Currently, high-speed trains (HST) are the most competitive mode for passenger travel over distances of approximately 400 to 600 kilometers. For distances exceeding 600 kilometers, air transport predominates. Empirical evidence from various Western and developed countries shows that high-speed rail outperforms both road and air transport at speeds of 200 km/h and above within the 400–600 km range (Kiziltas, 2020).
V. Discussion And Conclusions
As can be seen, all the selected cities in the final analysis are located in Nigeria. Nigeria's population makes it one of the largest cities in the World (Altan and Kızıltaş, 2020). With its vast land area and underground resources, it is expected to become one of the world's developed countries by the mid-21st century (Kenger et al, 2023). Nigeria is located in West-Northwest Africa, one of the most dynamic regions in Africa (Kim, 2019). The country is in a very important position for maritime trade due to its coastline and location facing the ocean. It is expected that Nigeria will be one of the leading countries in a future African Union political power (Xu et al, 2016). For this, it is necessary to establish a high-speed and high-capacity transportation network between the cities of Nigeria, which were shared as a result of the above analyzes (Teller et al, 2022). Following this, the establishment of a national high-speed transportation network and its urgent integration with neighboring countries are seen as a necessity in the second phase (Froemelt and Wiedmann, 2020).
The high-speed network proposal extends far to the south of Nigeria and could initially connect to South Africa via minor auxiliary links (Bus et al, 2017). Subsequently, a highly efficient route could connect the network to South Africa through central part of Nigeria within a relatively short timeframe (Wu et al, 2002). The importance of high-speed network in advancing sustainability and sustainable development is considerable; most notably, it significantly reduces greenhouse gas emissions (Sasmita, 2023).
Furthermore, widespread adoption of high-speed network would facilitate the proliferation of fast, high-capacity, and high-quality transportation services across the nation (Wang et al, 2019). This would substantially increase transportation capacity, improve road traffic safety, alleviate congestion, and potentially influence global energy geopolitics (You, 2022). The integration of west-central Africa relies fundamentally on transportation, economy, and politics, with high-speed mobility systems playing a leading role in transportation integration (Ison et al, 2025).



Open Access By Aditum Open Access Journals id licensed under Creative Commons Attribution 4.0 International License. Based On a Work at aditum.org


