International Journal of Business Research and Management
OPEN ACCESS | Volume 4 - Issue 3 - 2026
ISSN No: 3065-6753 | Journal DOI: 10.61148/3065-6753/IJBRM


Mohammad Taleghani
Full Prof., Department of Industrial Management, Ra.C., Islamic Azad University, Rasht, Iran.
*Corresponding Author: Mohammad Taleghani, Full Prof., Department of Industrial Management, Ra.C., Islamic Azad University, Rasht, Iran.
Received Date: June 02, 2026 | Accepted Date: June 18, 2026 | Published Date: June 22, 2026
Citation: Taleghani M., (2026). “Designing a Smart Model for Granting Bank Facilities Based on Big Data”. International Journal of Business Research and Management 4(5); DOI: 10.61148/3065-6753/IJBRM/089.
Copyright: © 2026. Mohammad Taleghani, Alejandro. This is an open access article distributed under the Creative Commons Attribution License, which permits unrestricted use, distribution, and reproduction in any medium, provided the original work is properly cited.
Granting bank facilities and identifying customers for facility provision has always been considered important, as it leads to greater assurance for banks in this regard. With the advent of the digital age and big data, the large volume of data helps banks gain better insights into decisions regarding facility provision and utilize Smart approaches. Therefore, in this research, a Smart model for granting bank facilities based on big data was designed. For this purpose, customers' financial and credit histories from internal bank systems were used, and machine learning, clustering, and regression analysis models were employed for data analysis. Using K-means clustering, customer groups were categorized into three risk levels: low-risk, medium-risk, and high-risk. Then, a random forest model was used to predict credit risk, which showed 96% accuracy. Subsequently, a combination of hierarchical analysis and particle swarm optimization algorithm was utilized to optimize the facility allocation process, and the results indicated a reduction in risk and an increase in bank productivity. Finally, the Smart model for granting bank facilities can help identify better customers for facility allocation and also reduce the risk of facility provision by banks.
Smart model, Granting bank facilities, big data, Machine learning, Hierarchical analysis
1. Introduction
In the digital age, with competitive markets and diverse service delivery channels, banks are undergoing serious and fundamental transformations. The main goal is customer satisfaction, and understanding customer needs in line with today's conditions and providing them with appropriate and quality services is a constant and primary concern for bankers. Electronic banking means the complete electronification of banks and all their activities, programs, and functions (Addy et al., 2024). Among the advantages of electronic banking are increased speed, time savings, reduced service costs, increased revenue, higher work accuracy, and greater adaptability to new regulations. Meanwhile, a large volume of information is needed to review and decide on program development. Big data analytics is one of the strategic technology options for organizing information (Kang, 2024). Technologies, by providing insights for future strategies based on daily operations, can in turn be effective in decision-making, and this can help organizations achieve success in the competitive arena (Yin, 2024).
Big data analysis plays an important role in banks and financial organizations today. These analyses can provide valuable information to organizations and help them achieve smarter decision-making. International banks are also gradually using the power of data to gain insights in various functional areas such as customer analysis, product sales, regulatory compliance management, credit risk management, and combating financial crimes. However, many of these banks are still hesitant to build and implement their big data environment because its usefulness is not yet fully understood. Factors such as business model, technology, and organizational structure play a role in creating this hesitation (Wang et al., 2024).
The application of big data in the banking industry can be of high importance from various aspects. Compliance with new and challenging regulations imposed by relevant authorities is one such aspect. Additionally, big data enables banks to improve customer authentication and profiling processes and act based on existing risks, ultimately leading to an increase in potential customers (Shi et al., 2024). On the other hand, big data helps banks by reducing operational costs and increasing business efficiency. Analyzing diverse customer-related data leads to deeper insights, as well as the analysis of monthly customer financial flows and the examination of their consumption behaviors. These analyses can compare customer behavioral patterns with other businesses and strengthen the corporate banking model. Big data also provides a 360-degree view of customer behavior, improves the efficiency of internal processes, and analyzes market trends, all of which are beneficial for retaining existing customers and attracting new ones (Hung et al., 2023). Furthermore, performance evaluation and comparison with competitors to improve efficiency, creating risk profiles to determine credit scores and manage customer risks, and Smart interactions through identifying priorities and providing services at the right time are other benefits of using big data in banking. Finally, big data helps modernize infrastructures and use open architecture models to reduce product costs.
In recent years, FinTech has rapidly developed as a transformative factor in the financial sector. FinTech has completely redefined the approach to doing business. This technology fundamentally integrates technology and financial tools, offering solutions that are much more efficient than traditional methods used in financial institutions. Although FinTech does not replace the traditional banking system, it can easily facilitate banking services. Today, many banking services are readily available using technologies such as machine learning, data analytics, and big data algorithms. In the traditional banking system, an integrated approach to banking business is adopted where core operations such as deposit attraction and loan granting are prioritized, while services such as money transfer, point of sale, and insurance are considered secondary activities. Smart lending, through digital platforms, enables the provision of low-cost and fast loans, which are accessible to a wide segment of the market that was previously underserved.
Smart lending is recognized as a growing industry in the digital lending sector, aiming to meet various financing needs, including consumer loans, facilities for micro and small enterprises, working capital loans, and short-term loans. This area includes a category of assets with relatively low risk for retail and institutional investors. Digital lending platforms and their supporting tools, such as Smart credit scoring systems and white-label services, are part of this growing industry. These platforms connect lenders with customers seeking fast and short-term loans by offering higher returns than current bank expectations. Accordingly, in this research, we will try to investigate how Smart credit products can be designed using a big data approach, which, in addition to having low risk, are aligned with societal needs and stakeholder strategies, and also have appropriate profitability. The goal of this research is to demonstrate that the application of big data and its analysis can be effectively used in the banking credit industry to create Smart credit products.
In this research, an attempt is made to present an Smart model for granting bank facilities, which is based on big data and uses machine learning algorithms. The presented model has characteristics that differ from the presented patterns in terms of approach, and this will be referred to in the methodology section. The structure of the present article is such that the literature review is presented in the next section, then the methodology is described, followed by the analysis of the findings, and finally, the conclusion is presented.
2. Literature Review
This section describes the literature review in the studied field. The introduced articles are mainly related to the last 5 years and are generally based on the provision of banking facilities and related models, and sometimes Smart models. Kuateng et al. (2019) investigated the causal relationships between the efficiency of information technology (IT) applications and the performance of banks. Wibisono et al. (2019) in a study examined the applications of big data and artificial intelligence in central banking. Indriasari et al. (2019) in an article investigated the evolution of digital banking and the applications of artificial intelligence (AI) and big data analytics (BDA) in improving customer experience in the Indonesian banking industry.
Hung et al. (2020) in a study investigated the use of big data analytics in a commercial bank in Asia. Ali et al. (2020) investigated the impact of green supply chain management practices and big data analytics on the environmental and financial performance of banks in ASEAN countries. An article by Ali et al. (2021) examines the impact of big data and predictive analytics (BDPA) on the social and environmental performance of Islamic banks. The article by Zhou and Yang (2021) examines the impact of commitment to sustainability, green supply chain management, big data integration, and green human resource performance in banks. Soltani Delgosha et al. (2021) in a study using a four-stage Delphi method, concluded that fraud detection and credit risk analysis are among the most important applications of big data in the banking industry.
Al-Khatib (2022) in his research investigated the impact of intellectual capital on innovation performance in the Jordanian banking sector and the moderating role of big data analytics. Eni et al. (2022) in a study investigated the impact of artificial intelligence and big data analytics in Indian banking marketing. Sazu and Jahan (2022) in a study investigated the impact of blockchain-based analytics in the banking industry. Sazu and Jahan (2022) in a study investigated the impact of big data analytics on the financial services industry, especially banks. Isenberg et al. (2022) investigated the impact of credit risk assessment on the financial performance of commercial banks in the US and Europe during the period 2017-2021.
Morshedul Hasan et al. (2023) in a study investigated the impact of data innovations on banking. Hong et al. (2023) in a study explored how to leverage big data analytics in the banking industry. Gayayereh et al. (2023) in a study investigated the improvement of banking services in Ghana using big data analytics. Al-Damour et al. (2023) in an article investigated the impact of big data analytics application practices on the performance of commercial banks in Jordan.
Addy et al. (2024) investigated the role of predictive analytics in credit risk management in banks. Chang et al. (2024) explored the impact of new technologies and data analytics on B2B banking systems and green finance. Shoetan et al. (2024) showed in a study that big data analytics plays a vital role in detecting and preventing financial fraud. Ahmadi (2024) examined the impact of artificial intelligence and big data technologies on the financial industry. Mohammed et al. (2024) investigated the factors influencing the use of business intelligence and analytics in the banking industry and examined the impact of employees' work experience on this use in Jordanian commercial banks. Olabanji et al. (2024) investigated the impact of artificial intelligence on the management of personally identifiable information in the financial sector. Liao et al. (2024) explored the impact of big data infrastructure on FinTech innovation in banks. Liu et al. (2024) investigated the impact of lenders' use of artificial intelligence (AI) on reducing defaults among borrowers who have experienced natural disasters. Mahgoub (2024) research examines the optimization of bank loan approval using deep learning models and binary classification methods. Sadok and Assadi (2024) discussed the effects of artificial intelligence in bank credit analysis. Kang (2024), in his research titled "The Disappearance of Private Information with the Advent of Big Data," examines the impact of big data on the value of borrowers' private information. Yin (2024), in his article, investigates the impact of increasing corporate data volumes on commercial banks. Shi et al. (2024), in their study, presented a novel approach based on neighborhood rough sets, which is used for analyzing and processing uncertain and complex data. Wang et al. (2024) investigated the impact of big data and green loans on the energy efficiency of companies.
For the topic of this research, existing evidence from previous studies indicates that the simultaneous and comprehensive combination of big data methods, machine learning, and decision optimization has rarely been addressed. These research gaps can be more precisely stated as follows:
Given these gaps, research in designing and implementing Smart bank loan models that simultaneously and comprehensively combine big data, machine learning algorithms, and decision optimization techniques is an important and innovative research opportunity. This research can contribute to scientific and practical advancements in the field of bank lending and improve decision-making processes.
3. Methodology
This research is designed using a descriptive-analytical research method and includes qualitative and quantitative stages for a comprehensive analysis of information related to the credit risk of bank customers. Initially, the qualitative stage was conducted with the aim of extracting factors influencing credit risk and customers' financial behavior through in-depth interviews with banking sector managers and experts. This approach helped identify challenges and behavioral patterns, paving the way for a more precise definition of the research problem.
Subsequently, in the quantitative stage, relevant data, including transactions, financial and credit histories of customers, were collected from internal banking systems and reliable external sources. For data analysis, advanced statistical techniques, including regression analysis, clustering, and machine learning models, were used to identify patterns influencing customers' credit status. These stages are designed to provide robust results and evidence for validating and improving credit risk prediction models.
Combining these two research approaches allows us to address the research problem comprehensively and accurately, and to identify the strengths and weaknesses of existing credit models. Ultimately, the findings of this research can help optimize decision-making in loan granting and reduce credit risks.
Data analysis is performed using machine learning techniques and predictive modeling, which includes specific stages of risk analysis and customer clustering. In the first stage, data collected from various sources, including financial and credit information of customers, undergo data preprocessing operations. This stage includes data cleaning, anomaly correction, and converting data into a suitable format for analysis.
After preprocessing, customer clustering is performed using the K-Means algorithm to identify different groups of customers with similar characteristics. The validity of clustering and the examination of the characteristics of customer credit clusters allow us to analyze the behavioral patterns and specific risks of each group.
For predictive risk modeling, the Random Forest algorithm is used, which more comprehensively analyzes data and identifies factors related to credit risk. In this stage, after data collection and preprocessing, the data are divided into training and testing sets. The results of the Random Forest algorithm implementation are analyzed and interpreted to more accurately evaluate and validate the model.
In addition, to optimize decision-making in the allocation of bank facilities, the Analytical Hierarchy Process (AHP) method is used. This method includes completing the pairwise comparison matrix using expert opinions, determining criteria weights, analyzing weights, and evaluating the Consistency Ratio (CR). The results of these analyses help clarify and optimize the loan granting process. Finally, the Particle Swarm Optimization (PSO) algorithm is implemented to determine the optimal amount of bank facilities. Validation and improvement of the PSO model are other key stages that allow us to continuously enhance the optimization model and achieve smarter decisions.
The statistical population of this research includes customers of reputable commercial banks in Iran, who have been purposefully selected to investigate factors affecting credit status and credit risk. Data collected from internal banking systems, including transaction information, financial records, and customer repayment history, along with external data such as analysis of customer behavior on social networks and credit records from official sources, have been used to create comprehensive and accurate criteria for credit assessment. This combination of data can help improve the accuracy of credit risk prediction models and provide a completely comprehensive profile of customers' financial and behavioral status.
Data collection from internal banking systems includes transaction data, customer financial records, repayment records, and their credit profiles. In addition to internal data, external data such as social networks and economic and social information related to customers can also add value to credit prediction models and help form a more complete profile of credit risk and status. External sources for data collection include:
4. Data Analysis
This section discusses the practical implementation of the Smart loan granting model. The total number of variables used is 18, including 9 internal variables, 5 external variables, and 4 public macro variables. Below, a brief explanation for each category of variables is provided:
Table 1. Introduction of Research Variables
|
Category |
Variable |
Description |
|
Internal variables (banking information) |
Customer ID |
Unique customer ID; used as the primary key for data connection. |
|
Age |
Customer age; an indicator of financial experience and work history |
|
|
Monthly Income |
Customer's monthly income; indicates debt repayment ability |
|
|
Credit Score |
Internal credit rating; bank's estimate of customer's credit risk |
|
|
Total Loans |
Number of loans received; indicating customer experience in using financial facilities |
|
|
Loan Default History |
Loan default history; for customer risk assessment |
|
|
Monthly Transactions |
Monthly transaction count; indicates the level of use of banking services |
|
|
Account Balance |
Current account balance; an indicator of customer liquidity |
|
|
Employment Status |
Employment status (employed, self-employed, unemployed, retired); indicator of customer's financial stability |
|
|
External variables (credit and social information) |
Social Media Activity |
Social media activity level; an indicator of social interaction and influence |
|
Customer Satisfaction Score |
Customer satisfaction score for banking services; reflecting the customer's perspective on services |
|
|
Credit Report Score |
Credit scoring from external sources; determining customer creditworthiness at a macro level |
|
|
Total Debt |
Total customer debt; indicator of financial obligations |
|
|
Debt Repayment History |
Debt repayment history; indicative of customer's financial commitment and responsibility |
|
|
Macro public variables (economic and environmental information) |
Region Economic Growth |
Regional economic growth rate; affecting the customer's financial capacity |
|
Unemployment Rate |
Regional unemployment rate: an indicator of the employment situation in the customer's region |
|
|
Inflation Rate |
Inflation rate; affecting customer purchasing power |
|
|
Market Risk Index |
Market Risk Index: An indicator of the region's economic risk level |
Data Cleaning: The first step in data preprocessing is cleaning the data from noise and incomplete data. Duplicate data, illogical data, and missing values are identified and corrected. For example, incomplete data can be addressed through methods such as replacement with the mean or deletion of incomplete rows.
Figure 1 shows that features with missing data have been identified. As can be seen, some features such as AccountBalance, Age, and InflationRate have the highest number of missing data. To manage these missing values, the mean imputation method will be used. In other words, the missing values of each feature will be replaced with the mean of the existing values of that feature, to maintain the integrity and completeness of the data in subsequent analysis and modeling stages. This method helps reduce bias caused by incomplete data and ensures the improvement of the final model's quality.
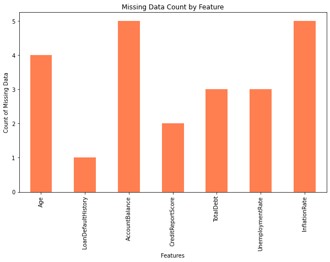
Figure 1. Missing Data Identification
Subsequently, correlation analysis was used as a method for selecting important features, without a target variable (which is usually defined as the output or result in predictive models). This method is applied in cases where modeling is performed for segmentation or clustering purposes, and instead of predicting an output variable, the focus is on identifying patterns and relationships between independent variables.
In Figure 2, variables with a correlation higher than 0.5 have been identified and extracted as important features. These variables indicate strong and meaningful relationships between the data and are considered in the modeling process. Also, the correlation coefficient values for each of these important variables are provided in the Figure 2 to determine their degree of association with other variables.
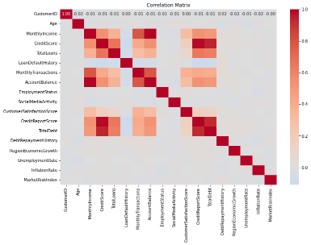
Figure 2. Correlation coefficient diagram of variables
Based on the results of calculations and analysis of correlation coefficients and considering the findings, the key variables have been identified and extracted as follows:
['TotalLoans', 'CreditScore', 'MonthlyTransactions', 'TotalDebt', 'AccountBalance', 'MonthlyIncome', 'CreditReportScore']
To accurately analyze and segment customers, the clustering method was used as one of the practical techniques in data analysis and risk management. In this study, the opinions of financial and credit experts were examined as a credible source, and based on their analyses, it was determined that classifying customers into three clusters—low-risk, medium-risk, and high-risk—is the most logical structure for effective credit risk management and optimizing loan granting processes.
Additionally, a visual representation of this analysis is provided in Figure 3, which shows the overall clustering structure and the quality of separation for each cluster. This figure confirms that all three selected clusters have a logical and scientific structure, both in terms of data distribution and the distance between clusters. Therefore, the silhouette index with a value of 0.63 and the visual analysis in Figure 4 reinforce the validity of the clustering and the experts' opinions, and have been used as one of the scientific pieces of evidence in defense of the model used in this research.
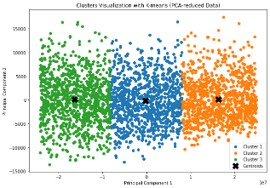
Figure 3 Overall clustering structure
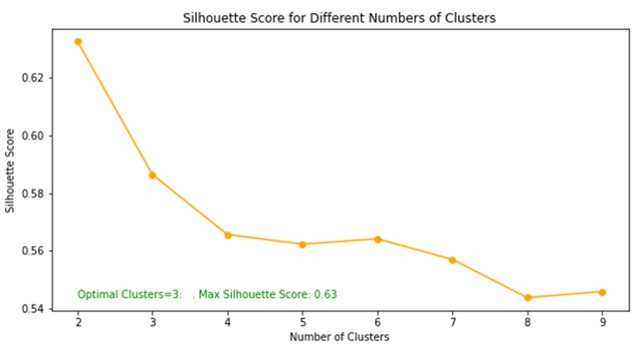
Figure 4 - Silhouette index
Based on the performed clustering and its validation, the characteristics of each of the three clusters (low-risk, medium-risk, and high-risk) were identified using descriptive statistical analysis of the data.
Next, a model for predicting customer credit risk has been designed, implemented based on advanced machine learning methods. The goal of this model is to accurately and effectively predict customer credit risk and assign them to different risk groups (low-risk, medium-risk, high-risk) according to their financial and credit characteristics. To achieve this goal, one of the powerful machine learning algorithms called Random Forest has been used, which is suitable for this model due to its high accuracy and ability to manage complex and multi-dimensional data features.
The designed model is shown in Figure 5, which illustrates the overall structure of the risk prediction process. This model includes several main stages, which will be briefly described.
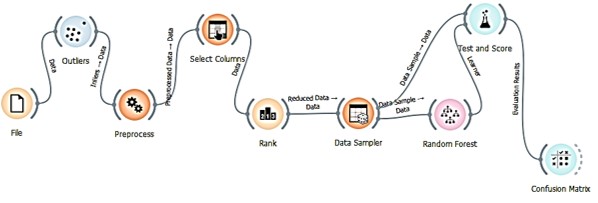
Figure 5 Proposed model structure
In fact, using the features and conditions obtained from the model, we want to assign customers to these classes. Figure 6 shows one of the trees in this random forest along with its results and decisions. This tree clearly shows how different data features affect the final decision. By analyzing these decisions, we can gain a better understanding of the model's prediction process and the influential factors.
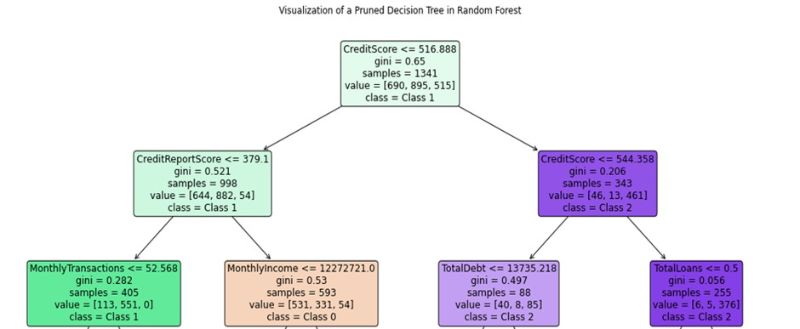
Figure 6 - Decision tree
The analysis of Figure 6 examines a specific decision tree from the random forest model that classifies customers into different categories using financial features. By following the paths in this tree, we can make optimal decisions for identifying customer classes.
Decision tree structure and classification process
1. Root Node:
- CreditScore ≤ 516.888
- If the credit score is less than or equal to 516.888, it goes to the next node; otherwise, it goes to the right.
2. Left node:
- CreditReportScore ≤ 379.1
- If the credit report score is less than or equal to 379.1, it goes to the following nodes:
- MonthlyTransactions ≤ 52.568
- If the number of monthly transactions is less than or equal to 52.568, the customer belongs to Class 1.
- If CreditReportScore > 379.1, it reaches the next node:
- MonthlyIncome ≤ 12272721
- If the monthly income is less than or equal to 12272721, it belongs to Class 0.
3. Right node:
- CreditScore ≤ 544.358
- If the credit score is less than or equal to 544.358, it goes to the following:
- TotalDebt ≤ 13735.218
- If the total debt is less than or equal to 13735.218, it belongs to Class 2.
- If it is greater, it is transferred to other nodes.
According to this analysis, customers on the left side of the decision tree belong to two different classes:
Class 1: For customers with a credit score ≤ 516.888, a credit report score ≤ 379.1, and monthly transactions ≤ 52.568.
Class 0: For customers with a credit score ≤ 516.888, a credit report score ≤ 379.1, and monthly income ≤ 12272721, then they belong to Class 0.
In this analysis, we have examined one of the 100 randomly generated trees, while other trees are similarly created and can provide interesting and useful results and patterns. This analysis helps to clearly identify the decision-making path for customer classification and make better decisions for risk management and optimal services.
The random forest model implemented in this study has been evaluated to predict optimal performance. Various evaluation metrics have been used, among the most important of which is the model's accuracy. After training and testing the model, an accuracy of 0.9622 was obtained. This accuracy value indicates that the model has effectively predicted 96.22% of the samples correctly. Such high accuracy demonstrates the high quality of the data and the model's learning power in identifying patterns in the data. Furthermore, an accuracy close to 1 (100%) can indicate that the model is capable of generalizing well to new data. Therefore, these results indicate the high efficiency and reliability of the random forest model in predicting outcomes, and this model can be used as a powerful tool for analysis and prediction in similar cases.
Also, according to the confusion matrix in Figure 7, the percentage of correct predictions is as follows:
- Class 0: 280 out of 295 correct predictions (94.91 percent.(
- Class 1: 367 out of 374 correct predictions (98.13 percent.(
- Class 2: 219 out of 231 correct predictions (94.81 percent.(
These percentages show that the model has high accuracy in identifying each of the classes, especially in Class 1 with 98.13 percent, which indicates the model's very good ability to identify this specific class. Overall, these results clearly demonstrate the good performance of the model and can be used as effective criteria for evaluating its efficiency in achieving desired results.
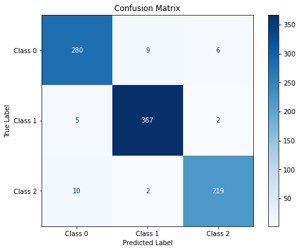
Figure 7. Confusion Matrix
Next, new data was predicted using a random forest model trained on seven key features including ['total loans', 'credit score', 'monthly transactions', 'total debt', 'account balance', 'monthly income', and 'credit report score']. In addition to predicting the final class (loan allocation), this model also provides the probability of each sample belonging to each of the three defined classes.
To predict new data, samples of data with specific values for each input variable were fed into the model. The model calculated not only the assigned class but also the probability of each sample belonging to each of the three classes. These probabilities indicate the model's confidence in its prediction and can help decision-makers optimize loan allocation.
The table 2 shows an example of new data along with the predicted class and corresponding probabilities:
Table 2. New Data Prediction Results
|
Total Loans |
Credit score |
Monthly Transactions |
Total debt |
Account balance |
Monthly income |
Credit Report Score |
Predicted Class |
Probability of Class 0 |
Probability of Class 1 |
Probability of Class 2 |
|
0 |
301 |
54 |
4310.35 |
33886900 |
16433324 |
285.63 |
0 |
0.95 |
0.05 |
0 |
|
5 |
571.44 |
66 |
17456.5 |
45632589 |
24123456 |
591.5 |
2 |
0.01 |
0 |
0.99 |
|
2 |
321.44 |
32.21 |
5621.45 |
18698547 |
14325369 |
315.45 |
1 |
0.09 |
0.91 |
0 |
|
0 |
300 |
51.9 |
5310.35 |
32886900 |
16433919 |
290.63 |
0 |
0.85 |
0.15 |
0 |
In table 2, the predicted class is determined based on the highest probability, representing the model's decision. Also, the probability values allow users to perform a more detailed analysis to optimize their decisions based on the model's data.
In order to optimize decision-making for the allocation of banking facilities, the use of Multi-Criteria Decision-Making (MCDM) methods enables banks to distribute their financial resources more effectively. The Analytic Hierarchy Process (AHP) is one of the powerful tools in this field, which identifies decision-making priorities by weighting key criteria.
To determine the weights of decision-making criteria in the Analytic Hierarchy Process (AHP) method, a pairwise comparison matrix was first completed based on the opinions of five financial and banking experts with experience in the field of facility allocation. These experts, based on their knowledge and experience, determined the relative importance of each criterion compared to other criteria on a scale of 1 to 5.
Table 3. Final results of criteria weighting
|
Criterion |
Weight |
|
Total loans received |
0.223679 |
|
Monthly transaction count |
0.178724 |
|
Credit Score |
0.162778 |
|
Monthly income |
0.152039 |
|
Total debt |
0.109695 |
|
Credit report score |
0.104224 |
|
Account balance |
0.068860 |
As Table 3 shows, the "Total Facilities Granted" criterion has the highest importance with a weight of 0.223679, indicating a direct correlation between this indicator and customer risk and repayment ability. The criteria "Number of Monthly Transactions" (0.178724) and "Credit Score" (0.162778) are also highly important, paying special attention to customers' financial activities and credit health.
In contrast, criteria such as "Account Balance" (0.068860) and "Credit Report Score" (0.104224) have less weight but still play a complementary role in customer evaluation.
One of the most important indicators in AHP results credit scoring is the consistency ratio, which in this analysis is calculated to be 0.0813. Since this value is less than the acceptable threshold of 0.1, the comparative judgments made in the pairwise matrices have satisfactory consistency. This confirms the accuracy and validity of the criteria weighting.
Next, the Particle Swarm Optimization (PSO) algorithm was used to determine the optimal amount of bank facilities based on a set of key variables. These variables include total loans, credit score, number of monthly transactions, total debt, account balance, monthly income, and credit report score, each defined with a specific range. In the table 4, we have defined a range for each variable based on real data. The objective function designed in this algorithm seeks to maximize the loan amount while also considering factors related to the bank's risk and financial return. In fact, the goal is to determine the maximum amount of bank facilities to increase bank profit and at the same time reduce the risk of loan default.
Table 4. Defining Variable Limits
|
Variable |
Lower limit |
Upper limit |
|
Total loans received |
0 |
5 |
|
Monthly transaction count |
1 |
94.84 |
|
Credit score |
300 |
850 |
|
Monthly income |
3000917 |
24994300 |
|
Total debt |
0 |
32561.13 |
|
Credit report score |
244.06 |
870.69 |
|
Account balance |
6020587.26 |
50008891.4 |
Using PSO, specific ranges for each variable are defined as input, and by adjusting algorithm settings such as swarm size and maximum iterations, the optimal combination of variable values for providing the optimal facility amount is obtained.
The algorithm's outputs include the optimal variable values and the maximum possible facility amount, calculated based on the input conditions. This method helps the bank make more optimal decisions regarding loan disbursement to various customers.
After running the model, the optimal values found by the PSO algorithm for the input variables are as follows:
Total loans: 0.4716, Credit score: 850 (maximum possible value for credit score), Monthly transactions: 94.84 (maximum possible value for number of transactions), Total debt: 0 (no active debt recorded), Account balance: 50,008,891.4 (maximum possible value for account balance), Monthly income: 24,994,300 (maximum possible value for monthly income), Credit report score: 870.69 (maximum possible value for credit report), Therefore, the maximum loan amount granted is equal to Maximum loan amount: 7,500,677.504
This amount represents the maximum facility that the bank can grant to the customer under these conditions. The PSO algorithm, based on the input data and the defined objective function, calculated 7,500,677.504 as the maximum facility amount. This amount has been optimized considering the customer's conditions so that the bank can maximize its profit and minimize the risk of non-repayment. Ultimately, the PSO algorithm has effectively optimized the maximum bank facility amount based on the input variables and defined conditions. The results show that the customer has very favorable credit and financial conditions and can receive the highest possible facility amount. This model can be used as a reliable tool in decisions regarding granting bank facilities.
PSO algorithm validation is typically performed by evaluating the stability and repeatability of the results. In this method, the PSO algorithm is run multiple times with the same data and initial conditions, and the outputs are compared. If the results from multiple runs are similar, it indicates the algorithm's stability and its ability to find reliable optima. On the other hand, if the results differ significantly, this may point to weaknesses in the algorithm's parameter tuning or its incompatibility with the problem under investigation.
In the present study, this validation method was employed. The PSO algorithm was run multiple times with identical data and similar conditions, and consistently identical results were obtained in all runs. This indicates the following points:
Therefore, the validation of the PSO algorithm through repeated execution and comparison of results showed that this algorithm possesses high stability and repeatability for the problem under investigation. The identical results obtained in each run confirm that the algorithm's settings were correctly configured and the objective function was appropriately defined. This ensures that the PSO algorithm has a high capability in solving optimization problems related to this research and its results are reliable and valid.
5.Conclusion
This research, aiming to design and implement an Smart model for granting bank facilities based on big data, has taken an effective step towards improving banks' decision-making processes. The proposed model includes key stages such as data collection and preprocessing, customer clustering, credit risk prediction, and decision optimization, which have achieved high accuracy and efficiency using advanced algorithms.
In the first stage, data preprocessing, focusing on cleaning and standardization, improved data quality and enabled more accurate analysis. The second stage, customer clustering with the K-Means algorithm, successfully divided customer groups into three categories based on credit risk: low-risk, medium-risk, and high-risk, which served as a basis for optimal resource allocation. Subsequently, using the Random Forest model, customer credit risk was predicted with 96.22% accuracy, playing a significant role in reducing the risk of granted facilities. Finally, combining AHP and PSO techniques to optimize the facility allocation process has facilitated banks' decision-making in an efficient and scientific manner. Expert opinion analysis showed that despite challenges such as insufficient infrastructure and the need for employee training, implementing this model is possible by improving infrastructure and enhancing organizational culture. Furthermore, information security was highlighted as a primary necessity, and attention to this issue is crucial for maintaining customer trust.
Overall, this research demonstrated that using big data and Smart techniques in evaluating customer creditworthiness can lead to improved facility granting processes, reduced risk, and increased bank productivity. The results of this study can serve as a model for implementing similar systems in other banks and financial organizations.
To achieve the goals of the Smart big data-based bank facility granting model and ensure its success in the operational environment, implementing practical and scientific solutions is essential. These solutions should focus on improving infrastructure, training employees, and efficient data management to not only increase bank productivity but also enhance customer satisfaction. The most important recommendations are presented below.
For the successful implementation of the Smart bank facility granting model, improving technology infrastructure, including powerful servers, distributed storage systems, and big data analysis software, is essential. Data security must be ensured using methods such as advanced encryption, intrusion detection systems, and compliance with information security standards (such as ISO 27001) to protect sensitive customer information. For proper adoption and utilization of the proposed model, bank employees need to be trained in big data, machine learning, and advanced data analysis. Holding workshops and training courses for managers and experts will increase their awareness of the model's benefits and how to use it. Special attention to data cleaning, standardization, and integration from internal and external sources is essential. Developing precise protocols for data collection from banking systems, social networks, and other sources can improve the quality of analyses. Additionally, using advanced tools such as Apache Spark for data preprocessing and management is recommended.
Banks should provide transparent policies for facility allocation based on analytical models. These policies should be designed to ensure that low-risk customers have greater access to facilities and that banks can optimally manage their resources. To reduce implementation risks, it is recommended that the model first be piloted in one or more selected branches. This stage allows for evaluating the model's performance, identifying challenges, and making necessary adjustments. Banks can benefit from collaborations with companies active in data analysis and artificial intelligence. These collaborations can accelerate the model implementation process and improve its accuracy. Banks can use the model's results to analyze customer behavior, predict risk, and prevent overdue debts. This not only reduces financial risks but also creates greater transparency in credit decisions.
For widespread adoption of the model, it is necessary to shift the organizational culture of banks towards embracing innovation and new technologies. This can be achieved by holding internal meetings, presenting the model's benefits, and emphasizing the importance of digital transformation.It is suggested that banking regulatory and policy-making authorities formulate supportive laws and regulations for the use of Smart models. These laws should include requirements for data ethics, customer privacy protection, and transparency in the use of AI algorithms. Banks should develop tools for monitoring model performance and receiving feedback from users and customers. These tools can help continuously improve the model and increase customer satisfaction. Implementing these solutions can ensure the success of the proposed model in banks' operational environments and play a key role in increasing productivity and reducing credit risks.


Open Access By Aditum Open Access Journals id licensed under Creative Commons Attribution 4.0 International License. Based On a Work at aditum.org