International Journal of Business Research and Management
OPEN ACCESS | Volume 4 - Issue 3 - 2026
ISSN No: 3065-6753 | Journal DOI: 10.61148/3065-6753/IJBRM


Temie Alehegn1*, Hilena Goshme2, Gedisha Katola2, Assefa Deginew3, Bizuayehu Admassu2, Etabez Ayaye2
1Injibara University, College of Agriculture, Department of Agricultural Economics.
2Arba Minch University, College of Agricultural Science, Department of Agribusiness and Value Chain Management.
3Woldia University, College of Agricultural Science, Department of Soil and Watershed Management.
*Corresponding Author: Temie Alehegn, Injibara University, College of Agriculture, Department of Agricultural Economics.
Received Date: May 05, 2026 | Accepted Date: May 15, 2026 | Published Date: May 20, 2026
Citation: Alehegn T, Goshme H, Katola G, Deginew A, Admassu B, Ayaye E., (2026). “Market Integration and Value Chain Dynamics of Head Cabbage: Insights from Bonke District, Southern Ethiopia”. International Journal of Business Research and Management 4(4); DOI: 10.61148/3065-6753/IJBRM/084.
Copyright: © 2026. Temie Alehegn. This is an open access article distributed under the Creative Commons Attribution License, which permits unrestricted use, distribution, and reproduction in any medium, provided the original work is properly cited.
Despite its vital role in rural livelihoods, the cabbage value chain in Southern Ethiopia is hindered by systemic inefficiencies, leading this study to investigate the market chain dynamics of head cabbage in the Bonke District, Gamo Zone. Utilizing primary data from 231 producers and 26 traders collected in 2024 through a combination of descriptive statistics and Cragg’s double-hurdle econometric model, the research identifies a multi-tiered network of actors including input suppliers, assemblers, wholesalers, and retailers. The analysis reveals that the chain is severely weakened by an "infrastructure-perishability trap," where poor road networks and high product vulnerability lead to significant post-harvest losses and reduced bargaining power for farmers. Econometric results from the first hurdle indicate that educational attainment (β= 0.041), market experience (β= 0.043), family size (β= 0.044), and landholding capacity (β = 0.036) are the primary drivers of market participation, while market distance (β= -0.024) acts as a significant deterrent. In the second hurdle, supply intensity is significantly driven by the sex of the household head (β= 0.045), age (β= 0.046), and access to market information (β= 0.034), whereas credit use (β= -0.02) and distance (β= -0.007) negatively impact the volume supplied. To revitalize the sector, the study advocates for a shift toward integrated value chain management, suggesting that policy interventions should prioritize improving rural infrastructure, enhancing access to real-time market information, and strengthening horizontal linkages among actors. By mitigating logistical bottlenecks and boosting productivity, stakeholders can transform cabbage production from a subsistence activity into a competitive, commercialized market chain that fosters sustainable agricultural development in Ethiopia.
Head cabbage, Market chain analysis, Marketed supply, Cragg’s hurdle regression
The economy of Ethiopia remains fundamentally rooted in agriculture, which contributes approximately 32.1% to the national Gross Domestic Product and generates nearly 70% of total export earnings (Hailu, 2024). While the sector's relative share of GDP has decreased from over 45% in previous decades, it continues to provide a livelihood for roughly 65% to 68% of the working population, with smallholder farmers accounting for 80% of the total agricultural output (Desta, 2021; Hailu, 2024; Korsa & Labata, 2022). Within this framework, the horticulture sub-sector—particularly vegetable production—has emerged as a critical engine for poverty reduction, nutritional security, and high-value employment due to its favorable labor-to-land ratios (Teshome et al., 2018; Wordofa et al., 2021).
Vegetables are indispensable for diversifying diets and addressing micronutrient deficiencies, while simultaneously serving as a vital income source for rural households (Teshome et al., 2018). Among these, head cabbage (Brassica oleracea var. capitata) stands as the second most important vegetable crop in Ethiopia in terms of both area coverage and production volume, surpassed only by red pepper (Teshome et al., 2018). Known for its high nutrient density, head cabbage provides significant amounts of vitamins A, C, and B, as well as phyto-nutrient antioxidants that bolster immunity and reduce health risks (Teshome et al., 2018). Despite its economic and nutritional importance, the sector is plagued by market imperfections and low consumption levels driven by limited availability in certain regions (Ayalew & Girma, 2025; Teshome et al., 2018).
The potential for head cabbage to enhance farmer livelihoods is substantial, with recent studies indicating net returns can reach approximately 41.78% of the sale price (Ayalew & Girma, 2025). However, this profitability is often undermined by systemic market chain constraints. High product perishability, inadequate road infrastructure, and a lack of real-time market information frequently lead to significant post-harvest losses and reduced bargaining power for producers (Abate & Malede, 2025; Ayalew & Girma, 2025). Furthermore, market participation is heavily dictated by household resource endowments, such as education levels, landholding size, and labor availability (Ayalew & Girma, 2025).
In the Bonke District of the Gamo Zone, head cabbage production is a primary economic activity, yet the specific dynamics of its market chain remain under-researched. This study attempts to fill this gap by examining the market actors, identifying the determinants of supply, and highlighting the critical opportunities and constraints within the local chain. By analyzing data from 231 producers and 26 traders through a Cragg’s hurdle regression framework, this research seeks to provide evidence-based recommendations to transform subsistence cabbage farming into a robust, market-oriented enterprise.
1.2. Statement of the Problem
In Ethiopia, agricultural marketing serves as the primary engine for economic transformation, yet the transition from subsistence to market-oriented production remains hindered by structural inefficiencies. While head cabbage production has seen a significant increase in both area coverage and output—growing by approximately 16% to 30% in recent years—this growth has not translated into proportional income gains for smallholders (Ayalew & Girma, 2025). The sector continues to grapple with inadequate transport networks, limited trader capital, and a fragmented market information system that erodes the bargaining power of farmers (Abate & Malede, 2025; Tolassa & Bedada, 2023).
A critical bottleneck in the head cabbage market is the crop’s extreme perishability. Research indicates that approximately 25% of horticultural products are lost along the market channel due to poor storage and inefficient logistics (Abate & Malede, 2025). This vulnerability, coupled with high price volatility during peak harvest seasons, forces farmers to sell their produce at depressed prices to avoid total loss (Ayalew & Girma, 2025; Tolassa & Bedada, 2023). Furthermore, smallholders face multifaceted risks, including output price fluctuations, pests, and high input costs, which are often exacerbated by the lack of formal contract marketing arrangements (Abate & Malede, 2025; Bati, 2019).
Despite the economic importance of head cabbage in the Bonke District of the Gamo Zone, where environmental conditions are highly suitable for production, the local market chain remains under-researched. Previous studies in other regions, such as those in Ejere and Habru districts, have primarily utilized multiple regression models to analyze market supply (Gebiso et al., 2023). However, these approaches often suffer from methodological gaps as they fail to account for the "zero-participation" problem—the fact that some farmers may not participate in the market at all (Gebiso et al., 2023; Woldeyohanes et al., 2016). Using simple OLS regression in such cases can lead to biased and inconsistent estimates.
This study fills these critical gaps by providing location-specific, timely evidence on the head cabbage market chain in Bonke District. By employing Cragg’s Hurdle regression, this research distinguishes between the decision to participate in the market and the subsequent decision regarding the volume of supply (Woldeyohanes et al., 2016). This dual-stage econometric approach, combined with primary data from 231 producers and 26 traders, allows for a more nuanced identification of the determinants of market engagement. Ultimately, this study aims to map market actors, identify systemic constraints and opportunities, and offer evidence-based policy recommendations to enhance the commercialization of head cabbage in the study area.
Benefits and Beneficiaries of the Study
The findings of this research provide a strategic roadmap for enhancing market efficiency within the cabbage value chain of the Bonke District, offering specific advantages to a diverse group of stakeholders. For smallholder producers, the study creates vital awareness regarding systemic marketing hurdles and identifies the most profitable channels, thereby empowering them to improve their bargaining position. Market actors, including traders and service providers, benefit from detailed data on chain interactions that can help streamline logistics and reduce operational inefficiencies. Furthermore, the study provides policy makers and extension services with evidence-based insights into infrastructure deficits and perishability constraints to guide targeted rural development interventions. Finally, the academic community and future researchers can utilize these results as a foundational baseline or comparative reference for studies in similar agro-ecological zones.
Methodology
Study Area
Bonke Woreda is located in the Gamo Zone of Southern Ethiopia, bordered by Arba Minch Zuria, Dirashe, Kemba, Deramalo, and Dita, with Gerese serving as its main town. The district is characterized by a predominantly rural population of 159,089 (as of the 2007 Census), where 97.99% belong to the Gamo ethnic group and the majority (55.32%) identify as Protestant. Infrastructure remains a critical challenge for the cabbage market chain, as the area historically maintains a low road density of 49 km per 1,000 square kilometers, consisting of limited all-weather and dry-weather routes.
Sampling Technique and Sample Size Determination
To ensure the selection of a representative sample of respondents, this study employed a multi-stage sampling technique. The Bonke District population is characterized by homogeneous socio-economic conditions, a shared cultural background, and a predominantly Dega (highland) agro-ecology.
Selection of Producers
A multi-stage approach was utilized to select sample producers within the study area. In the first stage, sample kebeles were selected using a simple random sampling technique. In the second stage, a comprehensive list of head cabbage producers, including the specific area allocated to cabbage cultivation, was compiled for each selected kebele. Finally, individual sample farmers were selected from these lists using systematic random sampling, with the number of respondents per kebele determined proportional to the population size of the selected kebeles.
Sample Size Determination
The appropriate number of sample producers was calculated using the formula developed by Yamane (1967) to ensure statistical reliability. Based on this formula and the sampling framework, a total of 231 producers were selected as the primary respondents for the study.
n=N1+N(e)2
Following the assumption of a homogeneous population, a 7% margin of error (e = 0.07) was utilized at a 95% confidence level. Applying these parameters to the study population resulted in a final sample size of 231 producers.
n=N1+Ne2
n=27811+27810.052
n= 231.17 =231
This sample was then distributed across the selected kebeles using probability proportional to size (PPS) (Table 1) to ensure representative coverage of the district's cabbage production landscape.
ni=NiNn
Where,
ni = is the sample respondent in each Kebele
Ni= is the number of head cabbage producers in each Kebele
N= total head cabbage producers in the study area
n= is the total number of sample respondent obtained from Yamane formula
Table 1: Sample Distribution Proportional to Size
|
List of Kebeles |
Total Vegetable producers |
Sample taken |
|
Kalokagola |
870 |
72 |
|
Yela |
512 |
43 |
|
Geziso |
669 |
56 |
|
Chosha |
721 |
60 |
|
Total |
2781 |
231 |
Source: Own Calculation, 2024
Selection of Traders
Due to the lack of a comprehensive registration system, identifying the exact population of market intermediaries in the study area presented a challenge. Consequently, the selection of sample traders was determined based on the active volume of participants in the head cabbage market at the time of the study.
The sampling frame was constructed using a combination of two methods: Official Records ⸺A list of licensed traders was obtained from the District Trade and Market Development Office. Snowball Sampling ⸺To account for the informal sector, unlicensed traders were identified and recruited using a snowball sampling technique, where known market participants provided referrals to other active traders. Through these methods, a total of 26 head cabbage traders were purposively selected from the sampled kebeles, the primary study sites, and the central district town to represent the various levels of the marketing chain.
Methods of Data Collection
To ensure a comprehensive analysis of the head cabbage market chain in the Bonke District, this study utilized a variety of data sources and instruments, each serving a specific research purpose. Secondary data, including administrative records and reports from the Bureau of Agriculture and previous research, provided the necessary contextual background on district demographics and infrastructure. Primary data was sourced directly from producers and traders to capture quantitative and qualitative details on market participation, production volumes, and socioeconomic outcomes, while key informant organizations offered specialized insights into institutional support and systemic market constraints.
The research employed structured questionnaires as the primary instrument for gathering standardized quantitative data from 231 producers and 26 traders. To enhance reliability, these questionnaires underwent pre-testing and modification to eliminate redundant questions and incorporate essential variables tailored to the local context. Complementary qualitative instruments included Focus Group Discussions (FGDs), with one session conducted in each selected kebele to capture nuanced perspectives across different agro-ecological divisions. These efforts were reinforced by Key Informant Interviews (KII) conducted with one community leader and one sector expert per kebele to resolve ambiguities and provide specialized knowledge of the local head cabbage sector. Furthermore, snowball sampling was strategically used to identify unlicensed traders in the informal sector, while field observations served to verify and enrich the overall information gathered.
Methods of Data Analysis
The study utilized both descriptive statistics and econometric modeling to analyze the survey data. All data were initially coded and entered into SPSS before being transferred to STATA software for final analysis. Within the descriptive analysis, statistics such as mean, frequency, and percentages were used to describe the socioeconomic, demographic, and institutional factors characterizing the sample households.
An econometric analysis was used to identify factors affecting head cabbage market participation and the level of participation. Cragg’s double-hurdle model was utilized to identify the relationship between the dependent variable and the explanatory variables using STATA software. It is crucial to understand the effects of different factors on both the decision to participate and the intensity of participation. While many studies utilize Tobit, Heckman, or Probit models, the Tobit model is considered statistically restrictive because it assumes the same set of variables affect both the probability of participation and the level of participation. In contrast, the double-hurdle model allows for market participation and intensity of participation to be affected by different explanatory variables.
This model is particularly appropriate because it accounts for the possibility of zero observations arising from non-participants. Cragg (1971) modified the Tobit model to tackle this problem of zeros by giving special treatment to the participation decision. A non-zero marketed surplus is observed in two stages: first, the decision of whether or not to participate, and second, the intensity of participation once participating in the market.
While the Heckman model also utilizes two-stage estimation and accounts for sample selectivity bias, it assumes there will be no zero observations in the second stage once the first stage is passed. The double-hurdle model remains more flexible by considering that zero observations may still arise in the second stage due to individual choice or random occurrence. The use of this model is supported by various past studies, including research on teff marketed surplus (Efa et al., 2016), household expenditures (Deaton and Irish, 1984), and maize value chain analysis (Nugusa, 2011).
The general form of double hurdle model for farmers’ market participation and level of participation is explained as follows.
di*= x1β1+ ε1i
ε1i~N(0,σ12)
di= 0 if di*≤0
1 if di*>0
yi*= x2β2+ ε2i
ε2i~N(0,σ22)
yi= 1if yi*>0 and d1=1
0 if yi*≤0
Where: i refers to the ith household,
di represent the observable discrete decision of whether to participate or not participate to the market
di* represent the latent(unobservable) variable of di.
yi* represent is an unobserved latent variable of desired volume of milk sold
yi represent the corresponding observed variable of volume of milk sold
x1 and x2 represents vectors of explanatory variables
β1 and β2 are vectors of parameters to be estimated
ε1 and ε2 are random errors
To identify the factors influencing head cabbage market participation and the quantity supplied, the study utilizes two dependent variables: market participation decision (MMP), a dummy variable representing the probability of a household entering the market, and volume of supply (VS), a continuous variable measured in quintals. The hypothesized independent variables include economic factors such as quantity produced (QPROD) and land size (LAND), both of which are expected to have a positive relationship with market supply due to increased production capacity. Demographic characteristics include the sex of the household head (SHH), which may exert a positive or negative influence, and family size (FAM-SIZE), measured in adult equivalents to represent available labor force. Human capital and institutional variables, such as the education level of the household head (EDU-HH), years of farming experience (EXP), frequency of extension contact (EXT), and access to market information (MKT-INFO), are all hypothesized to positively influence participation and volume by improving knowledge and technology adoption. Furthermore, financial and technical factors like the current price of head cabbage (PRICE), use of credit (CRED-USE), and improved seed usage (ISU) are expected to boost market orientation. Conversely, distance to the nearest market (DMkt), measured in walking hours, and is hypothesized to have a negative impact on market participation due to increased transaction and transportation costs.
Table 2: Summary of Variable description and Expected Sign
|
Variable |
Description Variable |
Measurement |
Variable type |
Expected sign |
|
AGHH |
Age of household |
Year |
Continuous |
± |
|
SXHH |
Sex of household |
1=male0=female |
Dummy |
± |
|
EDUHH |
Schooling year of household |
Year |
Categorical |
+ |
|
FAM-SIZE |
Number of family members |
Number |
Continuous |
± |
|
PRICE |
Current price of head cabbage |
Birr |
Continuous |
+ |
|
QBPROD |
Quantity of head cabbage produced by household |
Quintals |
Continuous |
+ |
|
ISU |
Improved seed usage |
1=yes, 0=no |
Dummy |
+ |
|
CRED-USE |
Use of credit service |
1=yes, 0=no |
Dummy |
± |
|
FARMSIZE |
Landholding size of the household |
Hector |
Continuous |
+ |
|
NEXT_CON |
Number of Extension contact |
Number |
Continuous |
+ |
|
MKT-INFO |
Access of market information by households |
1=yes, 0=no |
Dummy |
+ |
|
DMkt |
Distance from market |
Hour |
Continuous |
- |
Source: Own Creation Based On Literature
Demographic Characteristics of Sampled Households
The demographic characteristics of the sampled households reveal a predominant male presence and relatively low formal education levels among head cabbage producers in the Bonke District. Regarding the gender of the household head, the vast majority were male, accounting for 96.54% (223) of the respondents, while female-headed households represented a small minority at 3.46% (8). The educational profile of the respondents shows that more than half are illiterate, totaling 58.01% (134), while 25.97% (60) can read and write, 13.85% (32) reached primary education (grades 1–8), and only 2.16% (5) attained a secondary education level (grades 9–10). In terms of marital status, the majority of the household heads were married, representing 85.28% (197) of the sample (Table 3). The remaining participants were comprised of single individuals at 6.93% (16), widowed at 6.06% (14), and divorced at 1.73% (4).
Table 3: Summary of Categorical Socioeconomic Variables
|
Variables |
Category |
Frequency (N=231) |
Percent (%) |
|
Sex |
Female |
8 |
96.54 |
|
Male |
223 |
3.46 |
|
|
Education Level |
Illiterate |
134 |
58.01 |
|
Read and write |
60 |
25.97 |
|
|
Primary (1-8) |
32 |
13.85 |
|
|
Secondary (9-10) |
5 |
2.16 |
|
|
Marital Status |
Single |
16 |
6.93 |
|
Married |
197 |
85.28 |
|
|
Divorced |
4 |
1.73 |
|
|
Widowed |
14 |
6.06 |
|
|
Total |
231 |
100 |
|
Source: Own survey, 2024
The socioeconomic profile of the respondents indicates that the average age of the household heads is 43.7 years (Table 4), with a standard deviation of 11.5, suggesting a predominantly middle-aged farming population. The average family size, measured in adult equivalents, is 3.3 members (SD = 1.15). Furthermore, the households possess a mean of 2.8 years of specific experience in head cabbage production (SD = 1.53), reflecting the level of practical knowledge within the study area.
Table 4: Summary of Continuous Socioeconomic Variables
|
Variables |
Mean |
Std. Dev |
|
Age |
43.7 |
11.5 |
|
Family size |
3.3 |
1.15 |
|
Farm experience |
2.8 |
1.53 |
Source: Own survey, 2024
As indicated in the Table 5, the total owned land size of the sampled households ranges from a minimum of 0.5 hectares to a maximum of 3.5 hectares, with an average holding of 1.77 hectares (SD = 0.54). This suggests that most farmers in the district operate on a small-scale basis.
Beyond owned land, households also participate in land-sharing arrangements to adjust their production capacity. The mean shared-in land was 0.26 hectares, while the mean shared-out land was slightly higher at 0.53 hectares. Regarding the specific crop of interest, the area allocated for head cabbage production during the production year varied between 0.25 and 1.0 hectare, with an average allocation of 0.33 hectares (SD = 0.16). This limited allocation relative to total land size indicates that while head cabbage is a significant crop, it is produced alongside other agricultural activities.
Table 5: Land Ownership
|
Variable |
Minimum |
Maximum |
Mean |
Std. Dev |
|
Total owned land |
0.5 |
3.5 |
1.77 |
0.54 |
|
Shared-in land |
0 |
1 |
0.26 |
0.32 |
|
Shared-out land |
0 |
0.75 |
0.53 |
0.15 |
|
Land allocated for head cabbage |
0.25 |
1 |
0.33 |
0.16 |
Source: Own survey, 2024
Access to Support Services
Provision of adequate services for communities enhances overall socioeconomic development and individual well-being. These services are instrumental in improving production, productivity, and the subsequent volume of market supply. In the context of head cabbage production and marketing in the study area, access to market information and frequency of extension contact are identified as critical support services.
Access to Market Information
Access to agricultural markets and reliable information is essential for promoting competitive markets and fostering development in the agricultural sector. A well-organized market intelligence system facilitates free interaction between producers and traders to determine fair prices. The survey indicates that producers rely on several informal sources for information. The most significant source is neighboring farmers, utilized by 39.89% of respondents, followed by personal observation (33.71%) and traders (25.28%) (Table 6). Interestingly, despite the rise of digital technology, only 1.12% of farmers cited the telephone as their primary source of market information.
Frequency of Extension Contact
Extension services are indispensable for providing farmers with assistance to improve production and productivity while facilitating the transfer of scientific findings into practical application. Regarding the frequency of contact with Development Agents (DAs), the study found that 39.33% of farmers have weekly contact, and 29.78% have contact once every two weeks (Table 6). However, a notable 17.42% of respondents reported having no formal program or contact with extension services, which may limit their access to modern agricultural knowledge and innovations.
Table 6: Access to Services of Sampled Households
|
Variables |
Category |
Percent (%) |
|
Extension Contact Frequency |
Weekly |
39.33 |
|
Once in two weeks |
29.78 |
|
|
Monthly |
10.67 |
|
|
Twice in the year |
1.69 |
|
|
Anytime when asked |
1.12 |
|
|
No program |
17.42 |
|
|
Source of Market Information |
Traders |
25.28 |
|
Personal observation |
33.71 |
|
|
Telephone |
1.12 |
|
|
Neighboring farmers |
39.89 |
Source: Own survey, 2024
Demographic Characteristics of Traders
The demographic profile of the 26 sampled traders provides essential insights into the human capital and social structure of head cabbage marketing in the study area (Table7). Age is a key factor in describing the experience and networking capabilities of traders, with the survey revealing an average age of 34.54 years. In terms of professional experience, traders have spent an average of 6.42 years in the cabbage trade.
The gender distribution indicates a strong male dominance in the trading sector, as 92.31% of respondents were male, compared to only 7.69% female. Regarding marital status, 65.38% of the interviewed traders were married, while the remaining 34.62% were single. Notably, the educational profile indicates that all sampled traders have some level of formal schooling, with no illiterate individuals recorded in this group. Specifically, 61.54% reached primary education, 30.77% attended secondary school, and 7.69% attained a college-level education or above.
Table 7: Demographic Characteristics of Traders
|
Variables |
Measurement (N=26) |
Value/Percent |
|
Age |
Mean |
34.54 |
|
Experience (years) |
Mean |
6.42 |
|
Gender (%) |
Male |
92.31 |
|
Female |
7.69 |
|
|
Education (%) |
Illiterate |
0 |
|
Primary |
61.54 |
|
|
Secondary |
30.77 |
|
|
College and above |
7.69 |
|
|
Marital Status (%) |
Single |
34.62 |
|
Married |
65.38 |
Source: Own survey, 2024
Market Chain Actors and Their Activities
The market chain for head cabbage in the study area involves a series of actors who facilitate the movement of the product from input supply to final consumption. The primary actors identified in the head cabbage marketing channel include producers, rural collectors, wholesalers, and retailers, supported by various institutional service providers.
Head Cabbage Marketing Channels
Marketing of head cabbage occurs at the farm gate, local markets, and zonal markets, with prices determined through negotiations between traders and farmers based on visual grading and buyer preferences. Out of the total 2,221 quintals produced by the sampled respondents, approximately 1,617 quintals were supplied to various buyers. Over 90% of this supply was purchased by semi-wholesalers and subsequently transferred to urban wholesalers for the Arba Minch markets.
The primary buyers from producers include wholesalers (84.36%), rural collectors (9.68%), and other end users (1.36%). The study identified five main alternative marketing channels (Figure 1):
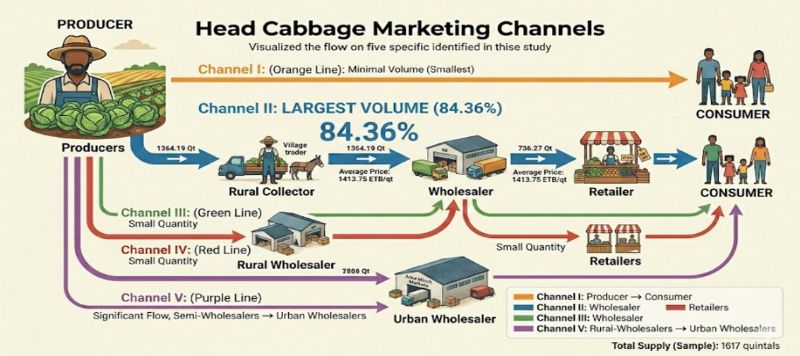
Figure 1: Head Cabbage Marketing Channels
Source: Own survey, 2024 and created with the help of Gemini.
Channel II is the most significant, carrying the largest volume of the product at 1,364.19 quintals (84.36% of the total supply) with an average price of 1,413.75 ETB/qt. In contrast, Channels VII, III, IV, and I carried the smallest quantities of the product.
Head Cabbage Production and Marketing: Opportunities and Constraints
A systematic analysis of the head cabbage sector involves identifying the problems and prospects that exist across the entire market chain—from input supply to the marketing of the final product. Addressing these factors at every stage is essential for upgrading the sector and ensuring efficient value chain development. Insights gathered from focus group discussions (FGD) and key informant interviews highlight the specific factors currently shaping the industry in the study area.
Head Cabbage Production Opportunities
The study area possesses several key advantages that facilitate the expansion of head cabbage production. According to data obtained through FGDs, the most significant opportunity is the high market demand for fresh head cabbage, cited by 27% of respondents (Table 8). This is closely followed by favorable climatic conditions (25%), which provide a natural foundation for quality cultivation. Other notable opportunities include the expansion of seed suppliers in the district (18%), the cultural preference for fresh food (11%), and the availability of farming advice and extension services (7%).
Table 8: Opportunities Improving Head Cabbage Production
|
Production Opportunities |
% of Respondents |
Rank |
|
High market demand for fresh head cabbage |
27 |
1 |
|
Favorable climatic conditions |
25 |
2 |
|
Expansion of seed suppliers in the study area |
18 |
3 |
|
Cultural preferences for fresh food |
11 |
4 |
|
Existence of farming advice extension services |
7 |
5 |
Source: Own survey, 2024
Head Cabbage Production Constraints
A systematic analysis of the production sector reveals several bottlenecks that hinder the growth of the head cabbage market chain in the study area. Based on focus group discussions (FGDs) and farmer responses, lack of infrastructure was identified as the most significant constraint, affecting 20% of respondents. This is followed closely by the high quality requirement of the product (19%), which poses a challenge for smallholder producers (Table 9). Other critical barriers include high post-harvest losses (13%), disease and pest infestations (12%), and the high cost of inputs such as fertilizers and pesticides (11%). Additionally, factors like distance to market, land shortages, and the lack of quality seeds continue to limit production potential.
Table 9: Constraints Hindering Head Cabbage Production
|
Production Constraints |
% of Respondents |
Rank |
|
Lack of infrastructure |
20 |
1 |
|
High quality requirement of the product |
19 |
2 |
|
High post-harvest loss |
13 |
3 |
|
Disease and Insects/pests |
12 |
4 |
|
High cost of inputs (fertilizer, pesticides, etc.) |
11 |
5 |
|
Distance to the market |
10 |
6 |
|
Shortage of land |
8 |
7 |
|
Lack of quality seed and inadequate input supply |
7 |
8 |
Source: Own survey, 2024
Head Cabbage Marketing Opportunities
The assessment of the marketing environment identifies several favorable conditions that support the trade of head cabbage in the study area. According to the survey data, the availability and high production volume of head cabbage in the region is the primary marketing opportunity, cited by 43% of respondents (Table 10). Additionally, the high market demand and availability of buyers (36%) alongside the cultural preference for fresh food (21%) provide a strong foundation for a vibrant marketing sector. These factors suggest a significant potential for producers to increase their market participation if the existing supply chains are optimized.
Table 10: Opportunities Improving Head Cabbage Marketing
|
Marketing Opportunities |
% of Respondents |
Rank |
|
Availability and high production of head cabbage in the area |
43 |
1 |
|
High market demand and availability of buyers |
36 |
2 |
|
Cultural preferences for fresh food |
21 |
3 |
Source: Own survey, 2024
Head Cabbage Marketing Constraints
The marketing phase of the head cabbage value chain faces several significant hurdles that impact the profitability and efficiency of the trade. According to the study findings, poor road facilities were ranked as the primary constraint by 41% of respondents (Table 11), highlighting the logistical difficulties in transporting perishable produce to market centers.
Price fluctuation (20%) and the seasonality of production (15%) also represent major challenges, creating economic instability for both producers and traders. Additional barriers include a shortage of capital, high post-harvest losses, and general infrastructure deficits, all of which limit the growth of the sector.
Table 11: Constraints Hindering Head Cabbage Marketing
|
Market Constraints |
% of Respondents |
Rank |
|
Poor road facility |
41 |
1 |
|
Price fluctuation |
20 |
2 |
|
Seasonality of the production |
15 |
3 |
|
Shortage of capital |
9 |
4 |
|
High post-harvest loss |
6 |
5 |
|
Poor infrastructure |
5 |
6 |
|
High quality requirement of the product |
4 |
7 |
Model Diagnostic and Post-Estimation Tests
To ensure the statistical validity and reliability of the estimated parameters, several diagnostic tests were performed on Cragg’s double hurdle model. The presence of multicollinearity among the eleven independent variables was assessed using the Variance Inflation Factor (VIF), which yielded a mean value of 1.38. Since this is substantially lower than the common threshold of 10, the results indicate that the explanatory variables are independent and the model is free from multicollinearity issues. Furthermore, a 'linktest' was employed to evaluate the functional form and model specification for the first hurdle. The test resulted in a non-significant ‘_hatsq’ probability of 0.353, confirming that the model is correctly specified and that no significant explanatory variables were omitted. Additionally, to account for potential heteroscedasticity inherent in cross-sectional household data, robust standard errors were utilized. This adjustment ensures that the standard errors, z-statistics, and p-values remain unbiased, providing a robust basis for hypothesis testing and inference regarding head cabbage market participation and supply intensity.
Factor Affecting Decision to Head Cabbage Market Participation
By using Cragg’s double hurdle model eleven independent variables were fitted the model to see whether they influence the producer decision to participate in head cabbage marketing. Out of these variables, six variables have a significant effect on head cabbage market participation at 5% and 10% significance levels (Table 12).
Education Status (β= 0.774, P=0.041) is positively and statistically significant ⸺Higher formal schooling enhances a farmer's ability to process market information and adopt commercialization strategies. This aligns with Sani et al. (2020), who noted education improves risk management in Ethiopia, and is further supported by Urge et al. (2023) and Mekonnen et al. (2021), who found that education significantly reduces transaction costs for vegetable farmers in rural Ethiopia.
Market Experience (β= 0.045, P=0.043) is positively and statistically significant ⸺Seasoned farmers benefit from established networks with traders. This is consistent with Abate et al. (2019), who identified experience as a key driver for reducing trade risks, as well as findings by Addisu (2020) and Zewdie et al. (2021), which emphasize that experience fosters trust-based relationships in Ethiopian vegetable value chains.
Family Size (β = 0.497, P=0.044) is positively and statistically significant ⸺The importance of labor availability is highlighted for labor-intensive crops like head cabbage. This mirrors Tufa et al. (2014), and is corroborated by Berhanu and Mamo (2020) and Dessie et al. (2026), who indicate that larger households in Ethiopia can better allocate labor for the meticulous harvesting and post-harvest handling required for perishables.
Table 12: Cragg’s Hurdle Regression Results of Head Cabbage Market Participation
|
Head cabbage market participation |
Coef. |
Robust Std. Err. |
Z |
P>Z |
|
Sex of the household head |
0.3383114 |
.0579143 |
0.37 |
0.715 |
|
Education status of the household |
0.7740282 |
.0287391 |
2.05 |
0.041** |
|
Family size |
0.4975655 |
.0202195 |
1.93 |
0.044** |
|
Land holding size |
0.8125001 |
.0204013 |
2.09 |
0.036** |
|
Total amount of head cabbage produced |
0.3403579 |
.0101861 |
1.44 |
0.027** |
|
Available of market information |
1.02585 |
.0518852 |
1.26 |
0.207 |
|
Market distance |
-0.0892799 |
.0044119 |
-1.16 |
0.024** |
|
Market experience |
0.0450178 |
.0044224 |
0.46 |
0.043** |
|
Use of credit |
-0.6562313 |
.0438191 |
-1.01 |
0.312 |
|
Constant |
-4.693989 |
.1140785 |
-2.88 |
0.004 |
The value ***, ** and * represents level of statistical significance at 1%, 5% and 10%, respectively.
Land Holding Size (β = 0.812, P=0.036) is positively and statistically significant ⸺Total land size positively influences market entry as it allows for surplus production. This is corroborated by Degye et al. (2013), alongside recent studies by Jaleta et al. (2021) and Amelework (2023), which identify land endowment as a fundamental prerequisite for commercial transition among Ethiopian smallholders.
Total Amount Produced (β = 0.340, P=0.027) is positively and statistically significant ⸺Higher productivity levels directly increase the likelihood of becoming a seller. This aligns with the findings of Kuma et al. (2019) and Efa et al. (2020), who found that productivity gains are the primary drivers of vegetable commercialization in the Ethiopian highlands.
Market Distance (β= -0.089, P=0.024) is negatively and statistically significant ⸺Increased distance to market centers acts as a structural barrier by raising transportation costs. This common finding in Ethiopian literature, such as Gebremedhin and Jaleta (2010), is further validated by Weldemariam (2022) and Desta et al. (2024), who cited poor rural infrastructure as a persistent bottleneck to market integration for vegetable producers in Southern Ethiopia.
Factor Affecting Quantity of Head Cabbage Supply
By using Cragg’s double hurdle model ten independent variables were fitted the model to see whether they influence the quantity of head cabbage supply marketing. Out of these variables, seven variables have a significant effect on head cabbage market participation at 5% and 10% significance levels (Table 13).
The sex of the household head (β= 2.905, P=0.045) significantly influences the volume of supply, with male-headed households typically supplying larger quantities. This disparity is often attributed to systemic advantages in accessing productive assets, transport, and market networks, a finding corroborated by Hegena (2022), Tura and Hamo (2018), and Efa et al. (2024), who noted that gender dynamics significantly dictate the scale of vegetable marketing in Ethiopia. Simultaneously, the age of the household head (β= 0.038, P=0.046) has a positive impact on supply intensity. This suggests that older farmers leverage accumulated technical knowledge, social capital, and savings to optimize production, a trend supported by Dessie et al. (2026), Mekonnen et al. (2021), and Sani et al. (2020).
Land holding size (β = 0.796, P=0.040) serves as a fundamental physical constraint; households with more land can achieve the economies of scale necessary for high-volume commercialization. This is supported by Wonduwossen (n.d.), Jaleta et al. (2021), and Degye et al. (2013), who identified land size as a critical asset directly linked to higher sales values for Ethiopian horticultural produce. However, the most powerful predictor in the model is the total quantity of head cabbage produced (β= 1.720, P=0.000). As productivity increases, the marketable surplus grows proportionally, a relationship that Kuma et al. (2019), and Addisu (2020) emphasize as the primary determinant of vegetable supply across Ethiopia.
Table 12: Craggs’ Hurdle Regression Results of Quantity of Head Cabbage Supply
|
Quantity of Head Cabbage Supply |
Coef. |
Robust Std. Err. |
Z |
P>Z |
|
Sex of the household head |
2.905275 |
1.717997 |
0.95 |
0.045** |
|
Age of the household head |
0.038755 |
0172777 |
-2.24 |
0.046** |
|
Family size |
-1.345662 |
.7559726 |
-1.26 |
0.206 |
|
Land holding size |
.796318 |
1.152097 |
-0.83 |
0.04** |
|
quantity of head cabbage produced |
1.720643 |
.6782799 |
3.56 |
0.000*** |
|
Availability of market information |
4.365439 |
1.396739 |
1.79 |
0.034** |
|
Market distance |
-.2006761 |
.0694243 |
0.92 |
0.007** |
|
Use of credit |
-2.433722 |
1.112293 |
-1.22 |
0.02** |
|
Availability of training |
1.938926 |
1.472558 |
0.85 |
0.396 |
|
Frequency of extension service |
.3274133 |
.4800145 |
0.33 |
0.741 |
|
_Cons |
-6.40848 |
3.525941 |
-0.98 |
0.325 |
The value ***, ** and * represents level of statistical significance at 1%, 5% and 10%, respectively
Source: STATA Output, 2024
The availability of market information (β= 4.365, P=0.034) provides a significant boost to supply intensity, as informed farmers can better navigate price fluctuations and time their sales for maximum profit. This mirrors the findings of Hegena (2022), Abate et al. (2019), and Urge et al. (2023), who argue that information access is a major driver of how much produce smallholders bring to market. Conversely, market distance (β= -0.200, P=0.007) acts as a strong deterrent; the perishable nature of cabbage makes long-distance transport costly and risky, thereby reducing the volume households are willing to supply. This structural barrier is validated by Gebremedhin and Jaleta (2010), Weldemariam (2022), and Desta et al. (2024). Finally, the use of credit (β= -2.433, P=0.020) showed a negative relationship, potentially indicating that high repayment burdens or the diversion of funds to non-agricultural needs can limit reinvestment in production. This highlights the need for effective rural finance systems, as noted by Zewdie (2013), Berhanu et al. (2024), and Tufa et al. (2014), to ensure credit serves as a catalyst for productivity rather than a constraint.
Conclusion
The head cabbage value chain in the study area exhibits strong production potential driven by high availability (43%) and robust market demand, yet it remains hindered by critical structural bottlenecks. While cultural preferences for fresh produce create a solid marketing foundation, these opportunities are severely undermined by poor road facilities (41%) and significant price fluctuations (20%), which serve as the primary constraints to market efficiency. Secondary challenges, including the inherent seasonality of production, high post-harvest losses, and limited capital, further restrict the profitability and commercial growth of smallholder producers in the region.
The transition from subsistence to commercial participation is dictated by a household’s human capital and resource endowments, as evidenced by the first stage of the Cragg’s Hurdle model. Higher education (β= 0.774) and prior marketing experience significantly increase the probability of market entry by improving a farmer's ability to interpret market signals, while larger family sizes (β= 0.497) provide the intensive labor necessary for managing perishable crops. Furthermore, land holding size (β= 0.812) and total production volume (β = 0.340) act as essential prerequisites for creating a marketable surplus, whereas long market distances (β= -0.089) serve as a major deterrent due to increased travel time and costs.
For households already participating in the market, the intensity of supply is heavily influenced by productivity and institutional support. The total quantity produced (β = 1.720) is the most powerful driver of supply volume, while the availability of market information (β= 4.365) allows farmers to time their sales effectively to reduce transaction risks. However, infrastructural friction from market distance (β= -0.200) continues to suppress supply volumes, and the use of credit (β= -2.433) unexpectedly shows a negative relationship, suggesting that current credit terms or the diversion of funds may be hindering production. To translate the area's comparative advantage into economic gain, targeted interventions must focus on enhancing rural roads, establishing real-time market information systems, and providing tailored financial services.
Recommendation
To enhance market integration and productivity for smallholder cabbage farmers, a comprehensive approach is required that addresses infrastructural, institutional, and technical barriers. Local authorities should prioritize the rehabilitation of feeder roads to mitigate the high transportation costs and post-harvest losses associated with long market distances, while simultaneously establishing digital or community-based information platforms to provide the real-time price data necessary for farmers to navigate market volatility. Furthermore, agricultural extension services must transition toward a market-oriented model—incorporating training on commercial bargaining and post-harvest handling—and ensure that support is equitably tailored to address the resource gaps faced by female-headed and younger households. Finally, increasing access to productivity-enhancing inputs like high-yield seeds is essential for creating a commercial surplus, but this must be paired with reformed, flexible credit products specifically aligned with the cabbage production cycle to ensure financial resources are effectively reinvested into the farm.
Limitations of the Study
While this research offers a robust analysis, several inherent constraints define its scope and the applicability of its conclusions. Geographically, the study was localized to the Bonke District, which restricts the ability to generalize the findings to a national scale or to regions with different administrative frameworks. The vast diversity of Ethiopia’s agro-ecologies and institutional capacities means that the results may not be directly applicable to areas with varying environmental or organizational structures. Additionally, the study was subject to temporal and spatial limitations, as well as infrastructure challenges, which prevented a broader longitudinal or cross-regional analysis. Consequently, the data is most representative of the specific sample of households and market actors within the unique local dynamics present during the period of data collection.
Authors’ Contribution
H. Goshme led the study's conceptualization and drafting, while T. Alehegn, G. Katola, B. Admassu, A. Deginew, and E. Ayaye contributed to data collection, manuscript revision, and academic supervision, with all authors approving the final version.
Acknowledgements
The authors extend their gratitude to the Bonke District agricultural experts for their invaluable assistance during the field trials. We also acknowledge the use of Gemini, an AI collaborator, for its assistance in refining the language quality, ensuring technical clarity, and assisting with the structural formatting of this manuscript.
Funding
This research was financially supported by Arba Minch University, which provided the necessary funding to facilitate the research activities and data collection associated with this study.
Conflicts of Interest
The authors declare that there are no potential conflicts of interest regarding the research, authorship, or publication of this article.
Data Availability Statement
The datasets generated and analyzed during this study are available from the corresponding author upon reasonable request.


Open Access By Aditum Open Access Journals id licensed under Creative Commons Attribution 4.0 International License. Based On a Work at aditum.org