Clinical Cardiology Interventions
OPEN ACCESS | Volume 6 - Issue 1 - 2026
ISSN No: 2836-077X | Journal DOI: 10.61148/2836-077X/JCCI


Sunday Ogheneruemu Samson1, Micheal Abimbola Oladosu2, Moses Adondua Abah3*, Oyeyemi Adeyemi1, Daniel Oyedemi4, Aham Christopher5, Aisha Umar Danlami6, Chukwuemeka Valentine Osondu7, Joshua Richard Akacha8, Njoku Leticia Oluomachi9, Michael Unekwuojo Attah10, John Babajide Akinyanju11, Alhassan Alabani12
1Department of Environmental Science, College of Science, Federal University of Petroleum Resources Effurun, Nigeria
2Department of Biochemistry, Faculty of Basic Medical Sciences, University, of Lagos, Akoka, Nigeria.
3Department of Biochemistry, Faculty of Biosciences, Federal University Wukari, Taraba State, Nigeria.
4Department of Emergency Medicine, Warrington and Halton NHS Foundation Trust, Chesire, England.
5Department of Zoology and Environmental Biology, University of Nigeria, Nsukka, Enugu State, Nigeria.
6Department of General Studies, Niger State School of Health Technology, Niger State, Nigeria.
7Department of Microbiology, School of Biological Sciences, Federal University of Technology, Owerri, Imo State, Nigeria.
*Corresponding author: Moses Abah Adondua, 3Department of Biochemistry, Faculty of Biosciences, Federal University Wukari, Taraba State, Nigeria.
Received: April 05, 2025 Accepted: April 12, 2025 Published: April 16, 2025
Citation: Sunday Ogheneruemu Samson, Micheal Abimbola Oladosu, Moses Adondua Abah, Oyeyemi Adeyemi, Daniel Oyedemi, (2025) “Evaluation of Cardiotoxic Impact of Petroleum Vapors on Albino Wistar Rats.” journal of clinical cardiology interventions, 5(1). DOI: 10.61148/2836-077X/JCI /055
Copyright: © 2025 Moses Abah Adondua. This is an open access article distributed under the Creative Commons Attribution License, which permits unrestricted use, distribution, and reproduction in any medium, provided the original work is properly cited.
The use of gasoline in industries and homes has rapidly increased in recent times. In the course of usage, individuals are frequently exposed to pollutants from gasoline fuel in both outdoor and indoor environments through different exposure pathways such as; ingestion, dermal and inhalation pathways. Accumulation of these toxicants in the body system may pose deleterious health challenges. This study aimed at investigating the impact of petrol, kerosene and diesel vapour on the heart status of albino wistar rats. A total of thirty-six (36) albino rats (Rattus novergicus) were obtained from the animal holding of the Department of Anatomy, University of Benin, Benin-City, Nigeria, and were allowed to acclimatized for seven (7) days prior to the commencement of the experiment. The experimental animals were kept inside 4 plastic cages containing 9 animals each and were fed ad libitum with commercial rat chow throughout the experiment period. Group 1 rats represented the control which were not exposed to petrol vapour. They were fed for 14 days. Group 2 rats were exposed to 5ml petrol vapour for 30mins every day for 14 days. Group 3 rats were exposed to 5ml kerosene vapour for 30mins every day for 14 days. Group 4 rats were exposed to 5ml diesel vapour for 30mins every day for 14 days. Biochemical and haematological parameters were assayed for following the dissection of the rats. One way Analysis of Variance (ANOVA) was used to analyze the data obtained in this study. The result of growth response of experimental rats exposed to vapor of petroleum products revealed that the gain in body weight at the end of the experiment was found to be 28±5, 15±3, 5±1 and -6±1g for Groups 1, 2, 3 and 4 respectively. Generally, haematological property of rats in Group 1 was significantly different (p≤0.05) from those of Groups 2, 3 and 4. Significant difference (p≤0.05) of haematological properties among Groups 2, 3 and 4 also existed, however, PCV and WBC of Groups 3 and 4 were found not be significantly different (p≥0.05). RBC, Hb, MCV, MCH, MCHC and Packed Cell Volume (PCV) of Group 1 were noted to be about 2 folds that of Group 4. Activities of AST of rats of Groups 2 and 3 were not significantly different (p≥0.05) but significantly lower than Group 1 and significantly higher than that of Group 4. Similarly, activities of ACP and LDH were found to follow the same pattern. ALT activity of Group 1 was about two folds that of the other treatment groups. MDA level of Group 4 was about 5 folds that of Group 1, 3 folds that of Group 2 and 2 folds that of Group 3. The present study also revealed that the heart was affected when exposed to vapour of diesel, kerosene and petrol as evident by diminished enzyme activity (ALT, AST, ALP, ACP, GGT, LDH, SOD, CAT) and abnormal levels of oxidative indices (MDA, GSH).
List of Abbreviations:
-Packed Cell Volume (PCV);
- White Blood Cells (WBC);
- Red Blood Cells (RBC);
- Aspartate Transaminase (AST);
-Alanine Transferase (ALT);
- Alkaline Phosphatase (ALP);
- Superoxide Dismutase (SOD);
- Catalase (CAT);
- Lactate Dehydrogenase;
- Gamma-glutamyl Transferase;
- Malondialdehyde (MDA);
- Acyl Carrier Protein (ACP);
- Glutathione (GSH);
- Haemoglobin (Hb);
- Mean Corpuscular Hemoglobin Concentration (MCHC);
- Mean Corpuscular Volume (MCV);
- Mean Corpuscular Hemoglobin (MCH)
Introduction
Crude oil is a complex mixture of diverse chemicals, some volatile and some water soluble. This complex mixture comprises of hundreds of chemicals including some straight chained hydrocarbons, branched hydrocarbons, aromatic compounds, and naphthenes, as well as polynuclear aromatic hydrocarbons (Nihad et al., 2011). When crude oil is refined in a number of processes, the crude oil is converted into refined petroleum products. Thus, refined petroleum products result when crude oil is split into fractions such as petrol, kerosene, diesel fuel, motor engine oil and many other petroleum products by a process of fractional distillation (Kobeticova et al., 2012). Crude oil and its refined products can be released into the environment from a number of sources, which can pollute both land and water. Crude oil which has accumulated underground can reach the surface if not contained by impermeable rock. Apart from this release of crude oil, the main sources of crude oil and refined petroleum products such as petrol, kerosene, diesel, motor engine oil, released on land comes from the disposal of waste motor oil, the leaking of storage tanks, and other spillages and accidents during the transportation of crude oil and other petroleum-based products such as kerosene. The spill arising from crude oil and refined petroleum products such as petrol, kerosene etc. is becoming a visible problem in our ecosystem. These contaminants may contain component that may be toxic to the nitrifying bacteria and as a result may display some level of toxicity on the growth of nitrifying bacteria indigenous to the soil thereby affecting their activities in the soil. It may be possible, also, that these contaminants may also affect the two stages of the nitrification process.
In the course of using crude petroleum products, individuals are frequently exposed to pollutants from gasoline fuel in both outdoor and indoor environments through different exposure pathways such as; ingestion, dermal and inhalation pathways (Martins et al., 2024). However, the major route of exposure is via inhalation (Iheanacho et al., 2024). It has been demonstrated that after inhalation of substantial concentrations of petroleum vapour through chronic exposure, lower concentrations of saturated hydrocarbons are detected in human and animal blood than that of the unsaturated aromatic hydrocarbons (Zahlsen et al., 1993; Silas et al., 2023). Some of the immediate symptoms resulting from exposure to petroleum would include difficulty breathing, nausea, headaches, dizziness in relatively healthy people, but those with conditions such as allergies, and asthma would be affected even more and their health problems significantly exacerbated (Habibu et al., 2023). Effects presenting later could result in long-term effects on the respiratory, immune, nervous, and reproductive systems and may even result in birth defects and cancers (Ife et al., 2024). Endocrine disruption, DNA damage, damage to the developing fetus, blood disorders, and mutations have all been shown to result from exposure to the components of crude oil. Petroleum inhalation has also been reported to be associated with dysfunctions that range in severity from subtle cognitive impairment to encephalopathy and death (Cairney et al., 2002; Habibu et al., 2024)). Ueng et al. (1998) reported that exposure of rats to motorcycle exhaust and organic extracts of the exhaust particulate caused a dose- and time-dependent increase in cytochrome P-450-dependent monoxygenases and glutathione-S-transferase in the liver, kidney and lung microsomes. Since kerosene, diesel and petrol contain some of these constituents, chronic or frequent exposure to their fumes may affect the normal liver, lungs, kidney, brain and even the blood functions. Biological monitoring of exposure to bitumen fumes during road-paving operations indicated urinary excretion of 1-hydroxypyrene and thioethers in the exposed workers (Burgaz et al., 1992).
Despite the high utilization of kerosene, diesel and petrol, our knowledge is sparse on the toxicological effects of inhaling the composite fumes evaporating from kerosene, diesel and petrol. As a result of this, our study aimed at investigating the impact of petrol, kerosene and diesel vapour on the heart status of albino wistar rats.
Materials and Method
Chemicals/Reagents
Chemicals/reagents and solvents used for this study’s analyses were of analytical grade and are products of British Drug House, Poole, England. The petroleum products used for study were: Petrol/gasoline, diesel, and kerosene. They were purchased from Matrix Filling Station, along Petroleum Training Institute (P.T.I) Road. Effurun, Delta State. Nigeria.
3.3 Experimental Animals and Treatments
A total of thirty-six (36) albino rats (Rattus novergicus) were obtained from the animal holding of the Department of Anatomy, University of Benin, Benin-City, Nigeria, and were allowed to acclimatized for seven (7) days prior to the commencement of the experiment. The experimental animals were kept inside 4 plastic cages containing 9 animals each. The experimental rats were fed ad libitum with commercial rat chow throughout the experiment period. The rats were classified into 4 groups as presented below:
Table 1. Experimental design
|
Group |
Treatment |
Period of Treatment |
|
1 |
Control |
14 days |
|
2 |
Rats exposed to petrol vapour (5ml for 30mins every day) |
14 days |
|
3 |
Rats exposed to kerosene vapour (5ml for 30mins every day) |
14 days |
|
4 |
Rats exposed to diesel vapour (5ml for 30mins every day) |
14 days |
Anaesthetisation of Animals and Isolation of Tissues
The rats were anaesthetized by placing them in a jar containing cotton wool soaked with chloroform before being sacrificed by jugular puncture, and were quickly dissected and the whole liver, kidney, lungs, brain and heart were excised, freed of fat, blotted with clean tissue paper and weighed into a beaker containing ice cold normal saline solution. The blood was obtained through cardiac puncture. A portion of the blood was collected in heparinised bottles and others in non heparinised bottles. Some blood samples in non heparinized bottles were thereafter centrifuged at 3,500 rpm for about 15 min using refrigerated centrifuge RC650s and the serum samples obtained were preserved at-8oC until required for analyses.
Preparation of Homogenate
The isolated tissues were weighed and a portion of each tissue was cut out, chopped into very small pieces and then homogenized using pre-cooled pestle and mortar in a bowl of ice cubes. The tissue homogenates were diluted using normal saline solution to the tune of 1 in 30 dilutions. A portion of each organ was homogenized for biochemical studies and enzyme assays. The diluted homogenates were stored at temperature of -8oC until required for use.
Determination of Haematological Parameters
Estimation of haemoglobin levels
Haemoglobin concentration of the blood of experimental animals was determined following the method described by Mitruka and Rawnsley (1977). Blood samples (0.02cm3) from the animals were added to 5ml of Drabkin’s solution containing 200mg of potassium ferricyanide, 50mg of potassium cyanide and 1g of sodium hydrogen-carbonate in 1liter of distilled water. It was incubated for 15 minutes at room temperature. The absorbance of the solution was read against a blank on a spectrophotometer at the wavelength of 540nm.
Estimation of Red Blood Cell (RBC) count
Manual erythrocyte counting method was used to estimate the red blood cell count of the blood samples (Mutheyya, 2002). The counting chamber called haemocytometer was filled with an RBC dilution (2ml of well mixed anticoagulant blood sample and 4 ml of diluting fluid was then placed on the microscope stage and allowed to stand for 2 minutes before commencing the count. For the final result to be expressed as the number of cells per litre, the following calculation is used:
Red Cell Count = N * DF * 106
A * D
Where N is the number of cells counted
DF is the dilution factor
106 converts to cells per litre
A is the area of chamber counted
D is the depth of chamber
Packed Cell Volume (PCV) estimation
The microhaematocrit method was employed for this estimation. Blood samples were drawn two thirds of the way up a standard 75 mm * 1.00 microhaematocrit capillary tube through capillary action. One end of the tube was sealed by heeling (or physically with plasticine). It was then placed in a microhaematocrit. An haematocrit reader was used to determine the PCV by measuring the height of the erythrocyte column and expressing it as a fraction of the height of the total blood column.
PCV = Height of packed cell column
Height of whole blood column
Estimation of White Blood Cell (WBC) count
Manual counting method was used for the estimation of WBC count (Muthayya, 2002). 0.05 ml of blood was mixed with 0.95 ml of Turck’s solution. The Neubauer counting chamber was then filled with the mixture. The WBC was counted from the four corner 1 mm square of the chamber at a magnification of 40. The final WBC count for the whole blood sample was calculated as thus:
White blood cell count = N * DF * 106
A * D
Where N is the number of cells counted
DF is the dilution factor
106 converts to cells per litre
A is the area of chamber counted
D is the depth of chamber
Estimation of platelet count
The method described by Bauer (1976) was used for platelet count estimation. Blood was mixed with the Rees-Ecker diluting fluid (1:200) and then put in a standard counting chamber. The platelets were counted in the finely ruled centre area of each chamber.
Estimation of differential leucocyte count
The manual counting method was used to estimate differential leucocyte count as described by Muthayya (2002). A drop of the blood sample was smeared on a clear grease free slide using spreader. The film was rapidly dried in air by vigorously shaking. It was then stained with a Leshman stain. The cells were then counted and the respective counts expressed as percentage of the total. The main types leucocytes identified were basophils, eosinophils, lymphocytes and monocytes.
Determination of Malondialdehyde (MDA) Concentration
MDA concentration in the serum and tissues of experimental rats was determined following the method described by Bird et al. (1982). MDA, formed from the breakdown of polyunsaturated fatty acids, served as a convenient index for determining the extent of the peroxidation reaction. MDA reacted with thiobarbituric acid to give a red complex absorbing light at 535nm.
Calculation:
Malondialdehyde concentration
(MDA units/ml homogenate) = A x V
ξ x U
Where:
A= Absorbance
V= Volume of reaction mixture
ξ= Extinction coefficient
U= Volume of sample
Determination of Reduced Glutathione (GSH) Concentration
GSH concentration in the tissues of experimental rats was determined following the method described by Misra and Fridovich (1972. The reduced form of glutathione comprises in most instances the bulk of cellular non protein sulfyhydryl group. The method was based upon the development of a relatively stable yellow colour when 5,5’- dithiobis (-2-nitrobenzoic acid) Ellman reagent was added to sulfyhydryl compound. The chromophoric product (yellow complex) resulting from the reaction of Ellman reagent with reduced glutathione, 2-nitro-5-thiobenzoic acid was proportional to the concentration of reduced glutathione.
Determination of Superoxide Dismutase (SOD) Activity
SOD activity of the tissues of experimental animals was determined following the method described by Misra and Fridovich (1972). The ability of superoxide dismutase to inhibit the autoxidation of epinephrine at pH 10.2 formed the basis for a simple assay of dismutase. O2- generated from xanthine oxidase reaction caused the oxidation of epinephrine to adrenochrome and the yield of adrenochrome produced per O2- introduced increased with increasing pH and with increasing concentration of epinephrine.
Calculation:
Increase in absorbance per minute = A3 – Ao
2.5
Where:
Ao = absorbance after 30minutes
A3 = absorbance after 150seconds
% inhibition = Increase in absorbance of substrate x 100
Increase in absorbance of blank
1unit of SOD activity was given as the amount of SOD to cause 50% inhibition of the oxidation of adrenaline to adrenochrome during 1minute.
Determination of Catalase Activity
The catalase activity of the tissue homogenate obtained from the experimental animals was determined following the method described by Sinha (1971). Dichromate in acetic acid was reduced to chromic acetate when heated in the presence of H2O2 with the formation of perchloric acid as an unstable intermediate. The absorbance value of the chromic acetate produced was read at 570-610nm on a spectrophotometer. Since dichromate had no absorbance in this region, the presence of the compound in the assay mixture did not interfere with the colorimetric determination of chromic acetate.
Determination of Alkaline Phosphatase (ALP) Activity
The activity of ALP in serum and tissues of experimental rats was determined following the method described by Bessey et al. (1946) as modified by Wright et al. (1972). The amount of phosphate ester that was split within a given period of time was a measure of the phosphatase enzyme activity. P-nitrophenyl phosphate (PNPP) is hydrolysed to p-nitrophenol and phosphoric acid at a pH 10.1. The p-nitrophenol confered a yellowish colour on the reaction mixture and its intensity, measured spectrophotometrically at 400nm gave the measure of the enzyme activity.
Calculations:
Activity (nmol/ml/min) = ∆E/min x 1000 x V x F
18.8 x v x d
Where:
∆E/min = change in absorbance/min
V = total reaction volume in test-tube
F = dilution factor
v = volume of enzyme source
d = length of light path = 1cm
1000 = the factor introduced to enable enzyme activity to be expressed in nmol/min/ml
18.8 = extinction coefficient of paranitrophenol
Specific activity = Activity (nmol/min/ml)
(nmol/min/mg.protein) protein concentration (mg protein /ml)
Determination of Acid Phosphatase (ACP) Activity
Acid phosphatase hydrolyses p-nitrophenyl phosphate (PNPP) to p-nitrophenol and phosphoric acid at a pH 4.5.
Determination of Aspartate Aminotransferase (AST) Activity
The activity of AST in the serum and tissues of experimental animals was determined following the procedure reported by Reitman and Frankel (1957) as modified by Schmidt and Schmidt (1963). Aspartate aminotransferase catalysed the formation of oxaloacetate and glutamate from aspartate and α-ketoglutarate. The unstable oxaloacetate formed was then spontaneously decarboxylated to form pyruvate. The absorbance of the red coloured complex formed from the reaction of pyruvate with p-nitrophenylhydrazine was then read at 546nm on a Spectrophotometer.
Determination of Alanine Aminotransferase (ALT) Activity
The activity of ALT in the serum and tissues of experimental animals was determined following the procedure reported by Reitman and Frankel (1957) modified by Schmidt and Schmidt (1963). Alanine aminotransferase catalysed the formation of pyruvate and glutamate from alanine and α-ketoglutarate. The method measured spectrophotometrically the absorbance of the red coloured complex formed from the reaction between pyruvate and 2,4-dinitrophenylhydrazine.
Determination of Lactate Dehydrogenase (LDH) Activity
The method used for assaying lactate dehydrogenase was based on that of Wroblewski and La Due (1955) in which pyruvate was reversibly reduced to lactate in the presence of nicotinamide adenine dinucleotide (reduced) as co-enzyme. The oxidized form of co-enzyme did not absorb at 340nm while the reduced form absorbed strongly. The reaction was followed by measuring the rate of loss of extinction at 340nm.
Calculation:
One µmole of NADH/ml has an extinction (E) of 6.3 at 340nm in a 1cm light path. Therefore, the change in extinction per min (∆E/min) can be converted to international units (nmole/min/ml).
Activity (nM/min/ml) = ∆E/min x 1000 x 3 x f
6.3 x v x d
Where:
∆E = the change in extinction of the reaction mixture per minute
v = volume of the enzyme source sample
F = Dilution factor
1000 = this factor is introduced so that the enzyme activity can be expressed in
µmole/min/ml or nM/min/ml
3 = final volume of reaction mixture
6.3 = the extinction coefficient of the indicator (NADH)
d = the light path length (1cm).
Specific activity = Activity (nM/min/ml)
Protein conc. (mg protein/ml)
Determination of Glutathione-S-Transferase (GST) Activity
The cytosolic glutathione s-transferase activity was determined spectrophotometrically at 37oc (340nm) by the procedure described by Habig et al. (1974).
Calculation:
GST activity = O.D/min x total reaction mixture volume
9.6 x mg/0.03ml protein
Determination of Gamma Glytamyl Transpeptidase (GGT) Activity
The activity of Gamma glutamyl transpeptidase (GGT) was determined following the method described by Tietz (1987). In this method GGT transfered glycylglycine to L-γ-glutamyl-p-nitroanilide to form L-γ-glutamylglycylglycine and p-nitroaniline.
Calculation:
GGT activity was calculated following formulae described below.
∆A/min x total assay vol x 1000 = U/l GGT
E x lightpath (cm) x sample vol
Where:
∆A/min = Change in Absorbance per minute
1000 = Factor for converting ml to l
E = Molar absorptivity of p-nitroaniline
Statistical Analyses
All numerical results were obtained from the four (4) groups (control and treated). Data obtained were presented as mean ± SEM and subjected to statistical analysis using a one way analysis of variance (ANOVA). Significant difference between the treatment means was determined at 95% confidence level using Duncan’s Multiple range test (1955).
Results
Growth Response of Rats Exposed to Vapour of Petroleum Products
The result of growth response of experimental rats expose to vapor of petroleum products is captured in figure 1 presented below. The gain in body weight at the end of the experiment was found to be 28±5, 15±3, 5±1 and -6±1g for Groups 1, 2, 3 and 4 respectively. Group 4 rats had a lower weight at the end of the experiment relative to the starting weight. The weight gain in Groups 2 and 3 was found to be 53% and 18% relative to Group 1 (Control). The weight of Group 1 rats was significantly higher (p≤0.05) than those of the Groups 2, 3 and 4.
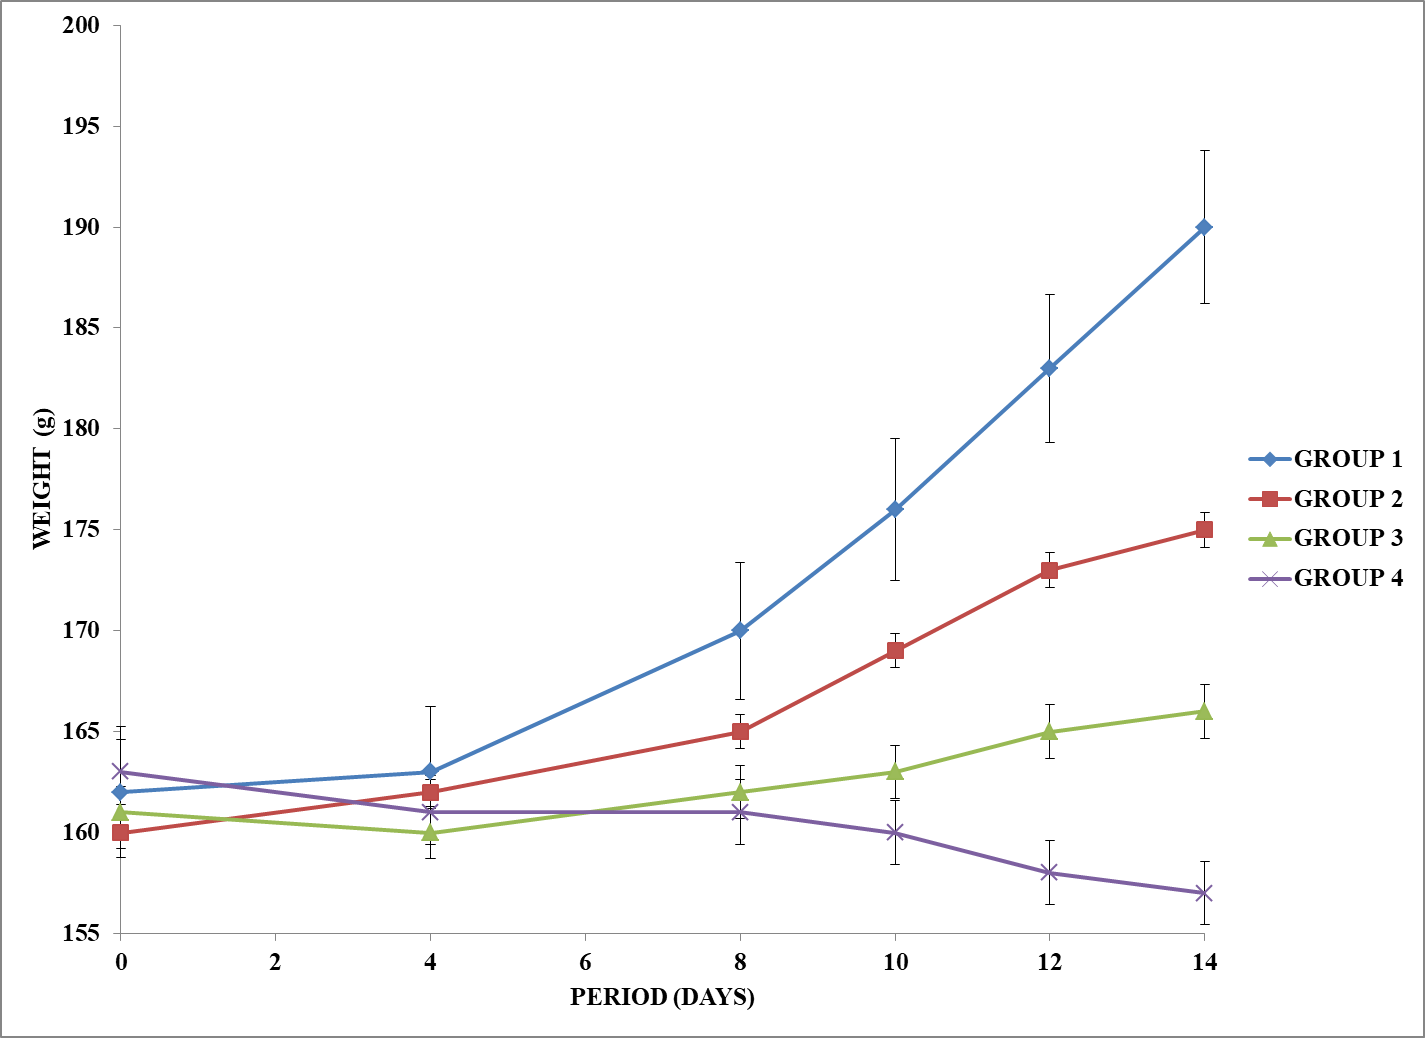
Figure 1. Growth response of rats exposed to vapour of petroleum products
Haematological Assessment of Rats Exposed to Vapour of Petroleum Products
Table 2 shows haematological properties of rats exposed to vapour of petroleum products. Generally, haematological property of rats in Group 1 was significantly different (p≤0.05) from those of Groups 2, 3 and 4. Significant difference (p≤0.05) of haematological properties among Groups 2, 3 and 4 also existed, however, PCV and WBC of Groups 3 and 4 were found not be significantly different (p≥0.05). RBC, Hb, MCV, MCH, MCHC and PCV of Group 1 were noted to be about 2 folds that of Group 4. Worthy of mention is that WBC, neutrophils, eosinophils, basophils, lymphocytes and monocytes of Groups 2, 3 and 4 were significantly (p≤0.05) higher than those of Group 1 rats.
Table 2. Haematological status of rats exposed to vapour of petroleum products
|
Haematological parameters |
Group 1 |
Group 2 |
Group 3 |
Group 4 |
|
RBC (x106/mm3) |
4.20±0.40a |
3.60±0.10 b |
3.10±0.05 c |
2.00±0.05d |
|
Hb (g/dL) |
6.50±0.50 a |
4.90±0.70 b |
3.90±0.50 c |
3.40±0.50d |
|
MCV (µ3) |
88.30±4.00 a |
74.50±2.80b |
62.20±2.00c |
54.00±2.30d |
|
MCH (µµg) |
20.20±0.60 a |
17.30±0.70b |
13.20±1.10c |
9.50±0.40d |
|
MCHC (%) |
25.50±1.70 a |
18.50±1.90b |
12.60±0.90c |
9.60±0.70d |
|
PCV (%) |
28.70±1.50 a |
22.60±1.40b |
15.50±1.60c |
13.10±1.30c |
|
WBC (x103/mm3) |
24.60±0.80a |
28.80±1.20b |
56.70±3.60c |
62.10±3.40c |
|
Neutrophils (%) |
1.90±0.03a |
3.50±0.20b |
9.40±0.80c |
13.20±0.80d |
|
Eosinophils (%) |
0.00±0.00 a |
0.08±0.00b |
0.70±0.01c |
1.10±0.05d |
|
Basophils (%) |
0.07±0.01 a |
0.40±0.01b |
0.90±0.03c |
1.60±0.05d |
|
Lymphocytes (%) |
18.60±0.60a |
25.60±2.30b |
39.60±3.00c |
47.00±2.80d |
|
Monocytes (%) |
15.40±1.00.a |
20.50±1.90b |
28.70±1.80c |
33.60±1.00d |
*Values on the same row bearing different superscripts are significantly different (P<0.05). Tabulated data are means of three (3) determinations ± SEM.
Biochemical Assessment of the Heart of Rats Exposed to Vapour of Petroleum Products
Table 3 presents the specific activity of some enzymes and levels of MDA and GSH of heart of rats exposed to vapour of selected petroleum products. Activities of AST of rats of Groups 2 and 3 were not significantly different (p≥0.05) but significantly lower than Group 1 and significantly higher than that of Group 4. Similarly, activities of ACP and LDH were found to follow the same pattern. ALT activity of Group 1 was about two folds that of the other treatment groups. Noteworthy is that GGT of rats in Groups 3 and 4 was not significantly different (p≥0.05). CAT of Group 1 was 300% that of Group 4, 200% that of Group 3 and 150% that of Group 2. Activity of SOD of Group 1 was found to be about 4 folds that of Group 4, 3 folds that of Group 3 and 2 folds that of Group 2. Level of GSH of Group 1 rats was significantly higher (p≤0.05) than any of the other 3 treatment Groups. Conversely, MDA level of Group 4 was about 5 folds that of Group 1, 3 folds that of Group 2 and 2 folds that of Group 3.
Table 3. Biochemical assessment of the heart of rats exposed to vapour of petroleum products
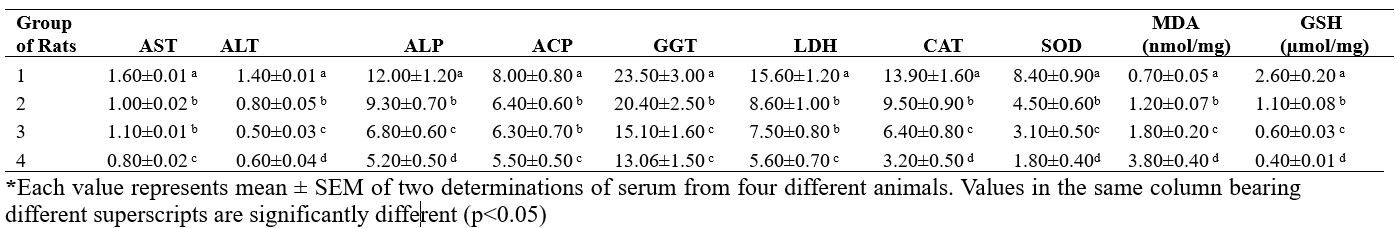
*Each value represents mean ± SEM of two determinations of serum from four different animals. Values in the same column bearing different superscripts are significantly different (p<0.05)
Discussion
The knowledge gained by experiments carried on rats has undoubtedly increased both the length and quality of our lives, an observation that most reasonable people would find difficult to dispute, but it has also benefited rats (Ife et al., 2024). Biomedical sciences’ use of animals as models to help understand and predict responses in humans, in toxicology and pharmacology in particular, remains both the major tool for biomedical advances and a source of significant controversy. Animal models have provided the essential components for research and serve as the source that has permitted the explosive growth of understanding in these fields, with a multitude of benefits to both humans and other animal species (Ayo et al., 2023).
The present study attempted to elucidate the impact of vapour of selected petroleum products on cellular system using rat as a model. The study is novel as it presents experimental evidence such as growth response data, haematological properties and selected serum metabolites of treated rats. We used toxicological approach in this study to unveil the effect and a mechanistic approach to explain the action.
Changes in body weight of experimental animals like rats is often a sensitive indices of toxicity which is readily determined in short-term toxicity tests (Arowora et al., 2024). The pattern of growth curve observed in this study demonstrated density dependent as the rats exposed to diesel vapour (Group 4) lost weight, while the body weight gained by those exposed to petrol vapour (Group 2) was higher than that gained by those exposed to kerosene vapour (Group 3). It could be deduced that vapour of higher hydrocarbon chain petroleum products possibly induces weight loss in rats. Several toxicology studies reported body weight loss as a toxicological response (Adeyemi et al., 2007).
Haematological properties are one of the tools used in toxicology studies for evaluating impacts of xenobiotics (Adeyemi, 2014). The haematology tests routinely performed during toxicology studies evaluate erythrocytes, leukocytes, platelets, and coagulation. We observed mild decreases in RBC count, haemoglobin concentration, and haematocrit of rats in Groups 2. 3 and 4 compared to Group 1. Rats in these three groups also exhibited reduction in body weight gain relative to rats in Group 1. RBC count and haematocrit might or might not be proportionately lower, depending on the cause of the anaemia and whether or not cell size and haemoglobin content are affected. The erythrocyte indexes, MCV and MCHC, measure cell size and haemoglobin concentration. The haematology data from this study is suggestive of haemolysis rather than blood loss to be responsible.
The examination of leukocytes is part of the minimum haematologic database. It includes the
quantitative determination of total and differential WBC counts and the qualitative assessment of cellular morphological abnormalities. The differential WBC count enumerates granulocytes (neutrophils, eosinophils, and basophils), lymphocytes, and monocytes. Increased numbers of these cells are called neutrophilia, eosinophilia, basophilia, lymphocytosis, and monocytosis, respectively (Asuelimen et al., 2024). Neutropenia, eosinopenia, and lymphopenia refer to decreases. The normal cell counts for basophils and monocytes are so low that decreases are difficult to recognize. Relative counts (percentages) for the different types of leukocytes, obtained by doing the differential count, are of little or no value without knowledge of the total WBC count. Neutrophils and lymphocytes are the principle cell types found in peripheral blood, and toxicologic effects on leukocytes usually involve one or both of these cell lines (Arowora et al., 2024). Although primary effects occur, the changes observed are most commonly secondary changes in response to primary toxicity of other tissues or organ systems (Abah et al., 2024). The primary function of the neutrophil is phagocytosis of small particulate matter (e.g., bacteria). The neutrophil is also an integral cellular component of inflammation. It is therefore not unusual to observe neutrophilia secondary to nearly any inflammatory lesion caused by a test material (Asuelimen et al., 2024. Absolute eosinophil, basophil, and monocyte counts are normally very low and quite variable. Increased granulocytes observed in this study suggest that vapour of the petroleum products probably induced cellular morphological abnormalities.
The heart is occasionally a target for toxic compounds. It has been suggested that the heart has reduced protective mechanisms such as superoxide dismutase and catalase. An increasing body of literature suggests that a source of good dietary protein, in addition to containing ample amounts of all essential amino acids plus several other macronutrients with a nutritional value roughly equivalent to that of animal protein of high biological values (Young, 1991) should also have beneficial role in coronary heart disease (CHD) (Anderson et al., 1999; Ife et al., 2024). Enzymes such as lactate dehydrogenase (LDH), alanine aminotransferase (ALT), aspartate aminotransferase (AST) and gamma-glutamyl transpeptidase (GGT) have been reported to be useful as diagnostic aids in predicting risk of cardiovascular disease (Oluba et al., 2008a; Oluba et al., 2008b; Asuelimen et al., 2024). Oxidative stress resulting from increased production of free radicals has been reported to be associated with decreased levels of antioxidants in the myocardium and plays a major role in cardiovascular diseases (Ayo et al., 2023).
The present study revealed that the heart was under attack when exposed to vapour of diesel, kerosene and petrol as evident by diminished enzyme activity (ALT, AST, ALP, ACP, GGT, LDH, SOD, CAT) and abnormal levels of oxidative indices (MDA, GSH).
Conclusion
In conclusion, it could be deduced that vapour of higher hydrocarbon chain petroleum products possibly induced weight loss in rats. The haematology data from this study is suggestive of haemolysis rather than blood loss to be responsible. The present study also revealed that the heart was under attack when exposed to vapour of diesel, kerosene and petrol as evident by diminished enzyme activity (ALT, AST, ALP, ACP, GGT, LDH, SOD, CAT) and abnormal levels of oxidative indices (MDA, GSH).
Acknowledgments
We acknowledge all the authors of this research work for their participation.
Conflict of interest
All authors declare that they have no conflict of interest associated with this research article.
Funding
No special funding was received for this research work.


Open Access By Aditum Open Access Journals id licensed under Creative Commons Attribution 4.0 International License. Based On a Work at aditum.org