
Clinical Cardiology Interventions
OPEN ACCESS | Volume 6 - Issue 1 - 2026
ISSN No: 2836-077X | Journal DOI: 10.61148/2836-077X/JCCI


Satyendra Nath Chakrabartty
Indian Ports Association, Indian Statistical Institute.
Corresponding author: Satyendra Nath Chakrabartty, ORCID: 0000-0002-7687-5044
Present Address: Flat 4B, Cleopatra, DC 258, Street No. 350, Action Area 1, New Town, Kolkata.
Received: November 06, 2026 | Accepted: November 15, 2026 | Published: November 20, 2026
Citation: Satyendra N Chakrabartty (2026) “Index of Socioeconomic Status and Index of Cardiovascular-risk factors as Predictors of Cardiovascular Disease.” journal of clinical cardiology interventions, 6(1). DOI: 10.61148/2836-077X/JCCI/057.
Copyright: © 2026 Satyendra Nath Chakrabartty. This is an open access article distributed under the Creative Commons Attribution License, which permits unrestricted use, distribution, and reproduction in any medium, provided the original work is properly cited.
Background: Associations among components of socioeconomic status (SES) and cardiovascular risk factors (CVRFs) gave contrasting results. Understanding of socioeconomic determinants of cardiovascular disease (CVD) and their association is crucial to mitigate CVD burden and achieving national targets for CVD.
Method: Avoiding problems of scaling and selection of weights, the paper describes index of CVD-risk factors (ICVD-RFt) and another Index of socioeconomic status (SESt)
 for a country or region at t-th year combining subjective and objective measures of SES and CVRFs in different forms by multiplicative aggregation. The unit-free indices can cover data in different units and forms like ordinal scores, count data, cardinal data in proportion, percentages, ratios, rates, etc. avoiding normalization and weights of the chosen indicators.
Results: The proposed indices reduces substitution effect among the chosen indicators and satisfy desired properties like translation invariance, aggregation consistency, time-reversal test, formation of chin indices, etc. Significant correlation between ICVD-RFt and SESt
 enables undertaking multivariate regression of ICVD-RFt on components of SESt
 or canonical correlation analysis (CCA) considering p-numbers of CVRFs (likely effects) and q-numbers of SES-components (possible factors). Empirically fitted regression equation of CVD death rate on the components of proposed two indices facilitates making sound decisions regarding identification of critical areas to plan appropriate interventions and direction of improvement providing support in clinical decision‑making and public‑health policies towards mitigation of CVD-burden and to achieve equitable and effective disease prevention.
Conclusion: Novelty of the method lies in known probability distribution of proposed indices facilitating parametric analysis for comparisons, classifications and enabling statistical tests of equality of mean, variance, progress made across groups or time periods. Professionals and researchers can take advantages of the proposed method including detection of changes by longitudinal data. The method with theoretical advantages is recommended
multiplicative aggregation, lognormal distribution, regression, canonical correlation, relative importance
Introduction:
Socio-economic status (SES) is inversely related with cardiovascular disease burden [1]. Coronary heart disease (CHD) is more frequent among people with low SES. SES can be regarded as a cardiovascular risk factors (CVRFs) especially for male adults [2]. In addition to traditional CVRFs like hypertension, dyslipidaemia, diabetes, smoking, family history of CHD, social factors reflected by SES on cardiovascular risk is significant [3].
While people with poor financial, educational, occupational status (low SES) are prone to (CVD), individuals with higher SES recognize the hazard ratio of myocardial infarction and help initiation of medical care [4]. Stress resulting from job insecurity, financial instability, social marginalization, etc. has been found to be associated with higher level of cortisol affecting sympathetic nervous system, endothelial dysfunction, arterial stiffness, atherogenesis, etc. [5]. However, contrasting results have been observed regarding association between SES and CVD and CVRFs over genders and age-profiles. While low SES was related to metabolic syndrome and hypertension, higher SES and obesity were positively associated [6].
In India, Ischemic heart disease contributes maximum towards death due to CVD followed by strokes [7]. As per World Economic Forum (WEF) and Harvard School of Public Health (HSPH), India is likely to lose around $2.17 trillion by 2030 due to CVD alone [8].
Models to study SES and CVD could be interactive [9] or additive showing effect of physiological, psychosocial and environmental factors influencing CVD-risks [10]. However combining environmental factors and psychosocial factors are problematic. Understanding CVD-risks help in better clinician-patient discussions for primary prevention of CVD and adoption of preventive strategies towards lipid-lowering and anti-hypertensive therapies [11]. It often involves questionnaires covering items on risk-factors like age, gender, family history, lifestyle habits, etc. (Ordinal level data) and pathological findings like blood Systolic and Diastolic pressure, cholesterol levels, left and right ventricular hypertrophy, levels of blood glucose and triglyceride, etc.(cardinal data in different units). Aggregation of such data following unknown distributions suffers from methodological limitations [12]. Such models differ in form, characteristics, and do not perform well in heterogeneous populations with possibility of overestimation or underestimation which limit applicability of temporal and spatial changes across time and space [13]. New CVD-risk markers evaluated through Systematic Coronary Risk Evaluation (SCORE2), AHA Predicting Risk of CVD Events (PREVENT), lipoprotein(a) (Lp[a]) risk calculator, etc. are not being used frequently in CVD-risk models, despite strong agreement with ASCVD risk scores [14]. For improvement, CVD-risk tools based on all relevant indicators with validation across populations, the PREVENT-CVD equations evaluating 19-risk-factors, treatment status, urine albumin-creatinine ratio (UACR), HbA1c, social deprivation index (SDI) etc. was developed for 10-year and 30-year periods [15]. However, challenges remain on effective CVRFs stratification and finding clinically meaningful risk thresholds for different age-groups across genders especially for pharmacotherapy of hypertension and hyperlipidemia [16].
Dimensions and indicators of SES assessment tools vary. SES indicators chosen by [17], [18], [19] are different. Shortcomings of popular SES scales in India were highlighted [20]. Better understanding of socioeconomic determinants of CVD and their association following sound approach is crucial to achieve national CVD targets [21]. Hence, methodologically sound comprehensive index of SES for a region/country is imperative.
The paper describes index of CVD-risk factors at t-th year (ICVD-RFt) and index of socio-economic status (SESt)
 satisfying desired properties and facilitating meaningful comparisons, classifications and finding association by correlating ICVD-RFt
 and SESt
 . Relationship between the two indices can be derived by multivariate linear regression or by canonical correlation based on CVRF-vector (p ×1)
 and SES-vector (q ×1), even if ????≠????.
Literature survey:
Avoiding fragmented results on effect of individual CVRFs, quantification of overall CVRFs by estimation models appears to have advantages. Major limitations of such models were addressed [22]. Illustrative list is as follows:
-Use of non-uniform risk factors and methodological limitations of their evaluation. The obsolete Framingham Heart Study is not recommended [23].
- CVD-risks in different scales and units are not additive.  For example, blood pressure in mmHg, cholesterol in millimoles per litre of blood (mmol/L), Diabetes in (mmol/L), BMI in kg/m2,
 number of cigarettes smoked per day, etc. are clearly not additive.
- Thresholds for each CVRF differed. For example, thresholds for blood-pressure and cholesterol were different for therapeutic measures [24].
- CVD-risks failed to explain variability across age-groups.
- While PROCAM risk model [25] underestimated CHD-risk among men, Reynolds Risk Scores overestimated the same for women [26].
- Questions raised about applicability of CVRF-models across heterogeneous groups [27].
- Prediction of CVRFs by such models cannot be generalised and many are not yet validated externally [23].
- Selection of CVRF models can influences pharmacotherapy decisions. For example, Lipid-lowering therapy starts depending on estimated risk > model-specific thresholds and other clinical qualifiers [28].
- Statin eligibility dependents on selection of CVRFs prediction models and showed modest inter-model agreement [29].
Each CVRF-score was transformed to equidistant scores (Ei) which were standardized to Z –scores and transformed to proposed item score Pi
 in score range [0, 100] following normal distribution, enabling meaningful addition so that Pi=
 index to reflect overall cardiovascular health risk ICVD-RFt 30,
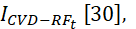 for categorical variables, weights assigned were frequency of the j-th levelTotal sample size
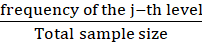 ×100
 to get E-scores. Measures of biomarkers and laboratory findings in ratio scales satisfying equidistant property, were transferred directly to P-scores via Z-scores. Despite several advantages, the method following arithmetic aggregation suffers from substitution effect allowing higher values to compensate lower values of CVRFs.
Multidimensional SES indicates social standing of individuals/families/communities, on the basis of their income, education, power, occupation, etc. and access to socio-economic-cultural resources like money, shelter, food, healthcare, education, social opportunities, etc. [31]. Higher SES generally correlates with better living standard, better access to services, and increased opportunities for development of cognitive and socio-emotional processes [32]. To measure SES, subjective variables are obtained by survey using questionnaires/scales developed for the purposes, objective measures are collected from secondary data. Inclusions of more variables to measure comprehensive SES was suggested for effective socio-economic strategies of local and national governments [33]. Most important issue is aggregation of these variables in different levels of measurement, different score-ranges and unknown distributions of the component variables ensuring the resulting composite index (CI) to satisfy aggregation consistency (i.e. index obtained in stages = Index computed in a single stage) facilitating meaningful measurement across space and time.
Arithmetic aggregation of ordinal scores of a chosen set of indicators is not meaningful since levels of items in questionnaires/scales are not equidistant. For example, trait distance between two consecutive levels of Zung Self-Rating Depression Scale (ZSDS) [34] are non-uniform. If Di,j denotes distance between i-th and j-th rung of 10-rungs MacArthur Scale of Subjective Social Status, then D10,9≠
 D9,8
 ≠
 2*D9,7
 and may not show behaviour of the latent construct in accurate fashion. Hierarchy of occupations in six classes [35] does not represent equal distance between successive classes. Even for objective measures of SES, converting people or households in a fixed score-range could be non-equidistant. Assigning scores of 0 – 8 for each chosen objective measures is arbitrary [36]. Meaningful addition like Z=X+Y
 and indication of bias are not possible for unknown and different sampling distributions [37].
Other SES measuring scales consider monetary dimensions like income, wealth, assets, etc. and non-monetary dimensions like education, maternal education, occupation, household prestige, water and sanitation, etc. However, too much reliance on income-based criteria which changes with Consumer Price Index (CPI) limits accurate assessment of socioeconomic disparities. Each such scale with limitations may not be appropriate for comparisons across space and time [38]. Other limitations are:
Weighted sum approach of SES follow different ways to select weights which influence properties of CI. Different selection of weights may not ensure minimum variance of the resultant CI or equal correlation of CI with the component indicators. To measure monthly per capita household income (HI) as weighted sum, [43] selected weights from PCA, conditional random forests (RF) and fitted linear regression equations to predict HI where prediction error was minimum for RF implying RF analysis of SES could be better than PCA. Moreover, weighted sum approach is also associated with compensability among the targets/indicators and is undesirable [44]. Asset indices using PCA weights and unweighted indices performed with similar efficiency and SES of households can be well assessed without weights [45]. PCA weights ignore indictors which are weakly correlated with CI, and may be distorted by presence of outliers, normalization methods, etc. Different transformations for normalizing SES components resulted in different coefficients of logistic regression analyses of SES on health [46]. Thus, assessing SES without normalization and choosing weights is desirable.
Proposed method:
Ensure positive relationship of each indicator with CI i.e. higher value indicates better performance. Without resorting to normalization and selection of weights, aggregation is proposed by SESt= 1qYitXi0
 where Y1t, Y2t, …….., Yqt
 denote values of the chosen indicators in t-th period and Y10, Y20, …….., Yq0
 denote corresponding values of those indicators in base period (Yit,Yi0>0)
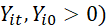 of a region/country. Thus,
SESt=  Y1t, Y2t,…….., YqtY10 Y20 …….. Yq0
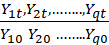 (1)
Similarly, denoting observed values of p-indicators of CVD-risk factors (both traditional and new CVD-risk markers) at t-th year of the a region/country by X1i, X2i, ……,Xpi  and the corresponding base period values as X1i0, X2i0, ……,Xpi0
 , the index ICVD-RFt is defined as
ICVD-RFt= 1pXiXi0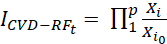 (2)
Note that
and ICVD-RFt ) is geometric mean (GM) of unit-free ratios avoiding the q-th or p-th root.
logICVD-RFt=j=1plogXji-j=1plogXji0 (3)
 and ICVD-RFt follows lognormal distribution since distribution of GM approaches lognormal distribution when effects of different factors on the multidimensional index are multiplicative [47] and X ~
 lognormal distribution implies log(X) ~ normal distribution and vice versa [48].
Properties:
and ICVD-RFt is monotonically increasing continuous variable, with significant reduction of substitution effect among the chosen indicators. 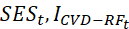 satisfies translation invariance property and aggregation consistency.
 ⟹
 1% increase in ICVD-RFt and 1% increase in YjtYj0
 ⟹1% increase in SESt when all others are unchanged. Thus, ∆ICVD-RFt
 and ∆XitX1i0
 curve is linear. The same is true for SESt
SEStCountry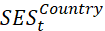 =SEStRegions
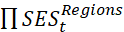 =SEStDimensions
 =SEStindicatorss
 and
ICVD-RFtCuntry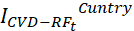 = ICVD-RFtRegions
 = ICVD-RFtIndicators

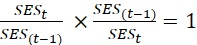 and ICVD-RFtICVD-RF(t-1) ×ICVD-RF(t-1)ICVD-RFt=1.

 =ICVD-RF21× ICVD-RF10

 with respect to logYjt
 i.e. δ logSEStδlogYjt.
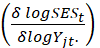 gives relative importance of j-th indicator of SESt.
 Similarly, relative importance of the CVD-risk factors can be derived.
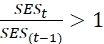 implies improvement of SES in successive periods. Responsiveness of SES measurement and extent of improvement is reflected by SESt- SES(t-1)SES(t-1)
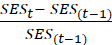 * 100. Similarly, percentage improvement of index of CVD-risk factors can be measured across years.
 or ICVD-RFtICVD-RF(t-1)
 for different years indicate fluctuations of the indices across time and facilitate comparisons with longitudinal data.
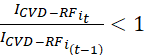 for ICVD-RFtor if
SESAAitSESAAit-1<1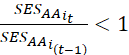 for SESAAt
 . Such critical indicators provide directions for improvements and require appropriate interventions.
Association between ICVD-RFtand SESAA  can be computed by correlation or by value of R2
 obtained from multivariate regression of the form ICVD-RFt=α+βiSESit
 . However R2
 dependents on model and is sensitive to the choice of response variable. At micro level, canonical correlation between SES (with q-indicators of possible factors) and CVRFs (containing p-indicators of likely effects) indicates association of lifestyle behaviours with CVRFs and mortality. [49]. Both multivariate regression and CCA can be used to predict ICVD-RFt with knowledge of SESt by establishing relationships among them. In addition, relationships can be found between CVD prevalence or CVD death rate and gender-wise, age-group-wise indices ICVD-RFtand/or SESt along with relationship between the two measures.
Cautions need to be taken while fitting linear multivariate regression equation and undertaking CCA in terms of verification of the assumptions of the respective techniques (like linear relationships, absence of multicollinearity, uniform variability, normality, etc.)
and removing bad leverage points [50]. In linear regression equation of the form Y=α+βX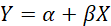 , if ri=Yi-(α+βXi
 ) is an outlier in the set of residuals {r1, r2, …….., rn}
 and the corresponding (Xi,Yi)
 is a leverage point, then the point (Xi,Yi) is a bad leverage point which result in a poor fit of the linear model. Similarly, multivariate normality is needed for CCA. Interpretation of different canonical functions giving different patterns of relationship between CVRFs and SES needs caution.
Knowledge of distribution of each proposed index facilitates:
 , variance σ2
 and testing hypothesis of equality of mean and variance across time and space. Equality of treatment effectiveness can be tested byH0
 : μICVD-RFPre-group
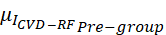 = μICVD-RFPost-group
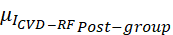 using paired t-test.
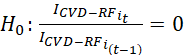 or H0: SESAAitSESAAit-1=0
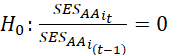 since distribution of ratio of two variables, each following normally is χ2.

DBIK = 1Ki=1Kj=1 i≠jKMax[DiamCi-DiamCjCi-Cj]

where K denotes number of mutually exclusive classes. Diameter of i-th class with mean Ci and size ni
 is computed as DiamCi=xi∈ Cixi-Ci2ni
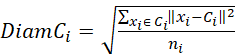
Better classification efficiency is indicated by lower value of DBI. Use of DBI in simulated and also real-world medical datasets was investigated [52] who suggested method to recognize subtle patterns of DBI that might otherwise be overlooked.
Discussion:
Proposed multiplicative aggregation of subjective and objective measures of SES and CVRFs, irrespective of their inter-correlations to get composite indices SESt and ICVD-RFt reflecting overall improvement in a given period over the base period has theoretical advantages. The indices cover data in any units and forms such as count data, ordinal scores, cardinal data in proportion, percentages, ratios, rates, etc. avoiding normalization and weights of the chosen indicators. For each index, substitutability among indicators is reduced significantly. Knowledge of probability distribution of each proposed index helps to undertake testing statistical hypothesis and to find association between ICVD-RFtand SESt by simple correlation or by R2 from multivariate regression of ICVD-RFt on components of SESt or by canonical correlation analysis (CCA). Both multivariate regression and CCA can be used to predict ICVD-RFt with knowledge of SESt to help achieving equitable and effective disease prevention. However, it may be desirable to evaluate the indices and find their association for a particular country since roles played by the components of SES and ICVD-RF  vary for different locations and cultures and form regional clustering [53].
Conclusion:
The proposed indices with wide coverage of data in any forms satisfy aggregation consistency and offer significant benefits to find association between ICVD-RFtand SESt in better fashion. Empirically fitted regression equation of CVD death rate on the components of proposed two indices facilitates making sound decisions regarding identification of critical areas to plan appropriate interventions and direction of improvement providing support in clinical decision‑making and public‑health policies towards mitigation of CVD-burden and to achieve equitable and effective disease prevention. Novelty of the method lies in known probability distribution of proposed indices facilitating parametric analysis for group comparisons, classifications and enabling statistical tests of equality of mean, variance progress made across groups or time periods. The method with theoretical advantages is recommended. Future empirical investigations are suggested for finding salient features of the proposed approach including robustness for generalization of findings.
Declarations:
Acknowledgement: Nil
Conflict of Interests: No conflict of interests to declare
Funding: No funds, grants, or other support was received
Data availability: No datasets were generated or analysed in the study.
Use of artificial intelligence (AI): The author declares that no generative artificial intelligence (AI) tools were used in the preparation, analysis, or writing of this manuscript
Authors’ contribution: The single author is involved in Conceptualization, Methodology,
Writing- Original draft preparation, Writing- Reviewing and Editing



Open Access By Aditum Open Access Journals id licensed under Creative Commons Attribution 4.0 International License. Based On a Work at aditum.org


