International Journal of Medical Case Reports and Medical Research
OPEN ACCESS | Volume 5 - Issue 1 - 2026
ISSN No: 2994-6905 | Journal DOI: 10.61148/2994-6905/IJMCRMR


Short Title: Causal Impact of Body Mass Index on All-Cause Mortality
Ángel, Martín-Castellanos1,2*
1Spanish Society of Sports Medicine.
2Nutrition and Sports Medicine Center. Cáceres. Spain.
*Corresponding author: Ángel, Martín- Castellanos, Avda Rodríguez de Ledesma 14. Bajo 7. CP: 10001. Cáceres. Spain.
Received: March 28, 2026 | Accepted: April 04, 2026 | Published: April 08, 2026
Citation: Ángel, Martín-Castellanos., (2026) “Impact of Body Size and Body Composition On All-Cause Mortality Worldwide: We Have Just Demonstrated Mathematically that A Causal Association Bias of Body Mass Index Has Consistently Confused Cardiovascular and Health Sciences.” International Journal of Medical Case Reports and Medical Research, 5(1); DOI: 10.61148/2994-6905/IJMCRMR/0178.
Copyright: © 2026 Ángel, Martín-Castellanos. This is an open access article distributed under the Creative Commons Attribution License, which permits unrestricted use, distribution, and reproduction in any medium, provided the original work is properly cited.
Introduction. In associating body mass index (BMI) with all-cause mortality, different U- or J-shaped curve patterns have been repeatedly observed. However, BMI incorporates not only fat mass (FM) but also fat-free mass (FFM). We aimed to demonstrate that differences between FM and FFM values can maske the use of any BMI-associated risk. Method. From the relationships between FM and FFM, preliminary considerations on risk exposure levels were hypothesized. A review of body composition studies comprising 1,202,778 participants was conducted. The mathematical relationships between FM and FFM were analyzed as a piece of original research. Means of all variables were newly pooled in each of six BMI categories, separated by sex. If, after checking associations systematic differences between FM and FFM remained, this indicated that both components differed, and causality cannot be assumed. Results. A linear dose-response of FM and FFM analysis with all-cause mortality across all categories was found. A significant difference between FM and FFM in all associations was demonstrated (p <0.001). In all means of BMI, FM and FFM were significantly different (p <0.001). A risk equivalence between BMI and FFM in underweight category was demonstrated in either sex (FFM > 90%; p <0.001). In women with class III obesity, a risk equivalence between BMI and FM was proven (FM% > 50%; p <0.001). Conclusions. For any BMI-associated risk FFM was consistently overestimated in comparison to FM. From all means BMI historically observed, the true- causal risk was consistently biased leading to inaccuracy and lack of reliability in results.
anthropometric, bias, body composition, body mass index, obesity, mortality risk, obesity paradox
1. Introduction
Body Mass Index (BMI) is a metric, which has been widely used over the past decades as a measure of obesity [1] related to excessive fat deposits and conditioning the impact on both all-cause mortality and morbidity. Of importance, a BMI in overweight/obesity ranges is associated with increased risk of cardiovascular disease (CVD) and other no communicable diseases and even cardiovascular and cause-specific mortality [1-15]. Meanwhile, being underweight is also associated with adverse health outcomes, including diabetes, specific cancers and other types of cause- specific mortality [5-13]. Thus, the lowest risk of mortality has been showed in individuals within normal weight (>20–<25 kg/m²) or in overweight (≥25–<30 kg/m²) ranges [1-13]. In many epidemiological studies, the relationship between BMI and mortality has been shown to follow an unexpected U- or J-shaped (“obesity paradox”) [1-15]. In other words, conditions of undernutrition and overweight/obesity have been associated with adverse mortality outcomes from studies comprising more than 30 millions of participants. These results may be visualized on the left and right branches of the different curve patterns worldwide [2-17]. Taking this approach, knowledge about the human body composition is essential because total body weight may be organized at the tissue-system level with two components: fat mass (FM) and fat free mass (FFM), which includes muscle and bone masses alongside visceral organs and other tissues [16-20]. Expressed in this manner, BMI is equal to weight in kg (i.e., FM + FFM) divided by height squared in meters. Thus, two indices, FM index (FMI) and FFM index (FFMI) contribute to total BMI in unequal proportions (FFMI ≠ FMI), while BMI does not discriminate between FM and FFM, nor does it distinguish between visceral and subcutaneous fat, or determine a risk volume per unit of height [18, 19].
Evidence suggests that FM and FFM exert opposite effects on all- cause mortality [10, 16-28]. Thus, regarding causal risk association, a more serious problem is that individuals with the same BMI can have widely differing amounts of FM and FFM, with both factors in fact conferring opposite health outcomes [16- 20, 22-31]. Meanwhile, BMI conceals the relative contributions of FM and FFM. It is therefore impossible to determine any causal risk from a mean BMI when used to assess nominal differences, whether in parallel group or paired analyses [18, 19]. Thus, the relative risk contributions of FM and FFM within each BMI category are key for assessing risk beyond traditional factors [16- 19].
Mathematically, in normal weight, overweight, and class I obesity category adults, FFM is typically higher than FM within a given BMI [1, 16-24, 29, 32-34]. Thus, any FM-to-FFM ratio (FMFFMR) within these categories is generally < 1 (proper abstract fraction, where the numerator and the fraction never refer to a whole in mathematical terms). Therefore, from a mean FMFFMR of < 1, a lack of balanced distribution when comparing for different body components (i.e., FM ≠ FFM) between groups with different mean BMI is particularly prone to the generation of false positive results [18, 33]. In this line, BMI cannot provide a consistent causal risk when assessing health outcomes, unless the risk contributions of the two mass components are balanced between the groups being compared [18, 19, 32-34].
We aimed to demonstrate mathematically that differences in the body composition from each BMI risk category can influence the reliability of any BMI cut-off when evaluating all-cause mortality.
2. Method
2.1 Mathematical and Anthropometric Considerations
Recent advances allow weight, waist circumference (WC), and height to be used to predict FM [26, 27]. Predicted FM can be calculated using the validated sex-specific anthropometric prediction equations developed by the NHANES [27]: for women: FM (kg) = 11.817 + 0.041 x age (years) – 0.199 x height (cm) + 0.610 x weight (kg) + 0.044 x WC (cm) + 0.388 [if Mexican] +0.073 [if Hispanic] – 1.187 [if Black] + 0.325 [if other race]. For men: FM (kg) = – 18.592 – 0.009 x age (years) – 0.080 x height (cm) + 0,226 x weight (kg) + 0.387 x WC (cm) + 0.080 [if Mexican] – 0.188 [if Hispanic] – 0.483 [if Black] + 1.050 [if other race]. Similarly, WC and height may be used for calculating a relative abdominal volume from the waist-to-height ratio [19, 32-34], or, after being validated by dual-energy x-ray absorptiometry these simple measurements may be used for estimating a relative FM [35]; both abdominal volume and FM are linked with a high- risk body composition. Relative FM can be obtained in agreement with the formula: 64 – (20 x height (m)/WC (m) + (12 x sex); sex= 0 and 1 for male and female, respectively [35]. FFM can be subsequently calculated by subtracting FM from total weight. Of particular importance is the FMFFMR as well as its inverse (i.e., the FFM-to-FM ratio). In adults within typical anthropometric characteristics, these ratios are always < 1 and > 1, respectively, without indicating any putative risk or protective effect, by either age, sex or ethnicity [16, 18, 33, 34]. Therefore, the inequality FFM> FM can be expressed as a linear equation: FFM = FM + x (in kg), whereby subtracting FFM from FM, we calculate “x” as a unit of mass (x = FFM – FM: x >0); the standard value is typically higher in men than in women [16-20]. On this basis, equality only occurs when x = 0 (FFM = FM; FMFFMR = 1; FFM-to-FM ratio = 1). Only when FM is ≥ FFM (i.e., FMFFMR ≥ 1) can FM and BMI be considered risk-equivalent for capturing 100% of the whole-risk [18].
From a normal body size (BMI ≥ 18.5 – <25), weight loss leads to reduced musculoskeletal mass and underweight range; in this range, mathematically FFM therefore takes a negative sign, irrespective of FM being low or even zero; in mathematical terms: “x” = (– FFM) – (± FM): “x” = – x: “x” < 0. In this situation, FFM is higher than 50% and FMFFMR and its inverse are <1 and >1, respectively. Beyond class II/III obesity, weight gain can lead to excess FM, beyond 50% of weight; in mathematical terms: “x” = FFM – FM: “x” = – x; therefore, “x” < 0 [18]. Generally, variations in the values of one component may or may not affect total percentages of both components. However, variation in the FFM percentage affects the percentage of FM, and vice versa Thus, the causal risk measured from equal – different BMIs may correspond to different – equal body compositions.
From a novel insight, we hypothesize that in the linear equation of a straight line (Δy = mΔx) on the Cartesian plane, the “m” slope can measure the change in y (FMFFMR) per unit in x (BMI). Mathematically, in the square diagonal, where “m” = 1, values for FMFFMR in the y-axis can thereby be described as an ascending line that goes from left to right between a minimum (FMFFMR = 0: FFM% = 100; FM% = 0) and a maximum of risk (FMFFMR ≥1: FM% ≥50; FFM% ≤50%), (Figure 1). Thus, any partial line segment between two Cartesian points will always draw an “m” slope (i.e., m = Δy/Δx) that depends on the variations of FM and FFM percentages (y-axis) within the variations of BMI (x-axis). Similarly, different FMFFMR values within various BMI ranges could modify the “m” slope of a segment of line. Based on the variations for y and x, the slope could be positive (m > 0, indicating increased FMFFMR), horizontal (m = 0, indicating consistent FMFFMR), or negative (m < 0, indicating decreased FMFFMR). Mathematically, when “m” = 1 FMFFMR goes from close to zero to 1 and BMI from a minimum in underweight range (< 18.5) to a variable point of severe obesity (≥ 35), where FM and FFM percentages are equal (i.e., 50% of weight in each). In this slope, Δy = Δx must be fulfilled. Thus, any variation in a unit of y (e.g., 0.1) between zero and 1 values is equivalent to the variation in x, while a unit of x being the proportional part of BMI between the minimum (i.e., coinciding with FMFFMR ~ 0) and a defined point of severe obesity, where FMFFMR = 1. Of note, when FMFFM= 1 (FM [50%] + FFM [50%] = 100% of weight), the FM percentage captures 100% of the risk and has the same sensitivity as BMI to define causal risk [18]. In the opposite extreme, in underweight range, when FMFFMR is close to zero FFM% is close to 100 (FM% ~ 0), and then, FFM, while being a mathematically- reduced component ([– FFM] – [FM] = – x), captures 100 of the risk and has the same sensitivity as BMI to define a causal risk, wich is inversely associated to FFM [2-18]. As a result, outside the square diagonal, FMFFMR and BMI can never be risk equivalent, and different–equal ratios of risk may correspond to equal– different BMIs and body compositions. As a consequence, if true negative risk points for FMFFMR are selected as false positive ones for BMI, and being slanted towards any group of comparison, then, BMI-associated risk from statistical models based on the prevalence of outcomes between groups (e.g., multivariable regression or sensitivity/specificity analysis) will appear distorted [18,19, 33]. In this situation, the causal effect estimated from the assignment of risk for BMI can vary depending on different asumptions of the models. This can be understood in Cartesian terms if comparing for different body composition and FMFFMR value in each BMI category, while FM and FFM percentages presenting inequality and unbalanced distributions before reaching the maximum risk point, where FMFFMR is ≥ 1 (see Fig 1).
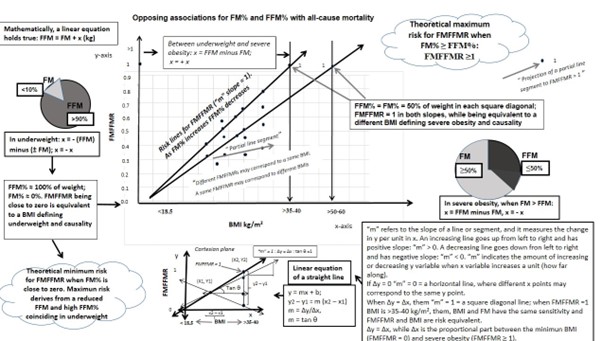
Figure 1: Theoretical causal risk for the association of FMFFMR with all-cause mortality. Linear function for FMFFMR across the entire risk spectrum from BMI.
BMI, body mass index; FM, fat mass; FMFFMR, fat mass-to-fat-free mass ratio; FFM, fat-free mass.
*Any BMI category may be found in the overall population and across the entire risk spectrum. Until the maximum risk exposure level can be demonstrated, both ratios and the slope of the respective linear functions depend on the final variations for both FM% and FFM% in each BMI-defined range.
**To demonstrate a theoretical minimum and maximum risk level for FMFFMR within BMI, a sufficient number of participants at both ends of the risk spectrum must be included in any population study.
***While any BMI value may be or may not be variant in the same category, the value of FMFFMR and the “m” slope of a segment of line may vary. Causality can mathematically be differentiated across all BMI ranges by sex and population subcategories if a square diagonal may be drawn between x0, y0 (i.e., BMI at the origin point having a minimum value in underweight range and FMFFMR value being equal to zero) and x2, y2 (i.e., BMI coinciding with severe obesity and FMFFMR being equal to 1).
**** Change in FMFFMR (as the y-axis) and change in BMI (as the x-axis) may be applied in each segment of the lines to understand the different slopes that can be found from the different variations of the two body mass components.
Source: The author, who has the copyright, created this theoretical graphic.
2.2 Data sources and literature search and adding new variables
This research was carried out focusing on a selection of pertinent studies published over the last three decades, to elucidate the relationships between BMI and variables derived from body composition measures with all-cause mortality in either sex. Studies included in this investigation were identified by searches of PubMed, Web of Science, and Google Scholar databases, academic social networking sites, and references from relevant articles (last search in January 2026). Search terms applied and combined included BMI, direct or indirect measures of body composition such as FM/FMI and FFM/FFMI or the corresponding percentages, and type of association with all-cause and CVD- related mortality. The investigation encompassed various study types, with a particular focus on cohort studies aimed at exploring the mathematical relationship of BMI and body composition measures with mortality. Body composition studies include those studies that allowed to calculate measurements of FM/FMI and FFM/FFMI or the corresponding mass percentages from direct techniques, such as bioimpedance analysis, computed tomography, magnetic resonance imaging, total body potassium and dual energy x-ray absorptiometry, as well as indirects, e.g., anthropometric prediction equations that among other anthropometrics included weight, WC and height [26, 27, 35]. Thus, the mathematical relationship between the two mass components within BMI was analysed as a piece of original research from new mathematically defined variables such as FMFFMR and the “x” term, while this being a concrete or absolute (|x| modulus) value [18, 19]. In the analysis of the literature, some extensive reviews of the associations between body composition measures and mortality [29, 34] indicated that the majority of studies had found counterintuitive associations. However, no study has investigated the impact of the ratios and the absolute differences between FM and FFM, even though total weight/BMI change is associated with complementary changes in both components. In this research, from the dataset and anthropometric characteristics reported in each study, new variables mathematically were extracted or calculated, as appropriate.
2.3 Selection of Studies
After selecting a sufficiently large global sample to make a mathematical demonstration, a systematic review was not deemed necessary. Articles were selected to be included in mortality analyses based on a set of inclusion criteria: (i) the conclusion was based on any BMI-associated risk; (ii) studies included a minimum of 700 participants to boost statistical power; and (iii) for the mortality analysis, studies had to have 4 or more follow-up years. Studies including BMI had to include or allow to calculate at least one other measurement of some mass component (FM/FMI or FFM/FFMI), either directly or from means of weight, height and WC, and studies had to report the relationship between some mass component and mortality in any BMI range from underweight (< 18.5 kg/m²) up to > 40 kg/m² (class III obesity) [1]. All BMI ranges had to include sufficient individuals with body composition measures, and had to be historically consistent with the body of the literature [2-19].
A synthesis of 25 relevant epidemiological studies was summarized in supplementary table S1 [21-31, 36-49]. In this approach, each study was reproduced, but adding new pertinent variables, which were originally omitted.
2.4 Variables
Six BMI categories (underweight, normoweight, overweight, and obesity of class I, II and III) were considered, following the international consensus statement [1]. Six corresponding theoretical risk exposure levels were established. From all studies, means ± standard deviation (SD) or medians of all established variables were newly pooled to calculate the corresponding mean of means in each BMI category, separately by sex. Thus, means were distributed in each corresponding category, irrespective of any association level in each study, and according to distribution into percentiles, tertiles, quartiles or quintiles of the original studies. When available, technologically measured variables of body composition were used in the pooled dataset [10, 16, 17, 21- 30]. If not, variables were extracted from datasets or calculated from validated anthropometric prediction equations [26, 27, 35]. Each value was used or recalculated for the corresponding category, as appropriate. All values were subsumed to any race and average age. Values for FM percentages were taken from datasets or calculated from FM percentage = FM x 100/weight (kg). Values for FFM were taken from datasets or calculated by subtracting FM from total weight. Mean FFM percentages were taken or calculated by subtracting FM percentages from 100% of the total weight. FMI and FFMI were taken or calculated once weight/height and FM/FFM, or their respective percentages, were known [22]. Among the generated variables, mean FMFFMR was calculated from the mean values of FM and FFM. A specific |x| modulus was described as another new variable from the absolute difference in means between FM and FFM [18, 19, 32-34]. Mathematically, a non-zero difference in means (|x| > 0)—for example, when FM is significantly higher or lower than FFM—would indicate an unbalanced distribution for total mean FM and FFM within a BMI category or when comparing across categories. By deduction, only if the total means of differences in two categories are equal in magnitude but of opposite signs would the total mean |x| of both categories equal zero (|x| = 0). Meanwhile, if two categories have significantly different non-zero |x| values, both categories represent different body compositions. As published, any significant non- zero mean difference between groups or categories being compared (i.e., having different ± “x” values and mean |x| > 0) means they are not equivalent in body composition and risk [18, 19, 33, 50]. From all studies, risk associations for BMI and different body composition variables were established using different measures of association, such as Cox proportional hazard ratio models, sensitivity/specificity analysis, and other statistical models. If— after checking the means for associations and comparing inter- and intracategories—systematic differences between FM and FFM remain, this indicates consistent differences in high-risk body compositions between the groups and categories compared. Similarly, if mathematical values of the variables indicate inequality between both components, any over- and underestimation of one component relative to another would suggest a biased causal association when based solely on population mean BMI as reference value for the association.
2.5 Statistical Analysis
All participants were pooled in the corresponding BMI category from the distributions reported for means or medians of BMI in all studies. On the pooled dataset by category, the corresponding body composition measures reported or calculated for each category were added from all studies. Descriptive analyses for all variables of interest were performed through analysis of variance (ANOVA) and comparison of means with Bonferroni post-hoc tests. The student’s t-test was used to compare the means of the variables between each two continuous categories, and also for comparing body composition variables within the same category. All variables were tested for normality by Kolmogorov-Smirnoff test. Men and women were analyzed separately. Variables are described in quantities, ratios, and also using percentages; quantitative variables are summarized with both the mean and SD. In hypothesis testing, the maximum rate of type I error was set lower than 5%. The confidence interval was calculated for each relevant variable. Data were analyzed using SPSS for Windows (IBM SPSS Statistics 20).
3. Results
3.1 Data Retrieval and Participant Characteristics
After an initial search of abstracts, 25 full studies comprising 1,202,778 individuals (51.7% female) were selected for mortality analysis. The majority of studies included more than 1000 individuals. Among the studies extracted for this work, 9 articles were published prior or during the year 2016, and 16 articles were published after 2016 (the last article was carried out in 2025), (see Table S1). Thirteen studies initiated recruitment before the year 2000. The remaining 12 studies began recruitment during or after 2000. In 12 studies, the follow up period was equal to or greater than 10 years. Twelve studies had a follow up period of less than 10 years. The studies were carried out primarily in North America (n= 11; ~40% of participants) and Europe (n=10; ~43% of participants). Three studies were conducted in Asian (~13% of participants) and 1 was carried out in Australia (~4% of participants). The means of the total sample for all association findings of BMI and body composition variables with all-cause and CVD-related mortality are shown in Table 1.
Table 1: Generalized means for the associations of BMI and body composition indicators, including newer variables, with all-cause and CVD-related mortality.
|
Variables |
Men |
Women |
Findings |
Anova test |
|
|
|
|
|
|
|
BMI (kg/m2)
FM (%)
FFM (%)
FMFFMR
FMI (kg/m2)
FFMI (kg/m2)
FFM% – FM% = |x| (%) |
27.3 (7.4)
28.5 (9.7) *
71.8 (10.2)*
0. 42 (0.19); < 1*
8.8 (5.6)*
19.2 (3.6)*
42.9 (19.7)* |
27.9 (8.6)
36.9 (12)*
63.1 (12)*
0.69 (0.3); <1*
11.2 (8.3)*
17.8 (3.8)*
27.4 (24)* |
Positive
Positive
Inverse
Positive
Positive
Inverse
Inverse |
p <.001
p <.001
p <.001
p <.001
p < .001
p < .001
p <.001 |
|
|
|
|
|
|
BMI indicates body mass index; FFM, fat-free mass; FFMI, fat-free mass index; FM, fat mass; FMI, fat mass index; FMFFMR, fat-mass-to-fat-free-mass ratio; |x|, modulus as the absolute difference between FM and FFM percentages.
ǂ Ethnically specific risk cut-offs were included in each category.
ǂ ǂ Means (standard deviations) or medians from distributions in percentiles, tertiles, quartiles, quintiles, sensitivity/specificity and categories were used when pooling values in each of the corresponding six categories.
Mean BMI was located in overweight range in either sex, with a significant difference between all categories (p <0.001). All body composition variables showed significantly different inequalities between FM/FMI and FFM/FFMI when comparing between all categories (p <0.001) and within the same category of overweight (p <0.05). Regarding all studies, baseline characteristics of the variables in the pooled dataset and results after adding the new variables are shown in Table 2.
Table 2: Baseline characteristics of the variables in the pooled dataset by BMI category and TREL.
|
Variables |
UW: <18.5
|
NW:18.5<25
|
OW: ≥25 - <30
|
IO: ≥30 - <35
|
IIO: ≥35 -39.9
|
IIIO : ≥40 |
|
|
|
|
|
|
|
|
|
TREL
BMI (kg/m2)
FM (%)
FFM (%)
FMFFMR
FFM/FM
|
High
M:15.4 (1.2)* W: 15.4 (1.4)*
M:7.2 (3.3)* W:8.0 (3.5)*
M: 92.8 (3.2)* W: 92.0 (3.9)*
M:0.07 (0.03)* W:0.08 (0.04)*
M: 17.8 (13)* W: 15.5 (7.7)* |
Minimum
M: 22.6 (1.2)* W: 22.9 (1.6)*
M: 25 (5.4)* W: 31.4 (5)*
M: 76.1 (7)* W: 68.1 (4)*
M: 0.34 (0.1)* W: 0.46 (0.1)*
M: 3.1 (0.9)* W: 2.1* |
Moderate
M: 27.0 (0.8)* W: 26.5 (1.1)*
M: 29.8 (3.1)* W: 37.2 (4.3)*
M: 69.9 (4.3)* W: 63.3 (5.5)*
M: 0.42 (0.06)* W: 0.59 (0.11)*
M: 2.3 (0.3)* W: 1.6* |
High
M: 32.1 (1.2)* W: 32.1 (2.5)*
M: 35.2 (3.4)* W: 44.3 (3.1)*
M: 65.8 (5.4)* W: 55.5 (3.1)*
M: 0.54 (0.09)* W: 0.80 (0.09)*
M: 1.8 (0.3)* W: 1.2 (0.1)* |
Very high
M: 35.0 (3.5)* W: 35.3 (2.4)*
M: 33.5 (1.2)* W: 48.7 (3.2)*
M: 66.5 (1.2)* W: 51.2 (3.3)*
M: 0.50 (0.1)* W: 0.95 (0.1)*
M: 2 (0.3)* W: 1.0 (0.1)* |
Maximum
M: 50.5 (4.8)* W: 53.8 (7.6)*
M: 45.9 (7.6)* W: 59.3 (3.9)*
M: 54.0 (7.6)* W: 40.6 (3.8)*
M: 0.87 (0.2)* W: 1.4 (0.2)*
M: 1.2 (0.3)* W: 0.7 (0.1)* |
|
|x| (%)
FMI (kg/m2)
FFMI (kg/m2)
FM (kg)
FFM (kg)
|x| (kg) |
M: 85.6 (6.6)* W: 84.0 (7.8)*
M: 1.1 (0.4)* W: 1.2 (0.9)*
M: 14.2 (1.3)* W: 13.7 (1.5)*
M: 3.6 (1.4)* W: 3.7 (1.2)*
M: 46.6 (4.6)* W: 44.4 (8.7)*
M: - 42.5 (4)* W: - 40.3 (9)* |
M: 50.3 (12)* W: 36.7 (9.3)*
M: 5.8 (1.5)* W: 6,8 (1.6)*
M: 16.7 (1.2)* W: 15.5 (0.5)*
M: 17.1 (4.3)* W: 20.2 (3.3)*
M: 50.8 (12)* W: 45.6 (6.7)*
M: 33.6 (5.9)* W: 25.4 (3.3)*
|
M: 40.0 (6.4)* W: 26.0 (9.6)*
M: 8.0 (0.7)* W: 9.3 (1.1)*
M: 19.0 (0.9)* W: 17.0 (1.2)*
M: 24.8 (3.8)* W: 26.3 (2.8)*
M: 57.0 (3.9)* W: 46.5 (8)*
M: 32.1 (5.1)* W: 17.9 (7.2)*
|
M: 28.7 (7)* W: 10.0 (6.7)*
M: 11.4 (1.2)* W: 13.8 (0.6)*
M: 20.9 (1.2)* W: 18.4 (2)*
M: 33.1 (3.1)* W: 36.6 (3.2)*
M: 62.7 (5.2)* W: 46.0 (8.1)*
M: 31.1 (7)* W: 9.4 (6.9)*
|
M: 33 (2.4)* W: 2.4 (6.6)*
M: 11.7 (1.2)* W: 17.2 (2)*
M: 23.3 (2.3)* W: 21.4 (5)*
M:35.0 (6)*
M: 69.5 (10)* W: 45.0 (3)*
M:34.5 (5.2)* W: 0.7 (9.6)*
|
M: 8.1 (15.3)* W: -18.7 (7.7)*
M: 23.4 (5.8)* W: 32.0 (4.7)*
M: 27.1 (1.2)* W: 25.2 (3.4)*
M:72.9 (18.2)*
M: 84.3 (4.3)*
M: 11.3 (21.8)* W: -26.4 (11.7)* |
|
|
|
|
|
|
|
|
BMI indicates body mass index; FFM, fat-free mass; FFMI, fat-free mass index; FM, fat mass; FMI, fat mass index; FMFFMR, fat-mass-to-fat-free-mass ratio; IO, class I obesity; IIO, class II obesity; IIIO, class III obesity; M, men; NW, normal weight; TREL, theoretical risk exposure level; UW; underweight; W, women; |x|, absolute difference between FFM and FM, which may mathematically be +x or -x (±x).
# Values are presented as total means (standard deviation) for each variable. Between two continuous categories in a row, as FM percentage increases or decreases, FFM percentage decreases or increases, respectively.
# # From some studies, FM vs. FFM and FMI vs. FFMI in underweight and in class II/III obesity coincided with the lowest and the highest percentiles-quintiles, respectively, when thousands of subjects were included in both BMI categories.
# # # Sums of differences of the percentages may not be 100% because of rounding.
In most studies, subjects in the underweight range were excluded or not reported. Nevertheless, from datasets an approximate average for all variables was established from several studies including a few thousands of participants in that range (see Table S1).
Table S1: Relevant studies in the literature review of the associations between body composition measures and all-cause mortality. New, previously omitted variables derived from dataset or recalculating to support novel association findings.
|
|
|
|
Original association findings Novel findings from new variables (FMFFMR and |x|) |
||||||||||
|
Reference, Country, published |
Study (N), sex, age |
Follow-up |
Deaths (N) |
BC |
FM/FMI or VAT or other anthropometrics |
FFM/FFMI/LM/SM/aSMM/ASMI/ALM |
BMIs |
UW/≥ IIO (N or %) |
FM/FMI vs FFM/FFMI or FM vs LBM |
FMFFMR
|
|x|
|
||
|
Heitman et al21 Sweden (2000) |
N = 787 Men age 60 y |
1973-1995 22 y |
460 |
T.B.P. |
FM: linearly increasing A |
FFM: linearly decreasing A |
q3: 25.4; q1: 21.3; q2: 23.8; q4: OW: 27.1; q5: 30.2 |
No / No |
FM vs FFM: q3:23.4 vs 53.7 q1: 17 vs 48.1; q5: 33.1 vs 59.3 |
q3: 0.43; q1: 0.34 q5: 0.54 <1 in all |
29.6 % |x| >0 = + x |x| > 0 * |
||
|
Bigard et al22 Denmark (2004) |
N =57053 Both Age:50-64 y |
1993-2001 Median 5.8 y |
1851 |
BIA |
FMI: J-shaped A Below 20th P inverse A Above 20th P direct A |
FFMI: reversed J-shaped A Below 60th P: inverse A Above 60th P: NA |
P50: M: 26.2; W:24.8 P0 (UW): M: 15.4; W: 14.2 P100 (IIIO): M: 52.7; W: 58.6 |
Yes: 0.76% / - |
FMI vs FFMI: P50: M: 6.8 vs 19.4; W: 8.6 vs 16.3. P0: M: 0.8 vs 14.6; W: 0.6 vs 12. P100: M: 25.2 vs 27.5; W: 32.4 vs 26.2. |
P50: M:0.35; W: 0.52 P0: M: 0.05; W: 0.05 P100: M: 0.91; W: 1.23 <1 in all excepting P100 in W: >1 |
P50: M: 48%; W: 32% P0: M: -89%; W: -92% (|x| = - x) * P100: M: 4.4%; W:- 10.5% (|x| = - x) * |
||
|
Simpson et al23 Australia (2007) |
N = 41313 Both Age 27-75 y |
1990-2003 Median 11 y |
2822 |
BIA WC WHR |
M: FM: U-shaped A (Q1 vs Q5) WC, WHR: linear positive A W: FM: NA (Q2 vs Q5) WC, WHR: linear positive A |
NA |
P50 (OW): M: 26.9; W: 25.9 P0 (UW): M: 15.6; W: 14 P100 (IIIO): M: 54; W: 54.8 |
0.02% (M) and 0.9% (W) were underweight. 19% (M) and 22% (W) were obese |
FM vs FFM: P50: M: 23 (29%) vs 56.3 (71%) W: 26.5 (40.2%) vs 39.4 (59.8%) P0: M: 1.9 (2.4%) vs 77.2 (97.6%) W: 4.4 (8.1%) vs 50 (91.9%) P100: M: 79 (52.5%) vs 71.5 (47.5%) W: 94.2 (63%) vs 55.3 (37%) |
P50: M: 0.41; W: 0.67 P0: M: 0.02; W: 0.08 P100 (IIIO): M: 1.1; W: 1.7 <1 in all excepting P100 in both sexes |
P50: M: (42%); W: 19.6%: |x| = +x P0: M: -95%; W: -83%: |x| = -x P100: M: +5%; W: - 26% ( |x| = - x) |x| > 0 in all * |
||
|
Zong et al24 US (2016) |
N = 9471 Both Age ≥20 y |
1999-2010 Mean 8.8 y |
682 |
DXA |
FM%: q1,q3,q4 and q4 vs q2: direct A |
FFM%: NA |
q1: M: 19.5; W: 21.5. q2: M: 25.5; W: 24.9 q3: M: 28.2; W: 28.8 q4 : M: 32; W: 34.6 |
No / No |
q2: M: 25.5% vs 74.5%; W: 37.1% vs 62.9%. q1: M: 19.5% vs 80.5%; W: 30.1% vs 69.9%. q4 (IO): M: 34.4% vs 65.6%; W: 47.2% vs 52.8% |
q2: M: 0.34; W: 0.58 q1: M: 0.24; W: 0.43 q3: M: 0.40; W: 0.70 q4: M: 0.52; W: 0.89 <1 in all |
q2:M: 49%; W: 25.8% q1: M: 61%; W: 39% q3: M: 42%: W: 17% q4: 31.2%; W: 5.6% |x| >0 = + x in all * |
||
|
Padwall et al25. Canada (2016) |
N = 54420 Both. ≥40 y |
1999-2013 Med: 6.7/4.5 y |
M: 984 |
DXA |
FM%: M: Q4, Q5: direct A W: Q1,Q2,Q3,Q5: direct A |
FFMI/BMI: Q1,Q2: inverse A in either sex |
Mean (OW) : M: 27.4; W: 27 |
-/- |
Mean: M: 29.5% vs 70.1% W: 32.1% vs 67.9% |
M: 0.42; W: 0.47 <1 in all |
M: 40.6%: |x| >0 * W: 35.8%: |x| >0 * |
||
|
Lee et al26 US (2018) |
N = 38006 Men Age ≥40 y |
1987-2012 Mean 21.4 y |
12356 |
APE |
Predicted FM: monotonic positive A |
Predicted LBM: inverse A |
Mean : OW: 25.4 |
0.3% / 0.5% |
FM vs FFM: UW: 13.3 vs 47.5; NW: 14.5 vs 49.6 OW: 27.2 vs 59.9; IIO: 41.2 vs 77 |
UW: 0.27; NW: 0.29 IIO: 0.53 <1 in all |
UW: 56.4%: |x| >0 * NW: 54.8%: |x| >0 * IIO: 30%: |x| >0 * |
||
|
Liu et al27 US (2022) |
N = 55818 Both Mean age 45 y |
1988-2014 Median 9.7 y |
10408 |
APE |
Predicte FM: U-shaped A Q1, Q2, Q5 vs Q3: direct A |
Predicted LBM: L-shaped A Q1, Q2 vs Q3: Inverse A |
OW: Q3: M: 26.9-27.0; W: 26.1 NW: Q1: M: 21.3; W:22.6 IIO: Q5: M: 36.9; W: 35.4
|
Excluded / 30% |
FM vs FFM: Q3: M: 24.1 (FMI: 8.4) vs 59.3 (FFMI:18.5): 31.2% vs 68.8% W: 29.9 (41.7%) vs 41.7 (58.2%) Q1: M: <16.2 (FMI: <5.8) vs ≥ 31 (FFMI ≥15.5): 27.2% vs 72.8%. W: <21 (37%) vs <35.7 (63%) Q5: M: ≥31 (FMI: >10.6) vs ≥65.4 (FFMI: 26.3): 28.7% vs 71.3% Q5:W: ≥39.6 (45.6%) vs ≥47.2 (54.4%) |
OW: Q3: M: 0.45; W: > 0.71 NW: Q1: M: 0.37 W: 0.58 OW (Q3): M: 0.45 W: 0.71 IIO(Q5): M: 0.40 W: 0.83 <1 in all |
OW: Q3: M: 37.6% W: 16.5% NW: Q1: M: 45.6% W: 26% OW: M: 37.6% W: 16.5% IIO: Q5: M: 42.6% W: 8.8% |x| >0 = + x in all * |
||
|
Sedlmeier et al28 EU and US (2021) |
N = 16155 Both Mean age 45 y |
1994-2000 Median 14.3 y |
1347 |
BIA |
FMI: J-shaped A. BMI: 25.3±2.2 Q2 (7.3) vs Q4 (13): direct A |
FFMI: Q1 (16.1) vs Q2 (21.9): inverse A. BMI: 25.5±2.4 |
OW: q2: 25.4±2.3 NW: q1: 22.8 OW: q3: 28 IO: q4: 33.3±4.2 |
No / Low |
OW: q2: 7.3 (28.8%) vs 18 (71.2%) NW: q1: 5.2 (22.9%) vs 17.5 (77%) OW: q3: 9.2 (32.8%) vs 18.2 (67.2%) IO: q4: 13 (38.7%) vs 20.5 (61%) |
OW: q2: 0.40 (<1) NW: q1: 0.29 (<1) OW: q3: 0.48 (<1) IO: q4: 0.63 (<1) |
q2: 42.4%: |x| >0 * q1: 54.1%: |x| >0 * q3: 34.4%: |x| > 0 * q4: 22.3%: |x| >0 * |
||
|
Knowles et al29 UK (2021) |
N = 356590 Both Age 40-69 y |
2006-2010 Median 10.5 y) |
15844 |
BIA |
FM: J-shaped A: positive log-linear A
|
aSMM: J-shaped A: M: positive log-linear A W: curvilinear A |
OW: Mean: M: 27.6 ±4 W: 26.7 ±4.9 NW: Q1: M: 23.3; W: 21.6 IO: Q5: M: 33.1; W: 33.9 |
No / No |
FM vs FFM: M: 21.8 (25.4%) vs 64 (74.6%) W: 26.3 (36.8%) vs 45.1 (63.2%) FMI vs FFMI: Q1: M: 4 vs 19.3; W: 5.7 vs 15.9 Q3: M: 7.1 vs 20.5; W: 9.8 vs 16.9 Q5: M: 10.8 vs 22.3; W: 15.5 vs 18.4 |
Q3: M: 0.34; W: 0.58 Q1: M: 0.20; W: 0.35 Q5: M: 0.48; W: 0.84 <1 in all
|
OW: M: 49.2%; W: 26.4%. NW: Q1: M: 65.7%; W: 47.3%. IO: Q5: M: 34.7%; W: 8.5% |x| >0 = + x in all * |
||
|
Jung et al30 Germany (2024) |
N = 23725 Both Age 40-75 y |
2014-2019 (median 4.7 y) |
- |
MRI |
Mean VAT:3.3 dm3 direct A |
Mean SM: 12.6±3.3 dm3: inverse A Mean SMFF: direct A |
Overall (OW): 27.7±4.7 |
- / - |
mean SMFF (%): 16 ± 3.2: SM vs FM: >50% vs <50% |
FM > SM FMFFMR <1 |
|x| < 50% - >1% |x| >0 = + x * |
||
|
Jung et al30 UK (2024) |
N = 36317 Both Age 45-84 y |
2006-2010 (median 4.7 y) |
634 |
MRI |
Mean VAT: 3.5 dm3 : direct A |
Mean SM: 11.4±3 dm3: inverse A Mean SMFF: direct A |
Overall (OW): 25.9±4.3 |
- / - |
Mean SMFF (%): 18 ±3.2: SM vs FM: >50% vs <50% |
FM > SM FMFFMR <1 |
|x| < 50% - >1% |x| >0 = + x * |
||
|
Ghulam et al31 Italy (2023) |
N = 20587 Both Mean age:54±11y |
2005-2010 Median 11.2 y |
M: 751 W: 458 |
APE |
RFM: M: U-shaped A: nadir: 27.4 W: NA: nadir: 39.7 q4: M: direct A (RFM. 33.4±1.8) |
BMI > 35: direct A in both sexes |
Mean (OW): M: 27.4±1.4; W: 27.6±0.7 NW: q1: M: 23.4±2.8; W: 22.6±1.6 IO: q3: M: 31.9±1.4 W: 32.1±1.4 IIO: q4: M: 35.4±2 W: 38.4±3.3 |
No / 5.6% |
RFM (%) vs FFM (%): q2: M: 27.6 vs 72.4; W: 39.7 vs 60.3. q1: M: 23.9 vs 76.1; W: 36.6 vs 63.4 q4: M: 33.4 vs 66.6; W: 48 vs 52. FMI: M: q1: 5.8; q2: 7.3; q3: 8.6; q4:11; W: q1: 7.8; q2: 10.2; q3: 12.3; q4:16. FFMI: M: q1:18.5; q2:19.4; q3:20; q4: 22; W:q1: 15; q2:10.2; q3:16.2; q4: 17.5 |
q2: M: 0.38; W: 0.65
q1: M: 0.31; W: 0.57
q3: M: 0.43; W: 0.76
q4 : M: 0.50; W: 0.90 <1 in all |
q2: M: 44.8%; W: 20.6% q1: M: 52.2%; W: 26.8% q3: M:40%; W: 13.4% q4: M: 33.2%; W: 5% |x| >0 = + x in all * |
||
|
Farsijani et al36 US (2021) |
N = 2911 Both Age 70-79 y |
1996-1997 Average 12 y |
1873 |
CT DXA |
FM (kg) by DXA: M: inverse A; W: inverse A |
LBM: NA CT Mid-Tigh muscle area: inverse A in both |
Mean (OW): M: 28.9 W: 27.4 |
No / No |
LM: M: 55.5; W: 39.3. FM vs FFM: M: 24.3 (29.7%) vs 57.3 (70.3%) W: 29 (41.3%) vs 41.2 (58.7%) |
M: 0.42 W: 0.70 < 1 in all |
M: 40.6% W: 17.4% |x| >0 = + x in all * |
||
|
Abramovitz et al37 US (2018) |
N = 11687 Both Age: 45.3 y |
1999-2004 Median 9.3 y |
1819 |
DXA |
Mean FM%: 33.05 (both sexes) FM: NA |
Mean ASMI: 6.86 kg/m2 Inverse A |
Mean: 25.3 (both sexes); NW: 22.3; OW: 27; IO: 32.5 |
No / No |
NW: FM (29.7%) vs FFM (70.3%) OW: FM (36%) vs FFM (64%) IO: FM (40%) vs FFM (60%) |
NW: 0.42; OW: 0.56; IO: 0.66 <1 in all |
NW: 40.6%; OW: 28%; IO: 20% |x| >0 = + x in all * |
||
|
Jang et al38 Korean (2023)
|
N = 153248 Both Age ≥ 40 y |
2004-2019 Median 18 y |
6061 |
APE |
FMI: monotonic A WC: monotonic positive A |
FFMI: inverse monotonic A |
Nadir: 23-24.9: OW for Asian population Ref for FMI: 8.1 Ref for FFMI: 15.2 UW: 17.7; NW: 21.4 IO: 26.7; IIO: 31.8 |
1.7% / 3.1% |
OW: high FFMI > low FMI NW: 18.5-22.9: low FFMI > low FMI UW: low FFMI > low FMI IO: 25-29.9:high FFMI > high FMI IIO: ≥ 30: low FFMI/high FMI Positive linearity for WC |
0.53 in the nadir: FMI vs FFMI 8.1 (35%) vs 15 (65%). <1 in all excepting cases of IIO and very increased WC, where FMI > FFMI |
|x| >0 = + x in all * |
||
|
Rolland et al39 France (2023) |
N = 4574 W. Age ≥ 74 y |
1992-2011 Median 17.7 y |
2876 |
DXA |
FMI: reversed J-shaped A FM: inverse A |
LBMI: NA ASMI: NA |
OW: 25.2 ± 3.8 |
2.7% / 1.2% |
OW: FMI: 9.3 ± 3.1 (37%) vs FFMI: 15.9 ± 3 (63%) |
OW: 0.58 <1 |
OW: 26% |x| >0 = + x * |
||
|
Bea et al40 US (2015) |
N = 10525 W Age 50 – 70 y |
1993 – 1998 Median 13.6 y |
1762 |
DXA |
FM (Q3): 32.6 ; Q1: 19.4; Q5: 48.5; mean FM: 43.8% 50-59 y: linear +; >70 y: linear – |
LM (Q3):37.6; Q1: 36; Q5:40; FFM: 56%. < 60 y: linear – ; >70 y: linear + |
Q2: 25.6; Q3: 28.2; Q1: 22.5; Q5: 35.2 ≥ 35: increased risk: + A |
65/192 |
Q2: FM (40.3%) vs FFM (59.7%) Q3: FM (44.3%) vs FFM (55.7%) Q1: FM (33.2%) vs FFM (66.8%) Q5: FM (53.4%) vs FFM (46.6%) |
Q2: 0.67; Q3: 0.79 Q1: 0.49; Q5: 1.14 < 1 in all |
OW: Q2: 19,4% OW: Q3: 11.4% Q1: 33.6%; Q5: 6.8% |x| >0 = + x in all * |
||
|
Lee et al41 China (2012) |
N = 3978 Both. < 65 y |
2001-2003 Median 74.4 m |
383 |
DXA |
FM% : M: negative A; W: NA |
NA |
M: 23.2: low OW; W: 23.9: low OW |
No / No |
M: FM: 24% (5.2) vs FFM: 86% W: FM: 34.2% (6.1) vs FFM: 65.8% |
M: 0.27; W: 0.51 <1 in both: far from 1 |
M: 62%; W: 31.6% |x| >0 = + x * |
||
|
Wannamethee42 UK (2007) |
N = 4017 Men age 60-79 y |
1978-2005 Mean 6 y |
713 |
BIA |
FMI: NA |
FFMI: NA MAMC: inverse A |
Mean: OW: q2: 25-27.4 UW men were excluded q1: NW q3: 27.5-30 q4 ≥30 |
0.6% (excluded) / - |
FMI vs FFMI: q1: <7.6 vs <16; q2: 7.6-9.4 vs 16-17.1; q3: 9.4-11.5 vs 17.1-18.4; q4: ≥11.5 -≥18.4. FM vs FFM: q1: <32.1% vs >67.9%; q2: -35.4% vs -64.6%; q3: -38.4% vs -61.6%; q4: ≥38.4% vs ≤61.6% |
q1: NW: < 0.47 q2: 0.47 - < 0.54 q3: 0.54 - < 0.62 q4: ≥ 0.62 < 1 in all |
q1: NW: > 35.8% q2: 35.8 - > 29.2% q3: 29.2% - > 23.2% q4:> 0 - < 23.2% |x| >0 = + x in all * |
||
|
Kitahara et al43 US (2023) |
N = 280611 (9200 in class III) Both |
1976-2009 Median 10 y |
16769 (999 in class IIIO) |
WC APE |
Class IIIO: direct A |
High FFMI (FFMI > FMI) in both sex |
NW (ref) vs class IIIO IIIO: > 45 (median) |
No / 9215 in class IIIO |
FM vs FFM in class IIIO: M: 37.5% vs 62.5% W: 59.8% vs 40.2% FMI vs FFMI in class IIIO M: 16.8 vs 28.2; W: 26.9 vs 28.1 |
M: 0.6 (<1) W: 1.48 (>1) |
M: 25%: |x| >0 = + x W: -19.6%: |x| = - x |x| > 0 * |
||
|
Batsis et al44 US (2017) |
N = 4984 Both Age ≥ 60 |
1999-2004 Median 102 m |
2002 |
DXA |
FM ≥25%: M: A FM ≥35%: W: NA |
ALM: M: A; W. NA ALM + obesity: M: A; W: NA |
Mean BMI: M: 28.2 ± 0.1 W: 28.3 ± 0.1 |
No / No |
M: FM: 30.9% (0.2) vs FFM: 69% W: 42 % (0.13) vs FFM: 58% |
M: 0.44 W: 0.72 < 1 in both |
M: 38.2%; W: 16% |x| = + x in both |x| > 0 * |
||
|
Graft el al45 Switzrerland (2015) |
N = 3181 Both Age >65 y |
1990-2011 - |
1777 |
BIA |
FMI: NA |
FFMI: M: negative A W: NA |
Mean BMI: M: 24.6 (4.8) W: 24.6 (6.1) q1: M: 20.9: W: 20.3 q4: M: 27.6; W: 28 |
10% / 4% |
M: FMI: 6.7 vs FFMI: 18. FM: 26.2% vs FFM: 73.8%. W: FMI: 9.4 vs FFMI: 15.3 FM: 36.8% vs FFM: 63.2%. q1: FMI: M: < 4.7; W: < 6.8 FFMI: M: < 16.2; W: < 13.5 q4: FMI: M: >8.2; W: > 11.4 FFMI: M: > 19.4; W: > 16.6 |
NW: M: 0.35 W: 0.58 Low NW: q1: M: 0.28 W: 0.50 OW: q4: M: 0.42 W: 0.68 <1 in all |
NW: M: 47.6% W: 26.4% q1: M: 55.2%; W: 33.2% q4: M: 40.6% W: 18.6% |x| >0 = + x in all * |
||
|
Chang et al46 Taiwan (2022) |
N = 1199 Both |
2009-2018 Median 5.8 py |
103 |
BIA |
FM: NA FMI and VFAI: + A in W |
FFMI and SMMI: - A in both sexes |
Mean: 24.2 (3.5) |
- / - |
FM: 31.4% (8.2) vs FFM: 68.6% FMI: 7.8 (2.9); Mean FFMI: 16.3 (2) SMMI: 8.8 (1.25). VFAI: 49.4 (12.8) |
NW: 0.45: <1 |
NW: 37.2% |x| >0 = + x * |
||
|
Howell et al47 US-residing Mexican-americans (2018) |
N = 10329 Both |
1988-2010 Mean 10 y |
1423 |
BIA |
FM%, LM, FM: NA Ref value for FM: M: 22.5% W: 35.8% WC, WHtR: M: NA; W: + A |
LM: NA Ref value for BMI: 25 |
Mean: 28.1 (5.6) |
- /- |
FM: 31.5% vs FFM: 68.5% (both sexes) FM (kg): 23.9 vs FFM: 51.9 (both sexes) FM for NA: M: 22.5% vs FFM:77.5% W: 35.8% vs FFM: 64.2% |
OW: 0.45 Mean for NA: M: 0.29 (NW); W: 0.55 (low OW) <1 in all |
OW: 37% Mean for NA: M: 55% ; W: 28% (low OW): |x| >0 = + x in all * |
||
|
Chang et al48 Taiwan (2023) |
N = 1200 Both |
2009-2018 Median 5.8 py |
86 |
BIA |
FM%: W: + A: WC: W: + A
|
SMMI: M: - A WC: M: - A |
M: 24; W: 24.5 M: - A. (Ref < 23.8) |
- / - |
Mean FM%: M: 27.7%; W: 37.7% |
M: 0.46 W: 0.60 |
M: 49.6%; W: 24.6% |x| >0 = + x in all * |
||
|
Kimberly et al49 US (2025) |
N = 1291 Both |
2009-2021 Median 3.9 y |
111 |
BIA |
Mean BF%: M: 25.8 (7.4): NA W: 36.4 (8.9): NA |
Mean LBM: M: 61.9 (9.5): NA W: 43.5 (7.5): - A |
Mean: M: 27.4 (6.1) W: 27.3 (6.0) |
- / - |
Quintiles of BF%: Q1 (ref): M: <19.7; W: <28.2 Q3: M: 25.8 (7.4); W: 36.4 (8.9) |
Q1: M: < 0.25; W: <0.39 Q3: M: 0.34; W: 0.57 <1 in all |
M: Q1: 60%; Q3: 48% W: Q1: 44%; Q3: 27% |x| >0 = + x in all * |
||
Acronyms: A, association; APE, anthropometric prediction equations; aSMM, appendicular skeletal muscle mass (kg); ASMI, appendicular skeletal muscle mass index; ALM, appendicular lean mass (kg); BC, body composition; BIA, bioimpedance analysis; BF, body fat; BMI, body mass index (kg/m2); CT, computed tomography; DXA, dual energy x-ray absorptiometry; FFM, fat free mass (kg or %); FFMI, fat free mass index (kg/m2); FM, fat mass (kg or %); FMI, fat mass index (kg/m2); LBM, lean body mass (kg or %); LM, lean mass (kg); M, men; MAMC, midarm muscle circumference (cm); MRI, magnetic resonance imaging; NA: no association; NW, normoweight; OI; class I obesity; OII, class II obesity; OIII, class III obesity; OW, overweight; P, percentile; q, quartile; Q, quintile; RFM, relative fat mass (%); RAF, relative abdominal fat; SMMI, skeletal muscle mass index; VAT, visceral adipose tissue; VFAI, visceral fat area index; W, women; WC, waist circumference; WHR, waist-to-hip ratio; WHtR, waist-to-height ratio; UW, underweight; |x|, modulus “x” as the difference absolute between FFM and FM (may be in kg or %, |x| may be +x or - x).
* p <0.05 in favor of FFM or FM as appropriate. In any significant level for |x| > 0 FMFFMR is significantly different to 1.
# Data are means (standard error), medians or representative means. Sums of percents may not be 100% because of rounding.
# # Body composition studies include those studies that assessed measurements of FFM, FFMI, LBM, aSMM, ASMI, muscle areas, and/or FM, FMI, VAT from techniques such as bioimpedance analysis, CT, MRI, total body potassium, DXA and APE that among other anthropometrics included waist circumference and height. Specific studies of sarcopenia and muscle quality and mortality are not included because they are not applicable. Studies of BMI alone or body fat distribution indices without accounting for body composition measures are not included.
From body composition studies involving several hundred thousand participants in the normoweight, overweight and class I obesity range, the total means were collated. In the class II obesity category, tens of thousands of individuals were represented from different studies, and several thousand individuals with class III obesity were included from a few studies. All variables showed a significant difference in the ANOVA test for all categories (p<0.001), (see Table 2). All variables were significantly different (p<0.05) when analyzing the t-test between each two continuous categories, excepting the comparison between I and II categories in men. As a result, in men, the musculoskeletal component was higher in class II than in class I, and occurring vice versa for the fat component. However, FM and FFM percentages and FMFFMR were non-significantly different (p = 0.3, p= 0.8 and p= 0.4, respectively). In contrast, BMI and FFMI were significantly different (p <0.05 in both). In the class III obesity category, the mean FMFFMR and |x| percentage was significantly different between men and women (p <0.001); FFM predominated in men and FM in women. The maximum risk exposure level from a mean FMFFMR of 1.4 was reached in class III obesity by women, while men at the same risk level reached a mean FMFFMR of 0.87. As a result, a mean FMFFMR =1 was established for women coinciding with a BMI value of ~46 kg/m² (inferior limit of SD in class III obesity). In men of the same category, a BMI value of ~45 kg/m² in the inferior limit of SD coincided with a FMFFMR of 0.87. The highest risk from a mean FMFFMR close to zero and mean |x| >80% in favor of FFM was reached in underweight range in either sex (p <0.001).
3.2 Relationships Between Variables
Relationships between variables and BMI risk categories were plotted in Figures 2, 3 and 4. Scatterplots were used to show relationships between FMFFMR and |x| percentage within BMI categories, separated by sex. The position of data points shows a linear dose-response with a high R-squared in all analyses (p<0.001). The trend line for FMFFMR showed a strong positive correlation, while that of |x| percentage showed a strong negative correlation (see Fig 2). Regarding partial trends, there was a gap between class I and II obesity categories in men due to a slightly negative and positive slope, “m”, for FMFFMR and |x| percentage, respectively (linear equations not shown).
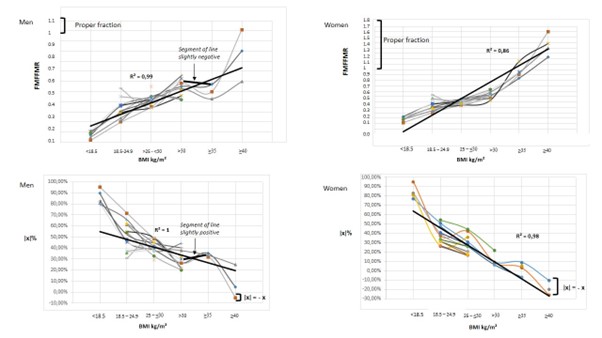
Figure 2: Scatterplots showing relationships between FMFFMR and |x| percentage with BMI across the entire risk spectrum, differentiated by sex.
BMI, body mass index; FFM, fat-free mass; FM, fat mass; FMFFMR, fat mass-to-fat-free mass ratio; |x|, absolute difference between mean FM and FFM percentages.
* All total mean values for FMFFMR and |x| percentage were significantly different between all risk categories (p <0.001).
** Values for mean FM and FFM percentage within each risk category were significantly different by sex (p<0.001).
# Dots in each position represent mean values (standard deviation) from each population study. The same mean BMI in each risk category may correspond to different FMFFMRs and |x| values, demonstrating inequality between FM and FFM in each risk category.
# # Values for FMFFMR between class I and II obesity in men revealed a gap in the general trend line. The “m” slope in this segment of the line was negative (“m” < 0) (i.e., as BMI increased, FMFFMR decreased). In the same segment of line, a positive slope “m” resulted for |x| percentage (“m” > 0) (i.e., as BMI increased, |x| percentage increased).
# # # The maximum risk exposure level by increasing FMFFMR was observed in women with class III obesity, who presented a total mean FMFFMR >1 and a total mean |x|% being equal to – x (FM% > FFM%). Men reached the maximum risk with a total mean FMFFMR <1 and |x| percentage being equal to + x (FFM% > FM%).
Stem-and-leaf plots for FM and FFM percentages showed a linear dose-response analysis in either sex with significant differences between FM and FFM components either intra- or intercategories (all p <0.001), (see Fig 3).
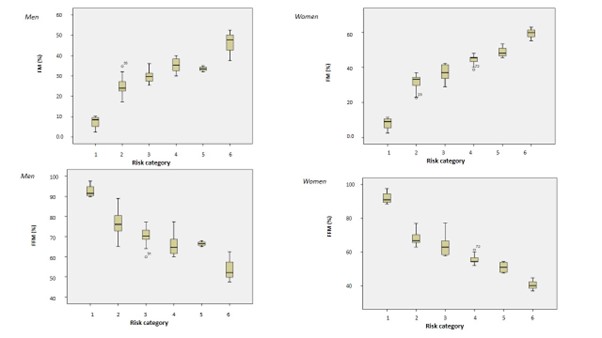
Figure 3: Stem-and-leaf plots showing relationships between FM% and FFM% with BMI across the entire risk spectrum, differentiated by sex.
BMI, body mass index; FM, fat mass; FFM, fat-free mass; categories: 1: BMI < 18.5 kg/m2; 2: BMI ≥ 18.5 – 24.9; 3: BMI ≥ 25 –< 30; 4: ≥ 30 – <35; 5: ≥35 – < 40; 6: ≥ 40.
* All mean values for FM% and FFM% were significantly different between all risk categories (p <0.001).
** Values for the total mean FM% and FFM% within each risk category were significantly different sex by sex (p<0.001).
# The scale on the y-axes may vary, because men and women usually have significant differences between FM and FFM when comparing by sex. Only in the underweight range were body components for men and women found to be similar (significance level was not measured).
# # Values between 4 and 5 categories in men showed a gap in the total linearity, primarily due to a lower FM% in category 5 than in 4; subsequently, FFM% was higher in 5 than in 4 category. Accordingly, in men, the “m” slope in this segment of the line was negative (“m” < 0) and positive (“m” > 0) for FM and FFM, respectively.
FM and FFM percentages showed positive and negative correlations, respectively, across all BMI ranges. Between class I and II obesity in men (linear equation not shown) FM and FFM percentages showed a negative and positive slope, “m”, respectively, for indicating that class II obesity reached a lower mean FM% than that of class I obesity (p =0.3), while for FFM% occurring vice versa (p = 0.8). In women with class III obesity an equivalent risk between FM and BMI was reached (mean FM > 50%; |x| = – x; p <0.001). In men with class III obesity the total mean FM% was <50% (p <0.001). An equivalent risk between FFM and BMI was reached in underweight range in either sex (mean FFM > 90%; |x| = – x; p <0.001). FM and FMI values on the one hand and FFM and FFMI values on the other hand showed a linear dose-response and positive correlations across all BMI ranges in either sex with significant differences between both mass components either intra- or intergroups (all p <0.001). There was a gap between 4 and 5 risk categories in men due to non-significant differences for FM and FMI, p = 0.2 and p = 0.7, respectively. FM and FMI values were higher in class II obesity than in class I, but the partial trend line between 4 and 5 risk categories in men was almost a horizontal line for both variables (linear equations not shown). FFM and FFMI values were significantly higher in men with class II obesity category than in those of class I (p <0.05).
Stem-and-leaf plots for FM and FFM values showed a positive linear trend across all BMI ranges in either sex (p <0.001). In men, FM between 4 and 5 categories showed a partial trend line almost horizontal (“m” slope ~ 0) and significantly different than that of women between the same 4 and 5 categories (positive slope for women: “m” > 0), (see Fig 4).
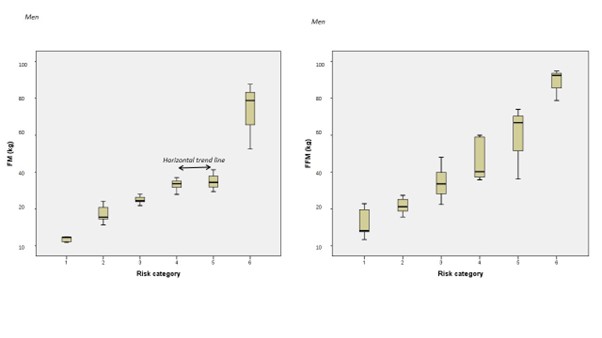
Figure 4: Stem-and-leaf plots showing relationships between FM and FFM with BMI across the entire risk spectrum, in men.
BMI indicates body mass index; FM, fat mass; FFM, fat-free mass index; categories: 1: BMI < 18.5 kg/m2; 2: BMI ≥ 18.5 – 24.9; 3: BMI ≥ 25 – < 30; 4: ≥ 30 – <35; 5: ≥35 – < 40; 6: ≥ 40.
* All total mean values for FM and FFM were significantly different between all risk categories (p <0.001).
** Values for the total mean FM and FFM within each risk category were significantly different (p <0.001).
*** Values between 4 and 5 categories showed a partial trend line almost horizontal for FM, primarily due to a non-significant difference (p = 0.2); subsequently, FFM was significantly higher in class II than in class I obesity (p < 0.05) and the partial trend line was positive.
The relationships between BMI and body composition measures throughout all the associations as well as mathematical conceptualisations for understanding the true overall risk in predicting all-cause mortality are shown on a graphical abstract (Figure 5).
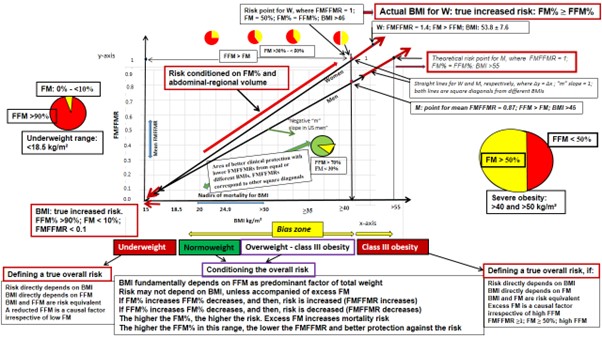
Figure 5: Real-world data relationships between BMI and FMFFMR from associating body composition measures with all-cause mortality worldwide. Square diagonals are drawn in either sex from a linear function between mean FMFFMR and BMI values across all risk exposure levels.
BMI, body mass index; FFM, fat-free mass; FM, fat mass; FMFFMR, fat mass-to-fat free mass ratio; M, men; W, wome
* A unit of 0.1 in the variation for FMFFMR (y-axis) between 0 and 1 values is aproximately equivalent to 3.3 and 4 kg/m² of BMI (x-axis) in women and men, respectively. BMI values cannot be arranged in scale because of different risk equivalence between sexes (i.e., each “m” slope = 1 goes from around 15 in either sex up to ≥46 and theoretically >55 kg/m² in women and men, respectively. BMI and FMFFMR as (x, y) Cartesian points only are risk equivalent in each square diagonal, separately by sex.
** Zero as value in the y-axis for FMFFMR is mathematically possible, although epidemiologically being not compatible with full life (cases of underweight individuals, who can hardly have zero percentage of FM). In contrast, the anthropological observation that one can have low or almost zero percentage of FM is not incompatible with the reality that one can be too lean (e.g., population subcategories such as normoweight individuals trained in endurance, athletes in overweight-obesity ranges and body builders) and presenting a lower FMFFMR belonging to another square diagonal with different risk equivalence and different BMI values at the origin and theoretical final.
ǂǂ In men between class I and II obesity the partial trend line showed a slightly negative slope “m” mainly due to US adults who presented a lower FMFFMR in class II than that of class I obesity (see text). The Cartesian point for mean FMFFMR in US men with class II obesity would correspond to a different square diagonal, where risk equivalence between FMFFMR and BMI is different than that of the overall population within the same BMI range.
ǂǂ ǂǂ From normoweight to class III obesity, as FMFFMR increased mortality risk was increased due to FM% increasing and FFM% decreasing. In that wide range, a bias zone for BMI values may be found due to equal-different BMIs corresponding to different-equal FMFFMRs, and therefore, the risk being conditioned on both FM and FFM percentages.
4. Discussion
4.1 General and Novel Observations
This research mathematically demonstrates that the impact of BMI on all-cause mortality cannot be causally assumed from any level of association measured by a standard statistical technique. From underweight to class III obesity, in all means BMI by category FM and FFM consistently showed inequality, while risk equivalence between mean FMFFMR and BMI was different across the different categories. Total mean BMI in either sex was in the overweight range (27.3 and 27.9 kg/m² for men and women, respectively). This is consistent within the historical range for nadirs of all-cause and CVD-related mortality on millions participants worldwide (i.e., nadirs being located between normoweight and class I obesity) [2-18, 21-23, 29, 62]. However, since body weight is the sum of FM and FFM, it is impossible to determine a total causal risk from any BMI cut-off without demonstrating an equality between the two components. Only if a mean FMFFMR ≥1 falls on the square diagonal from all FMFFMR and BMI values arranged on the respective y and x coordinates, the ratio and mean BMI are mathematically equivalent in capturing the whole-risk, and then, FM and FFM can they be considered to have the same risk contribution [18, 19, 32, 33], (see Fig 5). In any another mean BMI between underweight and severe obesity, if FM and FFM show significant differences in favor of FFM, any BMI- associated risk may be biased, even coinciding with an equivalent mean FMFFMR falling on the square diagonal. This mainly arises due to a protective overestimate of FFM with respect to FM; in all reported mean BMI by category, except for that of women in class III obesity [2-19, 22-33, 35-37], FM was consistently lower than FFM, leading to an underestimation of the risk contribution of FM. Biologically, only greater BMI variability—together with significantly increased central obesity and FM percentage—may serve as an accurate risk marker for CVD and cardiovascular mortality [18, 19, 29, 37, 50-55].
From our findings, in any type of mortality occurring from normoweight to class III obesity in women, mathematically is possible to say that FFM always presented a protective overestimate over FM. This is because outside both ends of the BMI ranges FM and FFM never reached equality (i.e., all mean |x| values significantly were >0; all FMFFMRs <1 and all differences between FM and FFM percentages were significantly in favor of FFM), and therefore, BMI and FM never being risk equivalent for a same causal risk. Only women in class III obesity presented a mean for |x| percentage and FMFFMR where mean FM was higher than that of FFM (mean |x| = – x and FMFFMR >1, respectively), and therefore, BMI directly depending of FM. This is coherent with the linear equation for women, where if in class III obesity FMFFMR as y variable =1, BMI value as x variable is equivalent to FMFFMR and the “m” slope =1, and both variables and values having the same sensitivity and measuring the same overall risk. In reverse, in underweight range, BMI directly depends on FFM, and while FFM percentage being close to 100% of weight (FMFFMR close to zero) in either sex, BMI captures the maximun risk with the same sensitivity as that of a reduced FFM (see Fig 1 and 5). Clearly, we have just demonstrated that men a women showed different risk equivalence between FMFFMR and BMI, excepting in underweight category. This is because in the rest of categories mean BMIs corresponded to FMFFMRs and body compositions differentiated by sex. Likewise, some population subcategory in men with class II obesity was found outside the respective overall square diagonal. In this case, mean FMFFMR for this subcategory was lower than that of the mean population in class II obesity (see Fig 2). From a Cartesian approach, any BMI-associated risk may be causally biased if the two body mass components are accounted for, and a same variation for FMFFMR may belong to another different square diagonal, where risk equivalence with BMI consistently differs (e.g., men and women moving along different square diagonals, where a same y value corresponds to different equivalent values of x in either sex).
4.2 What studies tell us about associating BMI and body composition measures with all-cause mortality
Evidence indicates that the relationship between the FM percentage, high cardiometabolic risk, and specific-cause mortality risk on the right branches of the J-shaped curves is predominantly driven by its correlation with visceral adiposity [18, 19, 32, 33, 50, 52-62]. Similarly, from studies on myocardial infarction, it is well known that BMI underestimates whole-body fat and abdominal obesity as measured by relative abdominal volume and waist-to- height ratio [18, 19, 32-34, 50, 52, 55-57]. Conversely, weight loss with reduced FFM and low BMI broadly impacts specific-cause mortality differently than increasing the FM percentage and abdominal fat volume [16-19, 22-30, 56-61]. Specific causes of death associated with low BMIs are located on the left branches of the curve patterns [2-18]. Hence, if the association of BMI with all- cause mortality consistently indicates different epidemiological cut-offs between normal weight and 30 kg/m2 [2-18, 21-23, 29, 62], this suggests a problem in inferring causality from BMI alone.
Among more than 30 millions of participants, the lowest risk of mortality occurring between normoweight and 30 kg/m2 has been widely debated [2-18]. In many studies measuring body composition, FM and FFM appear significantly different across all BMI categories, and when dividing by percentiles, quartiles, or quintiles [18, 22-31, 34, 36, 38, 39]. After recalculating relative FM from WC and height in data from the UK Biobank, evidence of a causal association bias was indicated for BMI in predicting myocardial infarction, while significant inequalities between mean FM and FFM were mathematically demonstrated [18, 19, 34, 56]. Based on the same technologically validated anthropometric equations [34], a cohort study in a general Italian population was conducted on the association between BMI, relative FM, and mortality [31]. It was found that the mean or median of BMI in the Italian population was in the overweight range in both sexes, while FM and FFM percentages were significantly different in favor of FFM (mean FMFFMR <1; nadirs for relative FM were found in the 2nd quartile in both sexes). From these findings, only men and women with BMI > 35 kg/m2, and men in the 4th quartile of relative FM showed an independent association with mortality, while women showed no association [31]. However, the underweight range was not represented, and men and women in the 1st quartile exhibited mean FM percentages of <25% and >30%, respectively, which may indicate inconsistency in the results [31]. All women showed higher mean FM and lower mean |x| values than men; however, in both sexes a causal association bias was present due to a protective overestimation of FFM relative to FM. In another recent study on all-cause mortality from UK Biobank data [29], technologically measured FM-associated risk was concluded as not being superior to that of BMI in either sex when the BMI cut-off was in the overweight range. Among their findings, mean FM showed a positive log-linear association in both sexes, while appendicular skeletal muscle mass showed a positive log-linear association for men and a curvilinear relationship for women. However, after analysing new anthropometric variables from the dataset, a discrepancy between mean FM and recalculated FFM— as well as a mean |x| >0—was also demonstrated. In this mathematical context, the same FMFFMR may correspond to different BMIs and different |x| values. However, BMI-associated risk was established from a unique mean BMI [18, 19, 51], and therefore, FM and FFM could not be considered to be equal or have the same risk contribution. Likewise, after calculating FMI and FFMI from mean weight and height, the lowest values for FM, FMI, FFMI, and appendicular muscle mass may be found in the 1st quintile corresponding to the normal weight range in both sexes. From there, all values progressively increase to the highest values in the 5th quintile (see Table 3). Under this reading, FM and the musculoskeletal component may be associated with CVD and mortality risk [18, 19], but FFM is not a plausible causative factor. This is because FM, FMFFMR, FFMI, and appendicular skeletal muscle mass linearly increase, but the final |x| value and total FFM percentage decrease without reaching equality between components. In consonance with our findings, in a recent systematic review [13], a subgroup analysis of diabetic patients showed a greater mortality risk in those in the highest BMI (> 35 kg/m2) range; among older diabetic patients, BMI values < 20 kg/m2 were also associated with the highest risk.
From other studies, it has been suggested that different contributions of FFM and FM to BMI may explain the shape of the association between BMI and mortality, as well as the controversial issue of the so-called obesity paradox [16-19, 21-30, 34, 36, 38- 40]. Similarly, studies in Denmark, Canada, the US, and European cohorts have found that technologically measured FM percentage was significantly associated with increased risk of total mortality [22, 25-28]. Using pooled data and sexes combined from 7 prospective cohorts that included European and US participants [28], the results showed an increased risk for high levels of FM (FMI of 13 kg/m²: 38.4% of FM [61.6% of FFM] in 4th quartile). On the other hand, high levels of FFM (FFMI of 21.9 kg/m²: 68.6% of FFM [31.4% of FM] in 4th quartile) showed an inverse association [28]. Broadly, most of studies showed mean references of BMI located in overweight ranges, whereas body composition provided important prognostic information on an individual’s mortality risk, not provided by BMI. Accordingly, different studies comparing the highest and lowest quartiles or quintiles of lean mass/FFM/FFMI and FM/FMI concluded that excess FM is related to increased mortality risk and that FFM is protective [22, 25-28, 31]. This statement holds true under the understanding that FMFFMR increases linearly towards a maximum risk coinciding with a value of ≥1, whereas in the highest quartiles or quintiles, a higher FFM percentage determines a lower FM percentage and FMFFMR. In this situation, a lower FMFFMR in the y-axis, in direct association with the risk, falls on a flatter partial trend line (i.e., a different “m” slope) with lower overall risk until reaching their maximum in y ≥1. From this Cartesian perspective, a mean FMFFMR value of ≥1 (with an “m” slope = 1) could only be reached in very high mean BMIs beyond the onset of severe obesity. Notably, from a representative sample of US adult males showing that lean mass was inversely associated with mortality [27], it is possible to demonstrate that in 5th quintile (representing class II obesity), FM and FMI were higher than in 3rd quintile of the overweight class; however, the final FM percentage was lower in the top quintile than in the third. Similarly, the final FFM percentage was higher in the fifth quintile than in the third. This data revealed a higher mean |x| and lower FMFFMR in class II obese than in overweight individuals (see Table S1). When comparing European men [29, 31] with their US counterparts [27], the new variables may reveal new findings. Effectively, all reports presented a nadir of mortality around a mean BMI in the overweight range; however, the mean FMFFMR was similar in European men (0.34 and 0.38 for English and Italian men, respectively), but was different to that of US men (mean FMFFMR = 0.45). Similarly, in the top quintiles and quartiles, the mean BMI was around class II obesity (between 33 and 36.9 kg/m2) in all; however, FMFFMR was 0.40 in US men and 0.48 and 0.50 in English and Italian men, respectively. This means that US men with BMIs similar to those of European men presented different FMFFMRs and |x| values; this may explain the lower mortality risks from the same high BMIs. Participants in the US study [27] showed a higher mean FFM and lower FM than those of European studies [29, 31]. For US subjects, the segment of the risk line between overweight and class II obesity rising towards FMFFMR = 1 would be flatter than that of European men; this lower slope would indicate the protective effect of lean mass in that specific range of BMI. In contrast, those studies showing higher mean FMFFMR and lower |x| percentage—between any nadir of mortality and a mean FMFFMR of 1—showed greater risk. This is because total FM percentage increased while the mathematically related FFM percentage decreased, regardless of increases in FFMI or relative muscle mass from the lowest to the highest quartiles or quintiles, as observed in European studies [29, 31]. So, while appendicular muscle mass or other relative musculoskeletal components appeared directly associated with CVD and mortality [29], they were not in fact causative factors, but a result of a spurious risk association [18, 19, 32, 33, 50, 55]. In the Melbourne Collaborative Cohort study [23], BMI and bioimpedance-assessed FM for men in the first and fifth quintiles were associated with mortality; meanwhile, FM in women was not associated when comparing the top and second quintiles. However, when re- analysing the variables, BMI at the 50th percentile fell within the overweight range in both sexes, while FM and FFM percentages exhibited inequality and significant differences within the same percentiles for both sexes. Additionally, FM and FFM were significantly different in all percentiles (|x| >0 in all). A risk equivalence between FM and BMI was only observed at class III obesity in both sexes. Thus, the linear positive associations in both sexes for waist-to-hip ratio and WC with mortality that were reported in this study may derive from an enlarged WC, high FM percentage and abdominal volume [18, 19, 23, 32, 33, 35, 50, 55,57].
Whole-body FM, visceral adiposity, and whole-body FFM have been associated with mortality, CVD and different types of cancer risk, including for pre- and postmenopausal breast cancer and colorectal cancer in men [29, 40, 41, 56-60, 65-76]. Similarly, a mean BMI in the overweight/class I obesity range, with high mean values of FM and FFM, has been epidemiologically collated from many at-risk individuals [16-19, 21-34, 36, 38, 50-56, 68-76]. Based on these anthropometric profiles associated with high cardiometabolic risk, a somatotype can be defined that combines high musculoskeletal and fat components, and shows a strong positive correlation with visceral fat accumulation and abdominal volume—measured directly by technology or indirectly by waist- to-height ratio [18, 19, 29, 32, 33, 41, 50, 54-60, 65-76]. Thus, if FFM and muscle mass have inversely been associated with mortality [16-18, 21-30, 34, 36, 37], any musculoskeletal component—whether assessed as FFM, appendicular skeletal muscle mass, or mesomorphy etc.,—may appear artificially associated with CVD, type II diabetes and cancer. In these situations, a strong correlation with BMI, visceral adiposity, and mortality risk can also be maintained [18, 19, 29, 32, 33, 37, 41, 50, 55-62, 67-69]. However, in a high BMI—but below class III obesity—the musculoskeletal component would constitute the largest proportion of BMI representing an implausible part of the causal risk. Interestingly, in a study of Korean adults using validated anthropometric prediction models, participants were classified into four body composition types according to tertile distributions for FMI and FFMI [38]. In this Asian population, FM and FFM showed a positive and inverse association with all-cause mortality, respectively. This is consistent with the Shanghai Health Study, in which the waist-to-hip ratio was linearly associated with all-cause and CVD mortality in both sexes [64]; it should be noted, however, that this index may also show a causal association bias with respect to overall WC when the mean waist-to-hip ratio <1 [18, 19, 32, 33, 50, 64]. In addition, WC has shown a positive linearity with mortality due to its high biological correlation with FM percentage [18, 19, 23, 26, 27, 29, 30-33, 35, 53, 57].
In the Health ABC Cohort Study, which directly measured body components in older adults in the overweight range, total lean mass was not associated with mortality in either sex, while mid-thigh muscle area exhibited a significant inverse relationship [36]. Nevertheless, lean mass and FM were significantly unequal in both sexes. Controversially, some studies using direct body composition measures in older women have associated both low and high adiposity with mortality [39, 40]; however, in an overweight range, both mass components were also significantly different. In contrast, from similar BMI cut-offs in the normal- or overweight ranges, other studies have shown that low FFM and lean mass—as well as low arm muscle circumference—were associated with mortality in men [16, 17, 22, 26, 27, 42].
4.3 Rationale Behind this Research
In our research findings, across all types of mortality occurring from normoweight to class III obesity [2-19, 22-31, 34, 36, 39, 40, 43], FFM consistently presented a protective overestimation relative to FM. This is because outside both extremes of the BMI ranges FM and FFM were never mathematically equal (i.e., all mean FMFFMRs and |x| percentages significantly were < 1 and > 0, respectively). Therefore, BMI and FM could never be considered risk equivalent for the same causal risk [16-19, 22-31, 34, 36, 50, 64]. Only women in class III obesity exhibited a mean |x| percentage and FMFFMR in which mean FM exceeded mean FFM (mean |x| = – x and FMFFMR >1, respectively), indicating that BMI depends primarily on FM in this category. This is coherent with the square diagonal for women, where if the y value for FMFFMR = 1, the x value, BMI = 46 kg/m², is risk equivalent. Therefore, values ≥1 and ≥ 46 kg/m² for FMFFMR and BMI, respectively, have the same sensitivity and measure the same causal risk (see Fig 5). In reverse, in the underweight range, BMI directly depends on FFM, and when the FFM percentage is higher than 90% of weight in either sex, BMI captures the maximum risk with the same sensitivity as FFM.
Evidence supports that a low FM (with low BMI) and high FFM/lean mass (with high BMI) have appeared to be associated with greater CVD, cancer and mortality risk [29, 38, 56-60, 64-77]. However, as we demonstrate here, a low FM close to zero percent may not be biologically responsible for greater mortality risk, unless accompanied of a high FFM percentage in the lower range of BMI. Similarly, a high FFM may never be responsible of excess rates of total mortality, unless accompanied of high FM percentage and high BMI (i.e., the lowest mean for |x| percentage [close to zero or even being negative: |x| = – x] and the highest for FMFFMR [close to 1 or even being >1]), and in any case, FM is either close to, similar to, or higher than FFM. In our results, a linear dose- response analysis from the relationships between FM and FFM may be demonstrated in associating excess rates of total mortality at the both ends of the range of BMI, and after accounting for thousands of participants in underweight and in class III obesity [22, 23, 27, 31, 43, 78], (see Table S1). In fact, linearity was observed after verifying a higher FM percentage, higher FMFFMR and a lower |x| percentage as FFM percentage decreased from underweight towards class III obesity in either sex. A gap in this linearity was observed between class I and II obesity in men, mainly due to a US study population that presented a higher musculoskeletal component and lower FMFFMR in the class II obesity range [27] than subjects of other populations, producing a slightly negative “m” slope for FMFFMR in that partial line segment. Similarly, a gap in the linearity for FM and FMI was observed between 4 and 5 risk categories in men, owing to a non- significant difference between class I and II obesity for both variables, producing in their partial trend lines an “m” slope almost horizontal. This confirms that small positive variations in FM/FMI values may not correspond to higher final FM percentages. This is because FFM/FFMI can increase in a higher proportion resulting in a higher and lower final FFM and FM percentage, respectively (i.e., a lower final FMFFMR may justify a lower overall risk within a higher obesity range, and then, FFM explaining a protective effect because FMFFMR belongs to another “m” slope with different risk equivalence). In addition, from all studies in men with class III obesity, mean FFM was always higher than that of FM for indicating the predominance of the first, and FM and BMI never reaching for the same sensitivity.
Mathematically, two diverging square diagonals, one by each sex, go up from underweight (BMI = 15.4 ± 1.2 and FMFFMR close to zero) to a FMFFMR value of 1 (severe obesity, where BMI is ≥ 46 and around 55 kg/m² in women and men, respectively), (see Fig 5). That way, two different diagonals are described and differentiated by sex, and besides, with different risk equivalence between mean FMFFMRs (SD of ≤0.1) and BMIs (SD of ≥ 0.8 – ≤ 3.5) along each diagonal. In this approach, each mean FMFFMR value falling on the square diagonal represents a different body composition and risk, and each x and y Cartesian point show different risk equivalence sex by sex. On this basis, any Cartesian point outside the diagonal in either sex and population will not show a risk equivalence between its y-value (FMFFMR) and any coinciding value of x, even being in the same BMI range. Thus, any non- equivalent risk point assigned to BMI between FMFFMR >0.1 and 0.99 (<1) in either sex can always be biased with respect to the true causal risk measured from any FMFFMR of <1 falling on the diagonal. This is because from underweight range up to FMFFMR = 1, each Cartesian value for y and x can correspond to another square diagonal, where risk equivalence between FMFFMR and BMI is divergently different, as consistently occurred between men and women or between European and US men with class II obesity [27, 29, 31], (see Fig 5).
From a syllogistic approach, if FMFFMR <1 is associated with healthy/surviving individuals (first true major premise) and being any mean FFM percentage > FM percentage on a dataset (second true premise minor), any BMI-associated risk above FM percentage will be a false conclusion drawn from a mathematical misconception. Obviously, not all individuals with a FMFFMR <1 may have a real risk as true conclusion, at least if BMI-associated risk is only measured from non-experimental statistical models. As mentioned above, between underweight and any mean FMFFMR of <1 FFM will always show a protective overestimate over FM, and BMI biasing any associated risk [18, 19, 33, 34].
In another order, obesity has emerged as an important predictor of overall mortality and different BMI-related diseases, such as type II diabetes mellitus, dyslipidaemia, hypertension, and sleep disorders [2-19, 22, 23, 27, 31, 44, 78-81]. However, in any cause-specific mortality involved with weight loss and the lower range of BMI, pathogenesis likely differs from that of weight gain and increasing FM, visceral adiposity/abdominal volume, or lived years with obesity [16-19, 32, 33, 40-43, 50, 53, 60, 62, 57-78].
Epidemiologically, BMI cut-offs located from normal weight to class III obesity is primarily reflect increasing FM percentage, FMI, and visceral/central adiposity, and subsequent elevated risk of CVD, type II diabetes, and cancer [2-19, 21-30, 32, 33, 42-44,50, 53-60, 65-77, 81-87]. At the opposite end of the BMI spectrum, biological risk emerges from the depletion of energy reserves and protein deposits that coincides with reduced FFM due to undernutrition, severe sarcopenia, neurological disorders, or other clinical conditions [2-19, 21-30]. Consistent with this, ±x values, FMFFMRs, FMIs, FFMIs, and BMIs in underweight ranges all differ from those of subjects with high BMIs and higher cardiometabolic risk.
Because of real-world data in non-experimental studies were not randomised, from normoweight up to ≥46 kg/m2 in women BMI always depended on both FM and FFM, whereas a significant inequality and different risk consideration may be demonstrated. Regarding this issue, if after using a mean BMI located in a healthy body composition one ignores the mean of the individual differences between FM and FFM, then, one omits a confounding factor for distorting any causal inference from BMI association [18, 19, 33]. This is because if percentages of FM and FFM are different in two groups of comparison, the difference in means may never be equal to zero, and any mean |x| value in the total sample will be>0 for demonstrating an unbalanced distribution, and between- groups comparing for different high-risk body compositions. For the same reason, any mortality risk prediction in men compared with women always appeared with a higher bias error due to differences in body composition, and mean |x| values being always higher in men than in women [16-19, 22-30, 34, 36], (see Table 2). This explains why women reached class III obesity with a mean FM > FFM, while in men FFM continued to be the predominant factor (mean FFM > FM). Otherwise, from FMFFMR values in the y-axis and a similar BMI value at the origin of x-axis, men and women present different “m” slopes until reaching a FMFFMR value of 1, there where BMI and FM have the same sensitivity. Thus, a different square diagonal between sexes involves that from underweight to severe obesity a similar BMI in either sex indicates a different body composition and mortality risk. Since association does not equate to causation, it is possible to understand that FM also may be associated with mortality risk in the underweight range. However, from a Cartesian perspective, FM may never be the causal factor because in a low range of BMI a reduced FFM is mathematically independent of FM and FM- related indicators. In this situation, FM component participates minimally in total body mass (i.e., FM <10% and |x| = – x, with a trend line towards zero and 100 percent of FM and FFM, respectively), (see Fig 5). In contrast, between underweight and class III obesity, the lower the |x| positive value, the higher the risk, mainly due to excess FM and a lower difference between the final FM and FFM percentages. In this situation, although FFM is the largest contributor to BMI, any musculoskeletal component cannot be considered the causal factor. Instead, a higher FM percentage is a critical determinant of risk, while a lower FFM percentage exerting a lesser protective effect. Otherwise, if body weight increases through increased FFM percentage (e.g., US men with class II obesity [27]), FM percentage and overall risk decrease, even if BMI increases towards a supposedly higher risk category. In this case, the final mean FMFFMR for this population subcategory becomes lower, describing a non-paradoxical protective area, and locating the Cartesian point for FMFFMR on another square diagonal with a different risk equivalence than that of the overall population in the same BMI range. In other words, for any population subcategory, a higher FFM percentage, within a lower FMFFMR, exerts a higher protective effect than the corresponding to a mean FMFFMR of the overall population despite coinciding with the same high obesity degree (see Fig 1, 2 and 5). As mathematically demonstrated, if a FMFFMR value between underweight and severe obesity corresponds to a different line of risk, then, mean BMI of the overall population can never be equivalent to the mean FMFFMR in terms of risk due to comparing for different risk between individuals. From any BMI-associated historical risk [2-17, 22-31, 29, 36, 38-49, 52, 62, 79, 80, 83, 86], any sex and population subcategory with a BMI of risk increased could have presented a lower causal risk. This fact would happen if any mean FMFFMR were lower than that of the overall population, and then, their (x, y) Cartesian point falling onto another, more protective diagonal, and showing higher FFM percentage over time.
Evidence supports that measuring BMI alone, weight management remains a misleading factor if one omits either the mathematical relationship between FM and FFM after calculating them or the relative abdominal fat volume and central obesity, as measured from the waist-to-height ratio [18, 19, 26, 27, 31-35, 55-60]. In this context, while BMI and indicators of some musculoskeletal component within BMI appeared to be universally associated with mortality risk, accepting a causal risk from mean FMFFMRs of <1 was a false premise. This is because any BMI-associated risk where the mean FMFFMR and |x| were <1 and > 0 (|x| = + x), respectively, may not represent the overall risk as a whole in mathematical terms. Only in situations at extreme lows of BMI would a mean BMI (with a FMFFMR < 1 and |x| > 0: |x| = –x) capture 100% of risk. Similarly, high-risk exposure levels and distinct causality can be observed in severe obesity, where FM exceeding 50% of weight may correspond to the maximum BMI risk category, with FM maintaining risk equivalence with the resulting BMI. Moreover, in anthropometric situations of high BMIs, neither FFM nor other musculoskeletal components (e.g., lean mass or appendicular skeletal muscle masses) necessarily influence the cause-specific mortality, CVD, or cancer risk, as might be suggested by high BMIs in different studies [2-15, 29, 40, 41, 56].
In our framework, it is not possible to accept an “obesity paradox” when describing a U- or J-shaped curve pattern for the association between BMI and all-cause mortality [2-17]. In reality, a linear relationship describing opposite associations for FM and FFM percentages with mortality may highlight different BMI values with a lower causal risk, while describing overlapping protective areas from different square diagonals for FMFFMR. Of course, protective values for FMFFMR were hidden in all BMI associations from statistical models that ignored the mathematical relationships between FM and FFM [18, 19, 33]. To our knowledge, in the overlapping area of the distributions for BMI, all subjects with the same FMFFMR value of <1 would have a similar propensity score and a same anthropometric characteristic for the risk [18, 33]. Nevertheless, on the same area, any risk assigned to a non-equivalent BMI could be spurious, and not necessarily referring to a high-risk body composition. Thus, if risk assignment for BMI in the overlapping area is not conditioned on the true risk variable—such as FMFFMR— with propensity score methods, it will be impossible to ensure a balanced distribution of causal risk between BMI and groups being compared [18, 19, 33].
This research demonstrates that between any mean BMI and a mean FMFFMR of = 1 in either sex, overlapping zones and bias for BMI exist, because of FFM shows a protective overestimate relative to FM. Thus, a higher degree of obesity within these zones can be perfectly protective, and it does not imply a paradoxical effect as suggested in the literature [2-17]. Clearly, this issue need to be better examined, because accepting or dismissing the obesity paradox theory may result in completely different practices on how to “face” obesity in the context of public health. It is well known, BMI does not describe a linear pattern for causal association with mortality, unlike FM and FFM within BMI. In our findings, FFM was always the largest contributor to BMI in any category, excepting women with class III obesity. In underweight category, a reduced FFM was a plausible causative factor in either sex, without an expected increase in visceral fat, abdominal volume or the final FM percentage. In the rest of categories, excess FM was the most plausible causative factor in both sexes, with an expected increase in visceral fat, abdominal volume or the final FM percentage, while decreasing the final FFM percentage. Of course, in subcategories increasing the final FFM percentage a protective effect occurs, while decreasing the unhealthy fat component [18, 19, 26-28, 33, 34, 50].
Since equal–diferent BMI values may coincide with different– equal FMFFMRs falling on different square diagonals, a selection bias for associating BMI and causal risk is inescapable. When using distributions according to BMI and body mass component values in the standard statistical models for the associations, the selected positive or negative risk points from a determined BMI cut-off do not represent tha same causal risk as observed from Cartesian values for the differences between FM and FFM. In the Cartesian plane, all BMIs are arranged on the x-axis, while not all BMI of associated risk can be equivalent in terms of causality with all the corresponding from FMFFMR on the y-axis (see Fig 1, 2 and 5). In most revised studies, some type of standard association between BMI and body composition measures with mortality risk was found, but the baseline anthropometric characteristics from the differences between FM and FFM were always overlooked [2-18, 21-31, 36, 37, 38-49]. Thus, although low FM and low BMI or high FFM and high BMI may be independent predictors of mortality, only individuals with combined low FM/low BMI and high FM/high BMI appear to be at particularly high risk of causal mortality. This may be demonstrated when different FMFFMRs can be linearly arranged on different square diagonals and similar FMFFMR values belonging to different BMI ranges and diagonals. Thereby, it is possible to explain nadir points for BMI in normal weight or overweight/obesity range [2-18, 21-23, 29, 62, 63], while biologically showing a greater health risk from FMFFMR and a defined abdominal volume mediated by a high FM percentage and waist-to-height ratio [18, 19, 32-35, 50, 58, 59, 64, 85, 87]. Likewise, some population subcategories between normoweight and severe obesity, but with a high musculoskeletal component, can be located in Cartesian zones of overlapping, where a better clinical protection can be explained by a higher and lower FFM percentage and FMFFMR, respectively. Thus, the body composition of individuals comprised in those Cartesian areas dismisses the paradoxical effect from BMI in overweight/obesity range (see Fig 5). Our demonstration is compatible with historical findings of associating BMI with all-cause mortality [1-17, 21-31, 29, 36-49, 52, 62, 79, 80, 83, 86, 88]. Historically, both a BMI increase and decrease over time have been associated with a higher mortality risk. However, a variable of continuous values — such as BMI— participating in two metabolically opposite risks is is difficult to accept, at least when the differences between FM and FFM and biological sense of the causal risk are mathematically unaccounted for [18, 19, 33]. Additionally, it is possible to say that only in underweight and morbid obesity in either sex BMI measures the same true risk in all individuals (see Fig 5). Obviously, a reduced FFM and excess FM over time are the causal factors in underweight and in the highest BMI category, respectively. Between both extremes of metabolic risk, BMI can never measure the same causal risk in all individuals, and therefore, from any BMI-associated risk between the lowest and the highest category, causality cannot be globally assumed because BMI becomes an unreliable indicator.
As stated for the first time, different metabolic risk pathways between underweight and beyond severe obesity may exist over time. Thus, the relationships between FMFFMR and BMI may vary over time due to showing different risk equivalence in each Cartesian point, whether belonging to square diagonals of different distances or partial line segments with differentiated “m” slopes. Obviously, a same and unique variation in a FMFFMR value may be risk equivalent with different variations in BMI values. In addition, if each unit of variation for FMFFMR only requires a small variation in BMI to remaining equivalent, this means the total diagonal has a shorter distance. Thus, the point to capture 100% of the risk is reached in a high obesity degree with a lower relative value of BMI (e.g., in women and Asian population as compared with men and Caucasians, respectively). Conversely, a greater distance for the diagonal and an “m” slope <1 lead to an obesity degree, where the theoretical 100% of the risk would be reached beyond class III obesity and with the highest BMI values (e.g., in men who would present a mean FMFFMR of <1 before reaching maximum risk in extreme obesity). On these bases, it is more rigorous to measure a causal risk from the body composition and relationship between FM and FFM than to use any statistically BMI-associated risk, at least after knowing a Cartesian zone of bias for BMI (see Fig 5).
5. Strengths and Limitations
Our research has several strengths. First, we included BMI- and body composition-related anthropometric variables to demonstrate that associations may mathematically suggest spurious risk. Second, we reviewed several study types about body composition with thousands of deaths from a global sample higher than 1 million participants review. Third, this research made use of manually measured weights, heights, and WCs, while incorporating technological methods from the studies to reproduce BMIs, FMs, FFMs, |x| values, FMIs, and FFMIs. This ensured population homogeneity and increased the reliability of our results. Finally, this research revealed mathematical misconceptions, demonstrating that BMI assigns different levels of risk to individuals with similar or differing body shapes and high-risk body compositions as measured from FMFFMR. Furthermore, the findings of this research are innovative and pioneering and have no mathematical limitations, although values and anthropometric measurement biases might remain. Similarly, although anthropometrically and technologically measured body components may vary in their concrete values, this does not affect the underlying mathematical principles developed here. The findings suggest good generalizability to other population studies and are compatible with historical studies on mortality and BMI- associated risk. Mathematically, no further research is needed to demonstrate that BMI appears biased in most studies. This research was a mathematical demonstration, which can be applied to any study that involves BMI-associated risk from any cut-off outside extreme categories.
6. Conclusions
This research mathematically demonstrates a causal association bias occurring in a large sample worldwide when associating BMI and body composition measures with all-cause mortality. From a sample that is anthropometrically consistent with those of repeated historical findings, BMI directly influences mortality from a high- risk body composition defined at the extreme ends of the entire risk spectrum (i.e., a low FM–very high FFM percentage in underweight individuals and a high FFM–very high FM percentage beyond class III obesity). Derived from two metabolically opposite body components—FM and FFM—new mathematically-defined variables demonstrate fundamental BMI-related biases, verifying that the mathematical relationship between FM and FFM components is a confounding factor omitted in most studies. The high-risk body compositions identified from means of BMI and two body mass components differed consistently between categories and within the same category, never representing the same overall risk mathematically, therefore causing confusion in results, and BMI never being reliable indicator enough.
From a Cartesian perspective, all means of BMI between underweight and severe obesity produce causal association biases in terms of impact on all-cause mortality, because in that wide range BMI never captures 100% of the overall risk. Therefore, the true overall risk repeatedly associated with BMI was consistently biased, owing to a protective overestimate of FFM relative to FM.
7. Recommendations
It is time to shift the historical paradigm regarding BMI and health risks. If from underweight to class II obesity (or even beyond) BMI does not measure the same risk in all individuals, then, any overall risk assigned in that range may appear with bias errors. When assessing holistic health by using weight or BMI alone, it is impossible to control for causal risk if FM and FFM are unaccounted for, whether the individual is gaining or losing weight. Since BMI’s association with health risk is inconsistent, in risk assessment, it is therefore essential to measure the two mass components of weight and their ratios, whether by using technology or, more easily, anthropometric prediction equations. Through a linear dose-response based on FM and FFM percentages, body composition drives global risk. Otherwise, population subcategories such as athletes, wellness users or muscular persons would be left out of accurate health control. As a novel tool, if we may modify any “m” slope of the body composition (i.e., that of FMFFMR) from BMI values at the origin up to a final FMFFMR of = 1, we can have a control of causal risk over time, perhaps of the relative longevity.
Conflict of Interest
The author declares no conflict of interest.
Acknowledgments
P. Martín Castellanos contributed to data extraction and provided feedback on the report.


Open Access By Aditum Open Access Journals id licensed under Creative Commons Attribution 4.0 International License. Based On a Work at aditum.org