International Journal of Medical Case Reports and Medical Research
OPEN ACCESS | Volume 5 - Issue 1 - 2026
ISSN No: 2994-6905 | Journal DOI: 10.61148/2994-6905/IJMCRMR


Jiaxuan Gu1,2,4, Tingting Zhao1,2,3, Qiao Wang5, Aili Li6, Penghui Li1,2,3, Saicong Lu1,2, Zhen Wang1,2, Feifei Zhao1,2, Feng Tian1,2,3*
1Hebei Key Laboratory of Medical Data Science, Handan, Hebei Province, 056038, China .
2nstitute of Biomedical Informatics, Hebei University of Engineering, Handan, Hebei Province, 056038, China.
3School of Medicine, Hebei University of Engineering, Handan, Hebei Province, 056038, China.
4School of Information and Electrical Engineering, Hebei University of Engineering, Handan, Hebei Province, 056038, China.
5Hipro Biotechnology CO.,LTD, Shijiazhuang, Hebei Province, 050000, China.
6Department of Gynecology, Handan Central Hospital, Handan, Hebei Province, 056038, China.
*Corresponding author: Feng Tian, Department of Public Health and Community Medicine, Faculty of Medicine, Tadulako University, Palu.
Received: December 20, 2025 | Accepted: January 01, 2026 | Published: January 05, 2026
Citation: Jiaxuan Gu, Tingting Zhao, Qiao Wang, Aili Li, Penghui Li, Saicong Lu, Zhen Wang, Feifei Zhao, Feng Tian., (2026) “A PSO-Enhanced TabNet Model for Predicting Cervical Intraepithelial Neoplasia Risk and Its Clinical Application.” International Journal of Medical Case Reports and Medical Research, 5(1); DOI: 10.61148/2994-6905/IJMCRMR/175.
Copyright: © 2026 Feng Tian. This is an open access article distributed under the Creative Commons Attribution License, which permits unrestricted use, distribution, and reproduction in any medium, provided the original work is properly cited.
Cervical cancer is a global public health problem closely related to women’s health. Cervical intraepithelial neoplasia (CIN) is a precancerous lesion that can progress to cervical cancer. Early detection and treatment are crucial to prevent progression. We proposed a PSO-enhanced TabNet model for CIN risk prediction, addressing class imbalance by combining SMOTE and the Tomek Links algorithm. Using a dataset of 570 patients with six key clinical features, the model demonstrated superior performance across multiple metrics, including accuracy, AUC, and F1 score, particularly improving minority class identification. These results highlight the model’s potential for accurate, robust, and clinically applicable cervical cancer risk assessment. This model can be used for rapid screening of CIN risk, providing significant advantages in guiding personalized treatment strategies.
Cervical cancer; CIN; Tabnet; TomekLinks; SMOTE; Rapid screening
Cervical cancer (CC) is the fourth most common cancer among women worldwide and is a global public health issue closely related to women’s health [1, 2]. According to a World Health Organization (WHO) survey in 2022 on cervical cancer, there were about 660,000 new cases and about 350,000 deaths [3]. The incidence of cervical cancer is increasing among young individuals [4, 5], placing a considerable burden on women’s health and socioeconomic development [6]. The progression from HPV infection to the development of cervical cancer is a prolonged and potentially reversible pathological process [7]. Therefore, early screening for cervical cancer and timely intervention are crucial for reducing both its incidence and mortality [8].
Cervical intraepithelial neoplasia (CIN) is a precancerous condition that occurs before the development of invasive cervical cancer, representing a continuous process in cervical [9]. CIN is classified into three grades: CIN 1, CIN 2, and CIN 3. While the majority of CIN 1 lesions may regress spontaneously, a subset of CIN 2 and CIN 3 lesions carry a risk of progression to invasive cancer [10].
In addition, histopathological biopsy is considered the gold standard for the clinical diagnosis of cervical cancer due to its high accuracy [11]. However, it involves the collection of cervical tissue samples, which carries a risk of secondary injury from infection, is relatively costly, and requires a high level of diagnostic expertise [12]. Therefore, it is not suitable for large-scale population screening [13]. Prior to histopathological biopsy, the use of auxiliary diagnostic tools to predict the risk level of cervical cancer is of critical importance. This approach facilitates the early identification and treatment of high-risk individuals, thereby reducing unnecessary time and financial burdens while improving the accuracy and cost-effectiveness of screening.
In recent years, AI-assisted diagnostic and therapeutic technologies have emerged as a prominent area of research. Extensive studies have applied statistical analysis and artificial intelligence to investigate risk factors and predict the occurrence of various diseases. Leveraging these technologies, researchers have conducted in-depth analyses of disease risk, developed predictive models, explored novel influencing factors, and continuously optimized tools for risk assessment and clinical decision support. Several studies on CC-related ML models based on public datasets have emerged. Yuan Li et al. [14] conducted a large-scale prospective cohort study to develop and validate a prognostic risk prediction model for overall survival in patients with cervical cancer. By integrating clinical characteristics, treatment information, and inflammatory biomarkers, their nomogram demonstrated good discrimination and calibration, with C-index values of 0.769 and 0.779 in the training and validation cohorts, respectively, and showed superior prognostic performance and clinical net benefit compared with the FIGO staging system. Lu Zhen et al. [15] applied unsupervised and supervised machine learning approaches to identify data-driven clinical subgroups for cervical cancer prevention using large-scale population-based electronic health records. They identified five distinct phenotypic subgroups with significantly different risks of CIN2+, CIN3+, and cervical cancer, and demonstrated that the proposed subgroup-based prevention strategy achieved robust external and diagnostic validation, enabling risk-stratified screening and targeted prevention beyond conventional guideline-based approaches. Mavra Mehmood et al. [16] proposed a method called “CervDetect”, which is based on four target parameters (biopsy, cytology, Schiller, and Hinselmann) and 32 risk factors collected from the UCI cervical cancer dataset. The method uses the Random Forest algorithm to select important feature variables, followed by a shallow neural network to predict cervical cancer. Ruan Yuxin et al. [17] developed a machine learning–based nomogram using U.S. NHIS data to predict cervical cancer risk, achieving good discrimination and calibration (AUC = 0.82) and demonstrating clinical utility for risk assessment and prevention. Karimi S et al. [18] applied the SMOTE method to oversample the imbalanced UCI cervical cancer dataset and used data mining techniques, including Boosted Decision Tree, Decision Forest, and Decision Jungle, to predict cervical cancer. Among various screening methods, the Boosted Decision Tree showed the best performance under the Hinselmann screening method, achieving an AUC of 0.978, which was significantly superior to the other classifiers.
Therefore, we conducted a retrospective cohort study based on real-world clinical data from hospitals and developed a predictive model for the early diagnosis of cervical cancer using routine physical examination indicators. This study aims to identify key risk factors associated with the development of CIN and provide a novel approach for early screening in high-risk populations. The findings not only offer theoretical support for effective cervical cancer prevention but also hold significant clinical application value. Additionally, by integrating clinical data from both affected and healthy individuals, we applied oversampling and undersampling techniques to balance the dataset and employed Tabnet to construct a predictive model. This model serves as a valuable reference for the prevention and management of cervical cancer in high-risk populations.
Methods
2.1 Study subjects
The study included women who underwent cervical biopsy at a hospital in Jiangsu Province from 2018 to 2022. All data were anonymized, ensuring that no patient-identifiable information was used. The dataset primarily comprised age, TCT, HPV, multiple infection, FRD, cotton-tipped swab, and cervical pathological tissue biopsy results. Of these variables, the cervical biopsy results served as the outcome measure. Ultimately, 570 participants were included from an initial cohort of 597, based on the following inclusion criteria: (1) women aged between 18 and 100 years; (2) completion of cervical pathological tissue biopsy with reliable results.
2.2 Data preprocessing
The original dataset may contain missing values, outliers, or imbalanced sampling, which necessitates data preprocessing to ensure high-quality and reliable input for subsequent analyses. The analysis process was shown in Figure 1. First, samples with missing outcome variables were excluded. Next, samples with more than 30% missing data were removed. After data preprocessing, categorical features were converted into numerical values using label encoding to enable processing and interpretation by machine learning models. Label encoding creates a mapping that assigns a unique integer to each distinct categorical label. To enable machine learning models to process and interpret categorical features, non-numeric categorical labels were converted into numerical values using label encoding. TCT results were interpreted following the TBS cervical cytology classification [19]. Results were categorized as negative for intraepithelial lesions or malignancy (NILM), abnormal results include atypical cytology of undetermined significance (ASC-US), low-grade squamous intraepithelial lesion (LSIL), atypical squamous cells-high grade (ASC-H), high-grade squamous intraepithelial lesion (HSIL) [20]. HPV genotypes were categorized according to their oncogenic potential for cervical cancer [21], including negative, high-risk HPV (HR-HPV) types (HPV 16, 18, 31, 33, 35, 39, 45, 51, 52, 58, 59, 66, and 68), and low-risk HPV (LR-HPV) types (any positive genotypes not classified as HR-HPV) [22]. Multiple infection results were categorized as negative, single infection (infection with a single HPV genotype), and multiple infection (infection with two or more HPV genotypes) [23]. FRD was categorized into two groups: no lesions (the swabs were brown, green or colourless), with intraepithelial neoplasia (the swabs were dark green, black or blue) [24]. The results of cotton-tipped swab test were categorized as negative, suspicious and positive. Based on cervical pathological tissue biopsy results, CIN 2 and CIN 3, as well as cervical cancer (CC), were collectively classified as CIN 2 or higher (CIN 2+), whereas CIN 1 was categorized as CIN 2 or lower (CIN 2−) [25]. Finally, missing values in the dataset were imputed using the Multiple Imputation by Chained Equations (MICE) method. This approach constructs multiple regression models to predict and replace missing values based on information from other variables, thereby maximizing data completeness and preserving statistical properties, while avoiding information loss or bias that could result from simply removing incomplete cases.
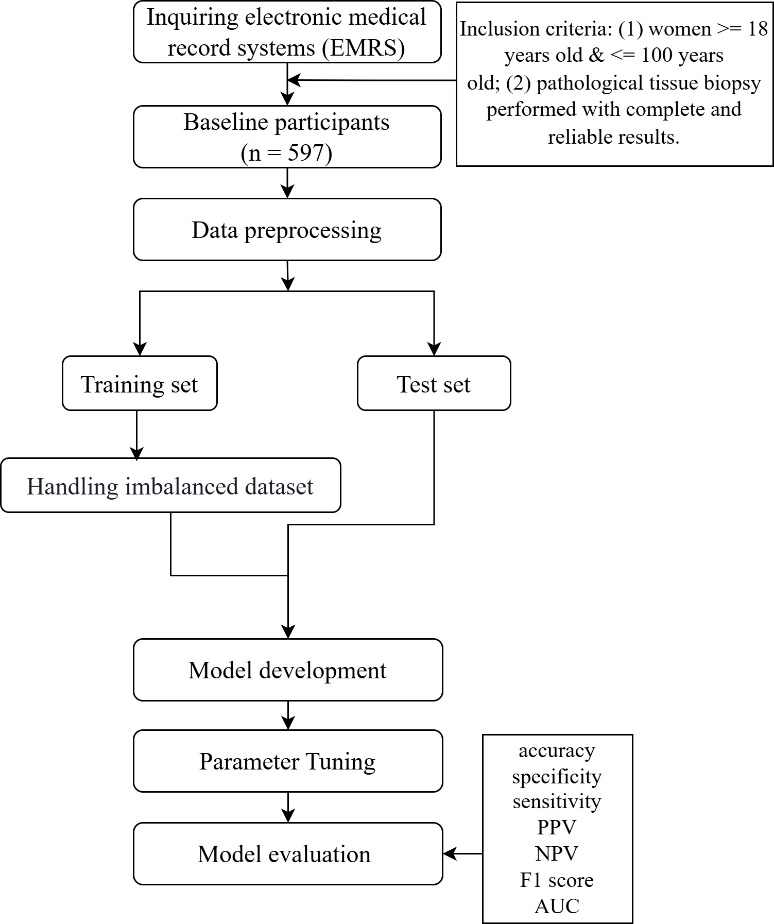
Figure 1. Analysis process of this study. PPV, positive predictive value; NPV, negative predictive value; AUC, area under the receiver operating characteristic curve.
The dataset was split into a training set and a test set in an 8:2 ratio. All subsequent sampling algorithms for handling the imbalanced dataset were applied only to the training set.
2.3 Handling Imbalanced Datasets
Imbalanced datasets represent a common challenge in machine learning and artificial intelligence. When one class significantly outnumbers the other, models tend to be biased toward the majority class, resulting in suboptimal performance. Sampling algorithms, as data-level solutions, address this issue by employing oversampling or undersampling techniques to achieve a more balanced distribution between positive and negative samples.
Oversampling is a technique that randomly duplicates a portion of samples from the minority class and adds them to the training dataset. This increases the number of minority class samples to a level comparable to that of the majority class, thereby reducing class imbalance. Synthetic Minority Over-sampling Technique (SMOTE) is an oversampling-based method for handling imbalanced data. It addresses the class imbalance by generating synthetic samples to bridge the gap between the minority and majority classes. The specific procedure of SMOTE is as follows:
1. For any minority class sample


2. The sampling ratio

3. For each randomly selected neighbor
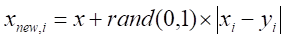
Here, 
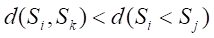
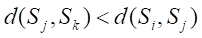
Undersampling techniques reduce the number of majority class samples to make the class distribution in the dataset more balanced, thereby improving the model’s focus on the minority class and its classification performance. TomekLinks is a commonly used undersampling method that belongs to data cleaning techniques. Its main purpose is to improve the classification boundary by removing overlapping samples between classes. By definition, if a majority class sample and a minority class sample are each other’s nearest neighbors, they form a TomekLinks pair. Once two samples constitute a TomekLinks pair, it means that either one of the samples is noise, or both samples lie on the decision boundary. Its basic idea is: given a pair of samples 


2.4 Model development and evaluation
In this study, TabNet was selected as the baseline model for structured data classification tasks. TabNet is a deep neural network architecture specifically designed for tabular data [26]. Compared with conventional deep learning models, TabNet not only possesses strong modeling capabilities but also retains a degree of interpretability similar to decision tree models, allowing for intuitive visualization of each feature’s contribution to the model’s predictions. To further enhance TabNet’s performance on structured data classification tasks, we employed Particle Swarm Optimization (PSO) for automated hyperparameter tuning. By integrating TabNet with PSO, the model can effectively handle complex tabular data while achieving superior classification performance without compromising interpretability.
To evaluate the performance of the prediction model, we used metrics including accuracy, sensitivity, specificity, positive predictive value (PPV), negative predictive value (NPV), F1 score, kappa, and AUC. By comparing the best models obtained from different algorithms in terms of discrimination and calibration performance, we ultimately identified the most suitable model for the target population.
2.5 Statistical analysis
In this study, continuous variables were represented using mean (standard deviation), while categorical variables were presented using counts (percentages). For each variable, t-tests or Mann-Whitney tests were used for continuous variables, and chi-square tests or Fisher’s exact tests were used for categorical variables. All statistical analyses were performed on R software (version 4.4.3). Two-tailed p-values less than 0.05 were considered statistically significant.
Results
3.1 Clinical characteristics of the participants
Among the 570 subjects included, 268 (47.02%) were classified as CIN 2+ and 302 (52.98%) as CIN 2-. Baseline characteristics were presented in Table 1. The study population was split into a training set (n = 513) and a test set (n = 57). Statistically significant differences between the two groups were found for TCT, HPV, multiple infections, FRD, and cotton-tipped swab results (p < 0.05) (Table 2).
Table 1 Baseline characteristics of the participants
|
Characteristics |
Total |
CIN 2- |
CIN 2+ |
P value |
|
Age (median) |
23-70 (43) |
23-70 (44) |
26-70 (42) |
0.012 |
|
TCT |
|
|
|
<0.001 |
|
NILM |
30.0% |
38.1% |
20.9% |
|
|
ASC-US |
33.7% |
38.7% |
28.0% |
|
|
LSIL |
5.1% |
1.0% |
9.7% |
|
|
ASC-H |
14.39% |
15.9% |
12.7% |
|
|
HSIL |
8.95% |
0.7% |
18.3% |
|
|
HPV |
|
|
|
<0.001 |
|
Negative |
4.6% |
7.0% |
1.9% |
|
|
LR-HPV |
3.9% |
6.3% |
1.1% |
|
|
HR-HPV |
78.1% |
75.4% |
81.0% |
|
|
Multiple infection |
|
|
|
0.021 |
|
Negative |
4.56% |
7.0% |
1.9% |
|
|
Single infection |
58.1% |
159.3% |
56.7% |
|
|
Multiple infection |
23.9% |
22.5% |
25.4% |
|
|
FRD |
|
|
|
<0.001 |
|
No abnormal cervical lesions |
42.1% |
53.0% |
29.9% |
|
|
Abnormal cervical lesions |
57.9% |
47.0% |
70.1% |
|
|
Cotton-tipped swab |
|
|
|
<0.001 |
|
Negative |
29.6% |
44.0% |
13.4% |
|
|
Suspicious |
62.1% |
52.0% |
73.5% |
|
|
Positive |
8.2% |
4.0% |
13.1% |
|
TCT (ThinPrep cytological test), HPV (human papillomavirus), FRD (folate receptor-mediated tumor detection), Multiple infection (the result of determining how many HPV genotypes (one or multiple) the patient is infected with), Cotton-tipped swab (the assessment result of the cotton-tipped swab). Continuous variables are described using the median, while categorical variables were described in terms of frequency (percentage).
Table 2 Characteristics of the training and test cohorts
|
Characteristics |
Training cohort |
Test cohort |
P value |
|
Age (median) |
23-70 (43) |
26-67 (47) |
0.183 |
|
TCT |
|
|
<0.001 |
|
NILM |
31.0% |
21.1% |
|
|
ASC-US |
33.5% |
35.1% |
|
|
LSIL |
5.1% |
5.3% |
|
|
ASC-H |
14.6% |
12.3% |
|
|
HSIL |
8.4% |
14.0% |
|
|
HPV |
|
|
<0.001 |
|
Negative |
3.9% |
10.5% |
|
|
LR-HPV |
3.5% |
0.7% |
|
|
HR-HPV |
78.8% |
71.9% |
|
|
Multiple infection |
|
|
0.011 |
|
Negative |
3.9% |
10.5% |
|
|
Single infection |
58.3% |
56.1% |
|
|
Multiple infection |
24.0% |
22.8% |
|
|
FRD |
|
|
<0.001 |
|
No abnormal cervical lesions |
42.5% |
38.6% |
|
|
Abnormal cervical lesions |
57.5% |
61.4% |
|
|
Cotton-tipped swab |
|
|
<0.001 |
|
Negative |
30.4% |
22.8% |
|
|
Suspicious |
61.6% |
66.7% |
|
|
Positive |
8.0% |
10.5% |
|
TCT (ThinPrep cytological test), HPV (human papillomavirus), FRD (folate receptor-mediated tumor detection), Multiple infection (the result of determining how many HPV genotypes (one or multiple) the patient is infected with), Cotton-tipped swab (the assessment result of the cotton-tipped swab). Continuous variables are described using the median, while categorical variables were described in terms of frequency (percentage).
Univariate logistic regression analysis revealed that all variables were significant (p < 0.05). Those variables were then entered into a multivariate logistic regression model, which identified age, TCT, HPV, multiple infections, and cotton-tipped swab as independent predictors of CIN 2+ (Table 3).
Table 3 Univariate and multivariate logistic regression analysis
|
Characteristics |
Univariate logistic regression analysis |
Multivariate logistic regression analysis |
||||||
|
β |
Odds ratio |
95%CI |
P value |
β |
Odds ratio |
95%CI |
P value |
|
|
Age |
-0.021 |
0.980 |
(-0.036 - -0.005) |
0.016 |
-0.027 |
0.973 |
(-0.046 - -0.009) |
0.004 |
|
TCT |
0.506 |
1.659 |
(0.368 - 0.656) |
<0.001 |
0.483 |
1.621 |
(0.332 - 0.640) |
<0.001 |
|
HPV |
0.836 |
2.308 |
(0.422 - 1.310) |
<0.001 |
0.908 |
2.480 |
(0.390 - 1.471) |
<0.001 |
|
Multiple infection |
0.404 |
1.498 |
(0.082 - 0.731) |
0.014 |
0.054 |
1.055 |
(-0.368 - 0.476) |
0.080 |
|
FRD |
0.974 |
2.648 |
(0.631 - 1.323) |
<0.001 |
-0.286 |
0.755 |
(-0.816 - 0.244) |
0.297 |
|
Cotton-tipped swab |
1.342 |
3.826 |
(1.009 - 1.693) |
<0.001 |
1.381 |
3.981 |
(0.896 - 1.885) |
<0.001 |
TCT (ThinPrep cytological test), HPV (human papillomavirus), FRD (folate receptor-mediated tumor detection), Multiple infection (the result of determining how many HPV genotypes (one or multiple) the patient is infected with), Cotton-tipped swab (the assessment result of the cotton-tipped swab).
3.2 Model development and evaluation
In this study, we compared the binary classification performance of six different data processing methods combined with the TabNet model, including: the original TabNet, SMOTE+TabNet, RandomOverSampler+TabNet, TomekLinks+TabNet, TomekLinks+SMOTE+TabNet, and SMOTE+TomekLinks+TabNet (Table 1). The results demonstrated that the SMOTE+TomekLinks+TabNet model achieved the best overall performance, with an AUC of 0.780, an accuracy of 0.737, and a well‑balanced sensitivity (0.722) and specificity (0.750). Its F1‑score was 0.722, indicating stable performance in identifying both positive and negative samples.
In contrast, the TomekLinks+SMOTE+TabNet model exhibited high sensitivity (0.870) but low specificity (0.583), suggesting a strong ability to identify positive samples while producing a considerable number of false positives. The original TabNet model achieved the highest specificity (0.783), but its sensitivity was only 0.667, implying a risk of missed diagnoses. The other methods (SMOTE+TabNet, RandomOverSampler+TabNet, TomekLinks+TabNet) performed slightly worse than SMOTE+TomekLinks+TabNet in overall metrics.
The ROC curves for both the training and testing sets (Figure 2) further validated these findings. The SMOTE+TomekLinks+TabNet model maintained a high area under the curve (AUC = 0.780) on the testing set, with the curve positioned close to the upper-left corner. This indicates that the model consistently delivered strong classification performance across varying threshold values. Overall, in handling class‑imbalanced data, the SMOTE+TomekLinks+TabNet model demonstrated a balanced trade‑off between sensitivity and specificity, representing the most stable and robust approach in this study.
Table 4 The performance of model
|
Method |
AUC |
Accuracy |
Sensitivity |
Specificity |
PPV |
NPV |
F1 score |
|
Tabnet |
0.779 |
0.728 |
0.667 |
0.783 |
0.735 |
0.723 |
0.699 |
|
SMOTE+Tabnet |
0.775 |
0.733 |
0.833 |
0.633 |
0.672 |
0.809 |
0.744 |
|
RandomOverSampler+Tabnet |
0.743 |
0.706 |
0.778 |
0.634 |
0.656 |
0.760 |
0.712 |
|
TomekLinks+Tabnet |
0.742 |
0.704 |
0.741 |
0.667 |
0.667 |
0.741 |
0.702 |
|
TomekLinks+SMOTE+Tabnet |
0.751 |
0.727 |
0.870 |
0.583 |
0.653 |
0.833 |
0.746 |
|
SMOTE+TomekLinks+Tabnet |
0.780 |
0.737 |
0.722 |
0.750 |
0.722 |
0.750 |
0.722 |
PPV, positive predictive value; NPV, negative predictive value.
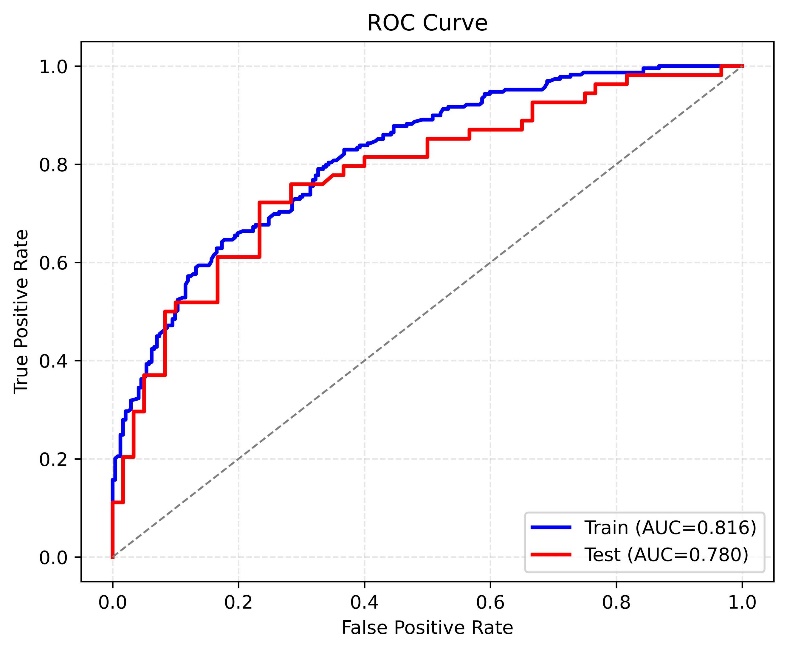
Figure 2. ROC curve.
Discussion
With the continuous accumulation of medical data, AI is widely used in the medical field [27]. The development of disease classification prediction models is increasingly becoming a focal point and trend [28]. Cervical cancer is one of the most common malignant tumors of the female reproductive system and ranks second only to breast cancer among malignant tumors in women worldwide [29]. Studies have shown that although the mortality rate of cervical cancer has been significantly reduced through HPV vaccination, early screening, and surgical treatment, both its incidence and mortality rates remain high. In recent years, there has also been a trend toward younger onset, posing a serious threat to women’s health and quality of life [2]. In many countries and regions with weak health systems, cervical cancer continues to maintain high incidence and mortality rates [30]. Although several risk prediction models for cervical cancer exist, most research focuses on Demographic sociological characteristics.
Compared with traditional studies, this research benefits from systematically selected samples from a large-scale health examination database with clear inclusion and exclusion criteria, ensuring data quality and population representativeness. The use of high-quality, structured clinical data provides a robust foundation for model training and validation, overcoming limitations of small sample sizes and unstandardized data in previous studies. The dataset used in this study comprised 268 patients with CIN 2+ and 302 CIN 2- individuals. Six feature variables were identified as key factors influencing cervical intraepithelial neoplasia (CIN) and were used as input features for the TabNet model. Based on clinical data from 570 cases, this study developed and validated a particle swarm optimization (PSO)-enhanced TabNet model for the accurate prediction of CIN risk. Given the significant class imbalance in the original dataset, we applied both oversampling and undersampling strategies to perform data resampling, aiming to enhance the model’s ability to learn from minority class instances. Based on this, we combined each resampling method with Tabnet to construct multiple predictive models. This approach is designed to improve the model’s capacity to accurately identify all classes, mitigate prediction bias caused by data imbalance, and ultimately achieve more robust and reliable classification performance. We conducted a comprehensive evaluation of model performance using multiple metrics, including accuracy, sensitivity, specificity, positive predictive value (PPV), negative predictive value (NPV), F1 score, Cohen’s kappa, and the area under the receiver operating characteristic curve (AUC). A comparison of the performance of the different models across these metrics unequivocally demonstrated the effectiveness of the hybrid approach combining SMOTE and TomekLinks algorithm within the TabNet framework. This hybrid approach not only achieved superior overall predictive accuracy but also significantly improved the identification of minority class samples. Consequently, it enhanced the robustness and practical applicability of the model, making it particularly suitable for classification tasks involving imbalanced datasets.
However, several potential limitations should be acknowledged in this study. First, although more than 500 participants were included, the representativeness of the study population may be limited compared with that of large-scale multicenter clinical studies. Second, the collection of clinical data is inherently challenging, which resulted in a relatively limited sample size. Third, this study employed a cross-sectional design, which may limit the generalizability of the findings. Future studies should focus on multicenter collaborations to collect larger and more diverse clinical datasets, encompassing broader age ranges, ethnicities, and disease conditions. Longitudinal follow-up is also needed to monitor disease progression, treatment response, and outcomes, thereby enhancing the robustness and generalizability of the predictive model.
Conclusions
This study addressed the issue of class imbalance in clinical medical datasets by proposing a cervical cancer prediction model that integrates data sampling techniques with Tabnet. The model first employs SMOTE followed by the TomekLinks algorithm to balance the dataset, and uses TabNet as the base classifier. Furthermore, Particle Swarm Optimization (PSO) was employed to optimize the hyperparameters of TabNet, enhancing the model's predictive performance. Model performance was evaluated using multiple metrics, including AUC, accuracy, sensitivity, specificity, positive predictive value (PPV), negative predictive value (NPV), and F1 score. Compared with the traditional SMOTE-based oversampling combined with ANN, the proposed model demonstrated superior performance, significantly improving the accuracy of minority class identification. It also achieved higher accuracy and AUC, making it highly valuable for assessing individual disease risk.
In future clinical practice, on one hand, the model requires more data for external validation to further improve its predictive performance. On the other hand, further optimization is needed for aspects such as feature engineering, model training, hyperparameter optimization, and interpretability analysis, based on the requirements of real-world application scenarios.
Acknowledgment
We are deeply grateful to all of those who helped us throughout the research process.
Author Contributions
Concept and design: FT, JG, TZ. Acquisition, analysis, or interpretation of data: All authors. Drafting of the manuscript: JG, TZ. Data collection: QW. Critical revision of the manuscript for important intellectual content: All authors. Statistical analysis: JG, PL, AL, SL. Administrative, technical, or material support: FT, TZ. Supervision: FT, ZW, FZ. All authors contributed to the article and approved the submitted version.
Availability of Data and Materials
The data that support the findings of this study are available from the Corresponding Author, FengTian, upon reasonable request.
Funding
This research was funded by Hebei Province Major Science and Technology Support Project (242W7712Z).
Ethics Approval
This study was approved by the Biomedical Ethics Committee of School of Medicine, Hebei University of Engineering (no. BER-YXY-2024044). The study was conducted in accordance with the Declaration of Helsinki. The personal information of each participant was anonymized and deidentified at collection prior to analysis. The informed consent was not required for the study in accordance with the local legislation and institutional requirements.
Conflict of Interests
The authors declare that they have no competing interests.


Open Access By Aditum Open Access Journals id licensed under Creative Commons Attribution 4.0 International License. Based On a Work at aditum.org