Environmental Pollution and Health
OPEN ACCESS | Volume 3 - Issue 1 - 2026
ISSN No: 3065-7652 | Journal DOI: 10.61148/3065-7652/EPH

Niyati Wadhawan1, Saptarshi Das2*
1Dhirubhai Ambani International School, Bandra East, Mumbai Maharashtra, India-400098.
2KPMG, Vikhroli, Mumbai, Maharashtra, India-400079.
*Corresponding Author: Saptarshi Das, KPMG, Vikhroli, Mumbai, Maharashtra, India-400079.
Received: July 15, 2024
Accepted: August 05, 2024
Published: September 05, 2024
Citation: Niyati Wadhawan, Saptarshi Das (2024). “Assessment of Ambient Air Quality Index and Strategic Implementation of Sector-Specific Mitigation Measures in Maharashtra- A Case Study.”. Environmental Pollution and Health, 2(1); DOI: 10.61148/EPH/007.
Copyright: © 2024 Saptarshi Das. This is an open access article distributed under the Creative Commons Attribution License, which permits unrestricted use, distribution, and reproduction in any medium, provided the original work is properly cited.
Air pollution poses significant challenges globally, particularly in urban areas, with dire implications for public health and environmental well-being. Maharashtra, one of India's most industrialized and urbanized states, exemplifies these challenges, grappling with the detrimental effects of air pollution on its population and ecosystems. This paper examines air quality dynamics in Maharashtra and proposes evidence-based interventions. Utilizing data from international organizations and local sources, a mixed-methods approach is employed, combining quantitative analysis with qualitative assessments. Results indicate a notable increase in the average Air Quality Index (AQI) from 2017 to 2023, with varying trends across regions. The study highlights the importance of city-specific action plans tailored to address top-contributing pollutants and sector-specific mitigation measures. Limitations include the focus on single pollutants and the absence of consideration for cumulative effects. Despite challenges, collaborative efforts among stakeholders are crucial for achieving sustainable improvements in air quality in Maharashtra.
1. Background and introduction:
Air, an indispensable element for sustaining life, is intricately linked to human survival, alongside water and land. However, the pervasive issue of air pollution poses significant challenges globally, particularly in urban areas, with dire implications for public health and environmental well-being. Nowhere is this challenge more acute than in India, where rapid development and urbanization have fuelled substantial air pollution concerns. Maharashtra, as one of India's most industrialized and urbanized states, epitomizes these challenges, grappling with the detrimental effects of air pollution on its burgeoning population and fragile ecosystems.
With a population exceeding 120 million, Maharashtra ranks among India's most populous states, accounting for a significant portion of the country's urban residents. The state's economic growth trajectory, driven by sectors such as manufacturing, services, and agriculture, has propelled rapid urbanization, leading to sprawling urban centres and burgeoning industrial complexes. Mumbai, the state's capital and financial hub, stands as a testament to Maharashtra's urban dynamism, attracting migrants and businesses alike, while also grappling with the adverse consequences of industrial emissions, vehicular traffic, and urban sprawl.
In recent years, incidents of severe air pollution have garnered widespread attention in Maharashtra, particularly in urban centres like Mumbai. The city's hazardous air quality levels, exacerbated by factors such as vehicular emissions, industrial activities, and unfavourable weather conditions, underscore the urgent need for concerted action to address air pollution. These incidents serve as stark reminders of the interconnectedness of environmental and public health challenges, demanding comprehensive mitigation efforts and evidence-based policy interventions.
Beyond India's borders, numerous cities worldwide grapple with similar air pollution challenges, underscoring the global nature of the problem. From Beijing's frequent smog episodes to Los Angeles' historical struggle with vehicular emissions, urban centres worldwide face the daunting task of balancing economic development with environmental sustainability. These global examples underscore the imperative for collaborative, evidence-based approaches to combatting air pollution and safeguarding public health and environmental integrity.
This paper endeavours to provide insights into the dynamics of air quality in Maharashtra, India, and propose evidence-based interventions to mitigate pollution levels. By drawing upon data from international organizations such as the Intergovernmental Panel on Climate Change (IPCC), the United Nations Environment Programme (UNEP), and other reports, alongside local sources such as the Maharashtra State Pollution Control Board (MPCB), the study seeks to analyse trends, identify key sources of pollution, and recommend targeted interventions to address the state's air quality challenges. Through a comprehensive examination of the issues at hand and evidence-based policy recommendations, this research aims to contribute to the ongoing efforts to combat air pollution in Maharashtra and beyond.
Previous studies have underscored the correlation between economic growth, urbanization, and deteriorating air quality in developing nations like India (Jafari et al., 2021). Mitigation strategies such as promoting cleaner transportation technologies, implementing emission standards for industries, and enhancing green infrastructure have been suggested to address these challenges (Kumar et al., 2019). However, more localized studies can help in contextualised approach towards climate and environmental policies and government programs.
2. Methodology:
The Maharashtra Pollution Control Board had deployed 23 air quality monitoring stations (refer annexure) strategically placed across different regions. These stations generate a substantial amount of air quality data, which is utilized to evaluate the air quality status of various areas in Maharashtra. Six key pollutants are monitored, namely particulate matter (PM10 and PM2.5), sulphur dioxide (SO2), nitrogen dioxide (NO2), ozone (O3), carbon monoxide (CO), ammonia (NH3). The methodology employed in this study utilizes ambient air quality monitoring to assess the air quality status at stations located across the state during the period 2017 - 2023.
In India, primary air quality indexing system currently in use to depict the quality of air in different regions of the country has been developed by the Indian Institute of Technology (IIT) Kanpur and adopted by the Central Pollution Control Board (CPCB) in 2014. The indexing system utilize the US Environmental Protection Agency (EPA) formula, which calculates the overall Air Quality Index based on the individual pollutant concentrations through segmented linear interpolation between breakpoint values (MPCB 2019).
For this study, a mixed-methods approach is utilized, combining quantitative analysis of air quality data provided by the Maharashtra State Pollution Control Board (MPCB) with qualitative assessment of mitigation interventions through focused interviews with concerned stakeholders. The dataset spans from 2017 to 2023, with a specific focus on pre- and post-COVID periods to account for potential lockdown-related variations (Naqvi et. al 2021; Dubey and Rasool 2023). Trend analysis has been conducted to examine year-on-year progress in Air Quality Index (AQI) at both state and regional levels. Additionally, city-wise and month-wise aggregates has been analysed to discern spatial and seasonal variations in air quality, providing comprehensive insights into the dynamics of air pollution in Maharashtra.
3. Results and Discussion:
Results of the study:
Preliminary analysis of the dataset reveals significant trends in AQI across Maharashtra, with variations observed both geographically and seasonally by conducting cluster-based analysis for western, central, and eastern part of Maharashtra.

*Note: Highest value is coded as red and lowest value as green and other color spectrum populated based on median value.
Table 1: Year-wise average AQI at state level and city level
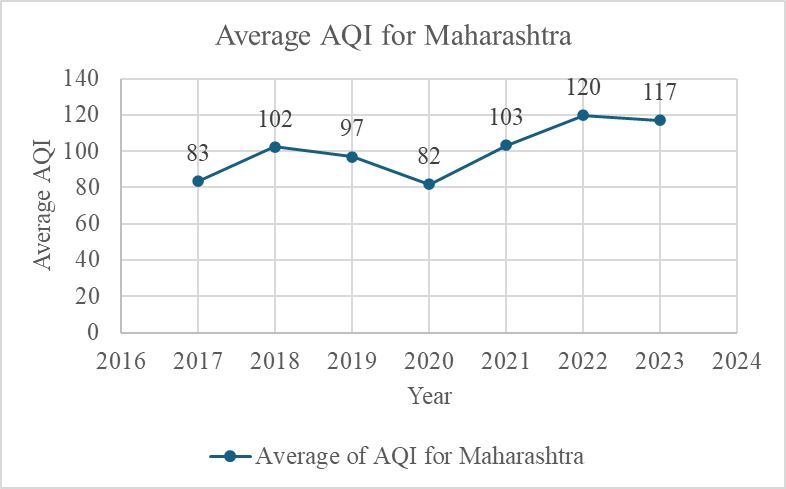
Figure 1: Year wise average AQI for Maharashtra

Figure 2: Year wise average AQI for Maharashtra – Western Part

Figure 3: Year-wise average AQI for Maharashtra – Central Part

Figure 4: Year-wise average AQI for Maharashtra – Eastern Part
Table 1 and Figures 1 to 4 present the average Air Quality Index (AQI) calculated by averaging the AQI recorded at each station daily for each year. At the state level (Maharashtra), there is a noticeable increase in the average AQI from 83 in 2017 to 117 in 2023, with a dip to 82 in 2020 due to COVID-19 related lockdown measures. Upon comparing the average AQI across cities, it is evident that cities in the central part of Maharashtra, such as Nashik and Pune, consistently exhibit better performance compared to others. Aurangabad and Solapur also demonstrate relatively good performance across the years, with average AQI levels remaining similar to those in 2017. Conversely, cities in the eastern part of Maharashtra, such as Nagpur and Chandrapur, experience a consistent increase in average AQI levels, except for a decline during the COVID-19 period. In western part cities like Mumbai, Navi Mumbai, Thane, Kalyan, and Vasai, there is no specific pattern observed, although Kalyan and Navi Mumbai consistently display higher average AQI levels compared to Mumbai, Thane, and Vasai.
Table 2 displays the month-wise average AQI for Maharashtra, revealing a notable decrease in average AQI during the monsoon season (June to September). This trend is consistent across the region and is further confirmed in Tables 3 to 5, which analyse month-wise average AQI for cities such as Mumbai (western part), Aurangabad (central part), and Nagpur (eastern part). The data illustrates a similar pattern of sudden decreases in average AQI during the monsoon season. This phenomenon underscores the role of precipitation in washing out pollutants during the monsoon, while during the winter, pollutants tend to accumulate due to thermal inversion, contributing to poor air quality.
|
Month-wise Average AQIs - Maharashtra |
||||||||||||
|
Year |
Jan |
Feb |
Mar |
Apr |
May |
Jun |
Jul |
Aug |
Sep |
Oct |
Nov |
Dec |
|
2017 |
111 |
104 |
114 |
105 |
81 |
56 |
51 |
48 |
53 |
77 |
104 |
101 |
|
2018 |
122 |
119 |
120 |
99 |
94 |
66 |
56 |
58 |
73 |
120 |
136 |
139 |
|
2019 |
161 |
138 |
128 |
105 |
95 |
64 |
54 |
58 |
51 |
77 |
107 |
120 |
|
2020 |
119 |
127 |
96 |
67 |
58 |
43 |
39 |
41 |
59 |
83 |
112 |
123 |
|
2021 |
139 |
125 |
126 |
99 |
82 |
67 |
58 |
64 |
59 |
95 |
121 |
179 |
|
2022 |
150 |
143 |
149 |
118 |
115 |
76 |
67 |
71 |
74 |
110 |
171 |
181 |
|
2023 |
180 |
165 |
141 |
114 |
95 |
100 |
76 |
65 |
71 |
133 |
141 |
123 |
Table 2: Month-wise average AQI for Maharashtra
*Note: Highest value is coded as red and lowest value as green and other colour spectrum populated based on median value.
|
Month-wise Average AQI - Mumbai |
||||||||||||
|
Year |
Jan |
Feb |
Mar |
Apr |
May |
Jun |
Jul |
Aug |
Sep |
Oct |
Nov |
Dec |
|
2017 |
166 |
158 |
124 |
100 |
69 |
64 |
78 |
61 |
72 |
100 |
135 |
144 |
|
2018 |
104 |
78 |
59 |
65 |
73 |
71 |
67 |
61 |
77 |
127 |
146 |
148 |
|
2019 |
183 |
150 |
130 |
102 |
91 |
64 |
57 |
53 |
47 |
79 |
110 |
130 |
|
2020 |
130 |
139 |
99 |
66 |
54 |
44 |
41 |
41 |
64 |
89 |
120 |
126 |
|
2021 |
150 |
128 |
141 |
108 |
92 |
72 |
68 |
77 |
77 |
98 |
129 |
198 |
|
2022 |
177 |
167 |
160 |
116 |
115 |
73 |
67 |
68 |
76 |
116 |
173 |
193 |
|
2023 |
189 |
171 |
149 |
114 |
94 |
100 |
75 |
65 |
76 |
147 |
133 |
120 |
Table 3: Month-wise average AQI for Mumbai
*Note: Highest value is coded as red and lowest value as green and other colour spectrum populated based on median value.
|
Month-wise Average AQI - Aurangabad |
||||||||||||
|
Year |
Jan |
Feb |
Mar |
Apr |
May |
Jun |
Jul |
Aug |
Sep |
Oct |
Nov |
Dec |
|
2017 |
139 |
123 |
117 |
114 |
96 |
59 |
51 |
43 |
45 |
80 |
112 |
116 |
|
2018 |
128 |
122 |
122 |
106 |
104 |
63 |
48 |
52 |
61 |
88 |
106 |
82 |
|
2019 |
73 |
74 |
93 |
87 |
81 |
80 |
54 |
65 |
63 |
63 |
77 |
87 |
|
2020 |
102 |
76 |
74 |
52 |
52 |
53 |
38 |
40 |
49 |
66 |
89 |
96 |
|
2021 |
91 |
78 |
85 |
79 |
60 |
56 |
38 |
51 |
56 |
80 |
83 |
111 |
|
2022 |
108 |
108 |
90 |
107 |
144 |
107 |
48 |
66 |
88 |
114 |
112 |
120 |
|
2023 |
144 |
129 |
106 |
86 |
80 |
69 |
55 |
59 |
74 |
93 |
131 |
114 |
Table 4: Month-wise average AQI for Aurangabad
*Note: Highest value is coded as red and lowest value as green and other colour spectrum populated based on median value.
|
Month wise Average AQI - Nagpur |
||||||||||||
|
Year |
Jan |
Feb |
Mar |
Apr |
May |
Jun |
Jul |
Aug |
Sep |
Oct |
Nov |
Dec |
|
2017 |
87 |
92 |
114 |
105 |
96 |
54 |
58 |
51 |
48 |
68 |
85 |
80 |
|
2018 |
113 |
102 |
107 |
73 |
90 |
62 |
45 |
54 |
60 |
97 |
115 |
118 |
|
2019 |
116 |
133 |
112 |
121 |
169 |
55 |
45 |
37 |
48 |
62 |
107 |
96 |
|
2020 |
84 |
74 |
66 |
60 |
63 |
49 |
50 |
70 |
75 |
103 |
97 |
108 |
|
2021 |
112 |
81 |
90 |
102 |
60 |
65 |
76 |
64 |
55 |
116 |
111 |
123 |
|
2022 |
104 |
102 |
115 |
133 |
136 |
82 |
39 |
54 |
61 |
100 |
198 |
223 |
|
2023 |
202 |
130 |
123 |
93 |
81 |
67 |
38 |
59 |
52 |
125 |
210 |
151 |
Table 5: Month-wise average AQI for Nagpur
*Note: Highest value is coded as red and lowest value as green and other colour spectrum populated based on median value.
Tables 6 and 7 analyse the major contributing pollutant based on pollutant wise recordings at each station from 2017 to 2023, aiding in understanding the primary pollutant requiring mitigation to improve AQI levels. For this the sub-index was calculated for each pollutant for all recordings and then major contributor was found out for given station and day based on highest sub index value. At the state level, PM10 emerges as the maximum contributor across stations from 2017 to 2023, indicating that particulate matter is the predominant pollutant responsible for elevated AQI levels in Maharashtra and major cities. Moreover, Table 7 identifies the top three pollutants contributing to AQI at stations in each city, facilitating the development of city-specific strategies to address air quality concerns. Findings from the study corroborate the significance of particulate matter as a major contributor to poor air quality, particularly in urban areas with high levels of industrial and vehicular emissions.
|
No. of recordings that reported highest sub-index value of given pollutant in Maharashtra |
|||||||
|
Year |
CO |
NH3 |
NO2 |
O3 |
PM10 |
PM2.5 |
SO2 |
|
2017 |
578 |
|
316 |
287 |
1201 |
424 |
114 |
|
2018 |
326 |
1 |
382 |
318 |
3089 |
1279 |
2999 |
|
2019 |
464 |
|
1151 |
462 |
4330 |
1636 |
352 |
|
2020 |
784 |
1 |
1227 |
632 |
3558 |
1761 |
454 |
|
2021 |
630 |
2 |
1304 |
165 |
3429 |
2144 |
423 |
|
2022 |
595 |
8 |
1141 |
198 |
3759 |
1568 |
751 |
|
2023 |
601 |
|
660 |
162 |
4695 |
1479 |
515 |
Table 6: No. of recordings that reported highest sub-index value of given pollutant in Maharashtra
*Note: Highest value is coded as red and lowest value as green and other colour spectrum populated based on median value.
|
City |
Top 3 pollutants (No. of recordings reported highest sub index value of given pollutant) |
|
Aurangabad |
PM10 (1581), PM2.5 (429), O3 (201) |
|
Chandrapur |
PM10 (2685), PM2.5 (1038), O3 (419) |
|
Kalyan |
PM10 (913), PM2.5 (361), SO2 (338) |
|
Mumbai |
PM10 (10896), PM2.5 (4406), NO2 (3581) |
|
Nagpur |
PM10 (1060), PM2.5 (698), O3 (361) |
|
Nashik |
PM10 (1031), PM2.5 (813), O3 (493) |
|
Navi Mumbai |
PM10 (1655), PM2.5 (1022), SO2 (870) |
|
Pune |
PM10 (871), CO (707), PM2.5 (514) |
|
Solapur |
PM10 (1527), NO2 (385), CO (249) |
|
Thane |
PM10 (1248), PM2.5 (420), NO2 (359) |
|
Vasai |
PM10 (594), PM2.5 (465), NO2 (379) |
Table 7: Top 3 pollutants at city level during 2017 to 2023
3. Discussion:
The results obtained from the study shed light on several actionable insights for the state government to effectively address the escalating levels of Air Quality Index (AQI) in Maharashtra.
One of the key action points highlighted by the results is the importance of utilizing the monsoon season as a preparatory phase for implementing ground-level interventions to mitigate the drastic increase in AQI levels during the winter season. This includes strategic planning for infrastructure development, strengthening administrative machinery, capacity building initiatives, and active involvement of local governments. This emphasizes the significance of seasonal variations in air quality and advocate for seasonal-specific interventions to effectively mitigate pollution levels.
Another crucial action point identified is the necessity of formulating city-specific action plans tailored to address the top contributing pollutants in each urban centre. For instance, Mumbai may focus on reducing PM10, PM2.5, and NO2, while Pune may prioritize the reduction of PM10, CO, and PM2.5. The regional variations in air quality trends are likely to be influenced by factors such as industrial activities, vehicular emissions, and meteorological conditions, underscoring the importance of localized interventions to combat air pollution challenges. Additionally, Ganguly et al. (2020) emphasizes the importance of identifying city-specific sources of pollution to tailor effective mitigation measures and improve air quality in urban environments. Conducting field studies and in-depth assessments in cities like Nashik and Pune, which have consistently exhibited good performance in terms of average AQI from 2017 to 2023, can provide valuable insights into best practices on the ground. By learning from these cities' successes, the government can develop targeted strategies and replicate successful initiatives in other regions to mitigate air pollution effectively.
The sector-specific mitigation measures need due attention to address major contributors to air pollution, such as PM10, PM2.5, NO2, SO2, and CO, to improve air quality in Maharashtra.
By implementing these sector-specific mitigation measures and policy interventions, Maharashtra can effectively combat air pollution and safeguard public health and the environment. Collaboration among government agencies, industries, civil society organizations, and the public is essential for the successful implementation of these measures and achieving sustainable improvements in air quality.
5. Limitations of the study:
The primary limitation of the air quality indexing system is its focus on representing the level of only one pollutant at a time, resulting in an index value based on the concentration of a single pollutant. This limitation restricts the systems from capturing the cumulative impact of multiple pollutants on air quality, thus providing an incomplete picture of overall air pollution levels.
Another critical limitation is the absence of consideration for the synergistic effects of pollutants on human health, ecosystems, and the environment within current air quality systems. While individual pollutant concentrations may fall below regulatory limits, the combined effect of multiple pollutants could still pose significant risks to public health and ecological integrity. Failure to account for these cumulative effects may result in underestimation of air pollution-related health impacts and hinder efforts to implement targeted mitigation strategies.
3. Conclusion:
In conclusion, the objective of the research is to provide valuable insights into the dynamics of air quality in Maharashtra, India, and propose evidence-based interventions to mitigate pollution levels. The study utilized a mixed-methods approach, combining quantitative analysis of air quality data with qualitative assessments of mitigation interventions, to offer comprehensive insights into the state's air quality challenges.
The findings reveal a notable increase in the average Air Quality Index (AQI) from 2017 to 2023, with varying trends across regions. City-specific action plans tailored to address top contributing pollutants emerged as crucial strategies for effective mitigation. Sector-specific interventions targeting key sources of pollution in transport, industries, construction, and residential/commercial sectors were identified as essential measures to improve air quality in Maharashtra.
Despite the challenges and limitations, collaborative efforts among stakeholders are crucial for achieving sustainable improvements in air quality. By implementing sector-specific mitigation measures and policy interventions, Maharashtra can effectively combat air pollution, safeguard public health, and promote sustainable development.
However, it is essential to acknowledge the limitations of current air quality indexing systems, including their focus on single pollutants and the absence of consideration for cumulative effects.
Moving forward, ongoing research, continuous monitoring, and collaborative efforts among government agencies, industries, civil society organizations, and the public will be essential to track progress and adapt strategies to evolving environmental challenges. By prioritizing evidence-based interventions and fostering collective action, Maharashtra can pave the way towards cleaner air and a healthier environment for its residents.
Declarations:
Ethics approval and consent to participate:
Not applicable.
Consent for publication:
Not applicable.
Availability of data and materials:
The data supporting the findings of this study can be made available upon request.
Competing interests:
I wish to confirm that there are no known conflicts of interest associated with this publication and there has been no significant financial support for this work that could have influenced its outcome.
Funding:
The author did not receive any fundings for this research work.
Acknowledgements:
I would like to express my deepest gratitude to Dr. Avinash Dhakne, IAS, Member Secretary, MPCB, whose expertise and guidance were invaluable during this research. His advice on research methodology and immense knowledge on field level challenges helped me to broaden my perspective. My sincere thanks to Dr. Vidyanand Motiram Motghare, Joint Director, Air, MPCB, Mr. Nandkumar Namdeo Gurav, Assistant Secretary, MPCB, Dr. Vishwajeet Ramesh Thakur, Principal Scientific Officer, MPCB, and Mr. Dinesh Sonawane, Statistical Officer & IT HoD for their insightful discussions during focused interviews. Moreover, I am grateful to MPCB for providing continuous support to in providing access to database and helping me to understand the air quality index. My sincere thanks to entire Maharashtra Pollution Control Board team for providing this opportunity to study aspects around air quality index and mitigation measures therein.


Open Access By Aditum Open Access Journals id licensed under Creative Commons Attribution 4.0 International License. Based On a Work at aditum.org