Ophthalmology and Vision Care
OPEN ACCESS | Volume 4 - Issue 1 - 2025
ISSN No: 2836-2853 | Journal DOI: 10.61148/2836-2853/OVC


Mukesh Tanwar
Post-Doctrol Fellow (National Institutes of Health, Maryland, USA), Assistant Professor (Stage 3), Department of Genetics, Maharshi Dayanand University, Rohtak, HR-124001.
Corresponding Author: Mukesh Tanwar, Post-Doctrol Fellow (National Institutes of Health, Maryland, USA), Assistant Professor (Stage 3), Department of Genetics, Maharshi Dayanand University, Rohtak, HR-124001.
Received Date: March 01, 2023
Accepted Date: March 06, 2023
Published Date: March 09, 2023
Citation: Tanwar M. (2023) “Evaluating the role of Retinal Biomarkers and Artificial Intelligence in the diagnosis of Age-related Macular Degeneration”, Ophthalmology and Vision Care, 3(1); DOI: http;//doi.org/03.2023/1.1035
Copyright: © 2023 Mukesh Tanwar. This is an open access article distributed under the Creative Commons Attribution License, which permits unrestricted use, distribution, and reproduction in any medium, provided the original work is properly cited.
Age-related macular degeneration (AMD) is one of the most common causes of severe vision loss worldwide affecting people over the age of 55 years. AMD associated retinal biomarkers have become a target in research as they aid in understanding the mechanism of disease, determining the risk of disease progression, and serving as outcome metrics for clinical research. Artificial intelligence has the potential to provide excellent tools for the diagnosis of advance AMD. Methods based on machine learning (ML) and particularly deep learning (DL) are able to identify, localize, and quantify diagnostic features in AMD. The goal of this mini-review is to give an overview of the most important retinal biomarkers of AMD identified using multiple imaging modalities and summarize studies related to modern artificial intelligence algorithms for the diagnosis of the disease.
Introduction
Age-related macular degeneration (AMD) is an acquired macular disease resulting in irreversible loss of central vision. It is the 3rd leading cause of vision loss in people over the age of 55 years (Shen et al., 2016). The world report on vision estimates that there are 196 million AMD patients worldwide (Vyas et al., 2023). A recent meta-analysis predicted that until 2050, there will be 39.05 million and 6.41 million new cases of early and late AMD, respectively (Wang et al., 2022). There are two different phenotypes of late AMD: dry (atrophic) and neovascular (wet, exudative) AMD. Dry AMD is characterized by drusen formation and photoreceptor degeneration, while in neovascular AMD (nvAMD) there is an abnormal growth of sub-retinal blood vessels (Stahl, 2020). Although both forms result in visual impairment, the neovascular form is responsible for 90% of the vision loss. The multifactorial etiology of AMD involves complex histopathological changes in the retina and drusen formation (Soundara Pandi et al., 2021). These morphological and structural changes are used to determine the stage of the disease, identified with the help of retinal imaging techniques (Metrangolo et al., 2021). Color fundus photography (CFP), fundus fluorescence angiography (FFA), indocyanine green angiography (ICGA), fundus autofluorescence (FAF), optical coherence tomography (OCT), and optical coherence tomography angiography (OCTA) are all imaging techniques that can be used to determine the clinical stage of AMD (Victor, 2019). These imaging modalities have been the main applications of artificial intelligence (AI) in screening, diagnosis, and treatment of AMD (Pucchio et al., 2022).
Artificial intelligence is a branch of computer science that seeks to develop intelligent machines to mimic brain function. In 1959, Arthur Samuel developed a sub-set of AI known as machine learning (ML). ML is focused on providing computers the capability to learn without being explicitly programmed (Schmidt-Erfurth et al., 2018b; Dong et al., 2021). Deep learning (DL) is part of a larger group of machine learning methods that are based on the framework of an artificial neural network, composed of multiple inputs and a single output. As opposed to traditional ML methods, which function through task-specific algorithms or engineered features, DL provides data representation (Romond et al., 2021).
Artificial intelligence has exhibited a promising future in biomedical science, particularly in the diagnosis of ocular diseases. A number of studies have attempted to assess the performance of AI in the diagnosis of AMD. Considering that early diagnosis is one of the biggest issues in the care of AMD patients, the identification of imaging biomarkers could add to the patient screening process and enable earlier detection, improving vision outcomes.
This minireview aims to summarize the different imaging biomarkers contributing to AMD diagnosis and provide an overview of AI applications, including machine and deep learning models, for the same.
Imaging Biomarkers
Biomarker refers to morphological and structural changes that enable the diagnosis and progression of a disease. Over the last decade, a number of imaging biomarkers appeared to have a diagnostic value in association with AMD (Metrangolo et al., 2021). Key retinal imaging biomarkers associated with AMD include drusen, hyper-reflective retinal spots/dots/foci (HRF), subretinal hyper-reflective material (SHRM), outer retinal tubulation (ORT), retinal thickness, RPE atrophy, retinal fluids, and pigment epithelial detachment (PED) (figure 1).
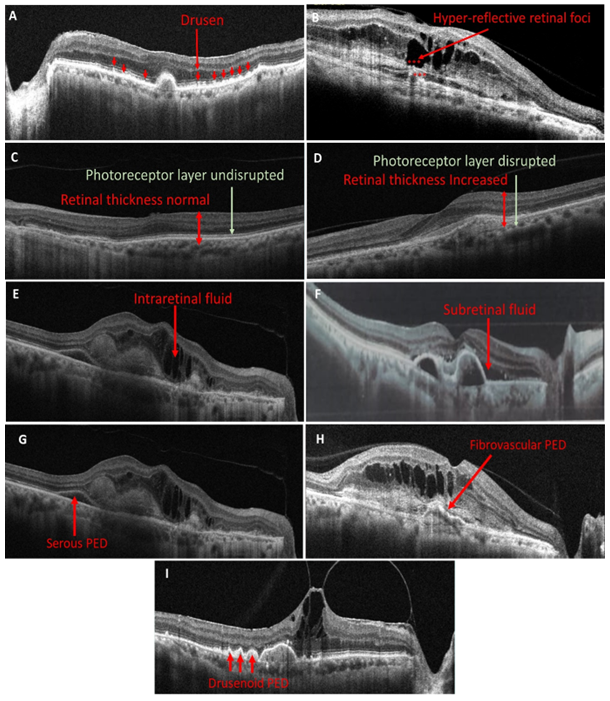
Figure legend: Predictive retinal Biomarkers (A) the presence of dome-shaped elevations of RPE represents Drusens (B) red stars are representing Hyper-reflective retinal foci (C) retinal layers and photoreceptor layer appears normal (D) Compared to figure 1(c) retinal thickness is increased and photoreceptor layer is disrupted (E) hyporeflective cystoid gaps suggests presence of Intraretinal fluid (F) Exudation between RPE and photoreceptors refers to Subretinal fluid (G) Serous PED is recognized as a smooth, rounded elevation of the RPE over an optically empty region that is inferiorly confined by an obvious Bruch's membrane (H) Fibrovascular PED appears as irregular RPE elevation in contrast to the smooth elevation of a serous PED (I) Drusenoid PED is visible as smooth contour of the detached hyperreflective RPE band.
2.1. Drusen
Drusen are small yellowish deposits between the basal lamina of human retinal pigment epithelium (RPE) and the inner collagenous layer of Bruch’s membrane (BM). Presence of drusen is hallmark of all AMD phenotypes. Epidemiologically, drusen with a diameter of 63 µm and an age of ≥55 years is typically set as the lower limits of relevance for the diagnosis of AMD. Drusen can be categorized as hard (small), soft (soft), cuticular, refractile and pseudo-reticular (Garrity et al., 2018; Flores et al., 2021b).
Hard drusen are yellow deposits with diameter <63 µm. These deposits are hypothesized to be precursor of AMD. In the presence of >8 hard drusen in one eye, the chances of the development of soft drusen increases conspicuously (Pedersen et al., 2018). Soft drusen are poorly defined deposits, extending beyond 63 µm, and have non-discrete borders (Flores et al., 2021b). Compared to hard drusen, soft drusen are more common in AMD patients. Also, patients having baseline soft drusen are more likely to be affected by advanced form of AMD (Baumal et al., 2022).
Drusen were primarily described using color fundus photograph (CFP) prior to the development of multimodal imaging. Drusen characteristics investigated in CFP include its size, area, and pigmentary changes. While CFP may enable qualitative assessment of drusen sufficient for routine clinical practice, quantitative analysis is generally limited. On ICGA, drusen shows hyperfluorescent spots. The wider range of drusen morphologies can be best identified using OCT imaging, which also offers reproducible quantitative analysis (Garrity et al., 2018; Sakurada et al., 2022). Using SD-OCT, small- and medium-sized drusen can be observed more clearly as distinct areas of elevated RPE with variable reflectivity, which suggests the variable composition of the underlying material (Kanagasingam et al., 2014).
Cuticular drusen, also known as basal laminar drusen are small, yellowish deposits under RPE (Yoon et al., 2022). Cuticular drusen have been observed in the eyes of patient with advanced form of AMD. Although cuticular drusen are also reported in vitelliform macular detachment, the visual prognosis is better for AMD patients (Sato et al., 2015). In images of CFP of cuticular drusen, it is seen as visible RPE changes, while hypefluorescence like “stars in the sky” like appearance on FA. On late phase ICGA, the cuticular drusen appears as a number of hyperfluorescencnt spots. OCT images shows saw-tooth pattern (Sakurada et al., 2022).
Refractile drusen (RD), also known as “ossified drusen” or “crystalline drusen”, are shining yellow-hyper-refractile dots which are clearly visible in the absence of the RPE layer. RD is believed to be composed of calcium and is thus also referred to as “calcified drusen” (Mishra et al., 2019). The presence of calcified drusen has been observed in both early and advanced forms of AMD. These drusen have a glistening (also described as chalky white, shiny, or calcific) appearance as determined by funduscopy or CFP (Oishi et al., 2017). Their OCT appearance is referred to as "heterogeneous internal reflectivity within drusen" (HIRD). HIRD are distinguished by a hyporeflective core and hyperreflective cap (Sakurada et al., 2022).
Reticular pseudodrusen (RPD), also termed as subretinal drusenoid deposits (SDD) are morphological retinal changes that differ from conventional drusen by being situated above RPE’s level (Wightman & Guymer, 2019). RPD increases the risk of AMD by 3.4 times in the elderly population. These are significantly correlated with phenotypic features of advance AMD (Rabiolo et al., 2017). However, in 2022, Wu et al. found that the risk of developing late AMD was not linked to the existence of RPD or their baseline extent (Wu et al., 2022). RPD are classified into three categories based on their appearance in multimodal imaging: dot, ribbon, and midperipheral (Spaide & Curcio, 2010). Reticular pseudodrusen were discovered on blue light photography. On CFP, ribbon pseudodrusen could be distinguished more easily than with near infrared reflectance (NIR). While, dot pseudodrusen are easy to identify on NIR. SD-OCT reveals RPD as drusenoid deposits over RPE (Ueda-Arakawa et al., 2013).
2.1.1. Drusen Volume: The analysis of drusen volume is crucial for understanding the disease's pathogenesis. Multiple studies using SD-OCT on patients with early- or intermediate-stage AMD identified that drusen area, height, and length predicted progression to late-stage. Individuals with higher baseline drusen volume are at higher risk of progression to advanced forms. An increase in drusen height is associated with progression to GA, while drusen length is related to progression to nvAMD (Flores et al., 2021a). Drusen with baseline volume above 0.03 mm2 are a significant indicator of advance AMD development (Hanson et al., 2022).
Hyper-reflective retinal spots/dots/foci
The hyperreflective foci (HRF) are retinal lesions (20–40 μm in diameter) that appear as roundish, hyperreflective spots in the retinal layer. HRF expression has been linked to a number of retinal diseases, including diabetic macular edema, AMD, retinal vein occlusion, retinal dystrophies, and uveitis (Fragiotta et al., 2021). In 2008, Khanifer et al. reported HRF for the first time with SD-OCT in AMD. Interestingly, HRF were observed overlying regions of RPE elevation and frequently in conjunction with calcified drusen (Khanifar et al., 2008). Additionally, an increase in HRF is associated with RPE atrophy and considered a precursor to GA (Fragiotta et al., 2021). HRF may manifest as single or in groups. They are relatively stable and are thought to be strong predictor of AMD progression (Flores et al., 2021a).
Subretinal hyper-reflective material:
Subretinal hyper-reflective material (SHRM) is a morphological characteristic seen on OCT as hyper-reflective material that is located external to the retina, and internal to the RPE (Willoughby et al., 2015). SHRM is most likely composed of fluid, fibrin, blood, scar, or fibrovascular tissue (Alex et al., 2021). SHRM in AMD has a prognostic significance, as persistence of these materials are associated with sub-retinal fibrosis and a poor visual outcome even with treatment (Sahoo et al., 2020).
Outer retinal tubulation
Histologically, outer retinal tubulation (ORT) was defined as interconnecting tubes that contain degenerated photoreceptors and envelop Müller cells in AMD (Schaal et al., 2015). ORTs are more frequently present in the outer nuclear layer. Over time, the occurrence of ORT in nvAMD increases and is linked to reduced visual acuity. Using OCT-B scans, OTRs are observed as hyporeflective structures surrounded by a hyperreflective band (Metrangolo et al., 2021).
Alterations of outer retinal layers
Neovascular invasion and fluid exudation results in significant damage to the photoreceptor layers resulting in severe functional loss. OCT can identify changes like signal alterations in the outer retina's hyperreflective bands (Schmidt-Erfurth & Waldstein, 2016). Degeneration and loss of photoreceptors are known characteristic feature of advance AMD and thought to be key factors leading to vision loss (Metrangolo et al., 2021).
Retinal thickness
Retinal thickness has become a common and useful tool for diagnosing and monitoring AMD. Previous research has demonstrated an increase in retinal thickness in AMD patients compared to healthy controls (Zouache et al., 2020). Retinal thickness measurement is the simplest method for quantifying retinal changes on OCT. A persistent increase in retinal thickness is indicative of localized leakage. The major drawback of retinal thickness as a biomarker is that it encompasses a variety of retinal compartments. The simple measurement of central retinal thickness does not distinguish the contribution of these components to pathological changes and visual outcomes (Wong et al., 2021).
Retinal pigment epithelial atrophy
Retinal pigment epithelial (RPE) atrophy is marked by a degeneration of retinal layers, RPE and choriocapillaris (Hanson et al., 2022).
Retinal fluids:
As mentioned above, nvAMD is characterized by abnormal growth of choroidal vessels, breaking through BM and proliferating through sub-RPE space. These vessels can penetrate into the subretinal and intraretinal layers beyond RPE. Depending on the extent of the CNV and the retinal tissue's capacity to resolve it, exudation caused by the immaturity of these vessels frequently leads to fluid accumulation in different layers (Metrangolo et al., 2021). This fluid accumulation can be best visualized by using SD-OCT (Kanagasingam et al., 2014).
Intraretinal fluid:
Intraretinal Fluid (IRF) is a cystoid accumulation of fluid in the inner layers of retina that is frequently accompanied by increased retinal thickness (Metrangolo et al., 2021). Presence of IRF is frequently associated with poor visual acuity, signifying that the neovascular network has begun to invade the retina after bursting through its constricted sub-RPE space. Depending on the imaging quality, IRF on OCT can either be present as hyporeflective cystoid gaps or as diffused retinal thickening (i.e., a retinal thickness of ≥100 µm suggests presence of fluid) (Wong et al., 2021).
Subretinal fluid:
Subretinal fluid (SRF) is defined as an exudation that occurs between the outer border of photoreceptor cells and the inner border of the RPE (Metrangolo et al., 2021). SRF is the only biomarker which is consistently associated with a positive response to anti-VEGF treatment (Wong et al., 2021). In a clinical study the presence of SRF was found to be associated with high visual outcomes and lower atrophy, even when intravitreal therapy is administered less frequently (Sadda et al., 2018).
Pigment epithelial detachment
Retinal pigment epithelial detachment (PED) refers to a pathological condition in which the RPE separates from the inner layer of the BM due to the presence of blood, serous exudate, drusen, or a neovascular membrane. The presence of PED is a typical symptom of both wet and dry forms of AMD (Karampelas et al., 2020).
The following mechanisms contribute to the development of PEDs in context of AMD: (a) Age-related material deposition and thickening of BM cause a steady drop in hydraulic conductivity, which causes impermeability to fluid passage (Bird, 1991); (b) RPE cells gradually accumulate residual bodies, which causes drusen formation and RPE gradually gets separated from BM (Bressler et al., 1994); (c) occurrence of choroidal neovascularization, which results in development of leaky blood vessels in sub-RPE space through BM (Green et al., 1985). The main types of PEDs are as follows:
Serous retinal pigment epithelium detachment
Serous PED develops as a result of fluid accumulation between RPE and BM. It manifests as well-defined elevations of the RPE. The fluid accumulation occurs due to an increase in choriocapillaris leakage and reduction in RPE pump function (Altintas* & Ilhan, 2018). Approximately 10% of patients suffering from the wet AMD have serous PED. Clinically, it was first characterised by Haab (V. Pasyechnikova et al., 2012). Upon clinical examination, it can be observed as a smooth, yellow-orange colored, circular/oval area of regular detachment of RPE and neurosensory retina (Capuano et al., 2020). On FA, it is characterised by presence of hyperfluorescent lesions with well-defined borders. ICG videoangiography can be used to enhance the visualization of a CNV beneath a serous PED that is not visible by FA. Using ICG, serous PEDs typically show up as a region that is less luminous than the choroidal background (Pepple & Mruthyunjaya, 2011).
By using OCT, the serous PED is recognised as a well demarcated, dome-shaped elevation of RPE (Sacconi et al., 2018; Karampelas et al., 2020). By using FAF, the detachment area appears hyperautofluorescent, while borders appear as hypoautofluorescent pigment deposits (Pepple & Mruthyunjaya, 2011).
Drusenoid retinal pigment epithelium detachment:
Drusenoid PED is associated with confluent soft drusen and poses a high risk for dry AMD. With AMD being the most frequent scenario, the development of drusenoid PEDs can also be seen in other retinal conditions that exhibit AMD-like symptoms, such as malattia leventinese, cuticular drusen, and maculopathy linked to membranoproliferative glomerulonephritis type II (Mrejen et al., 2013). Drusenoid PED develops slowly and results in minor complaints of vision impairment (Roquet et al., 2004).
Clinically, they are observed as elevations of RPE with clear borders, yellow or yellow-white in color (Mrejen et al., 2013). On visualisation through FA, early phase of drusenoid PEDs generally appears as faint hyper-fluorescent followed by a transit stage that includes steady increase in fluorescence and no late leakage. On OCT, drusenoid PEDs are observed as a smooth contour of the detached band of hyperreflective RPE with an undulating appearance in some cases (Amaro et al., 2015). Through ICG angiography, area of drusenoid PED will block the underneath choroidal vasculature (Pepple & Mruthyunjaya, 2011).
Fibrovascular retinal pigment epithelium detachment
Fibrovascular PEDs are related to presence of choroidal noevascularization (Yonekawa & Kim, 2014). Fibrovascular PEDs are distinguishable from serous PEDs on the basis of funduscopic examination due to their irregular surface contour. Fibrovascular PEDs may be associated with hyperpigmented RPE, sub-retinal hemorrhage, sub-retina lipid exudation, and intra/sub-retinal fluid accumulation. The elevation is often low and borders are poorly defined. Upon clinical examination, fibrovascular PED appears as a smooth, well-circumscribed, yellow-orange elevation of the RPE without leakage. On FA, these exhibit uneven hyper-fluorescence during the early phase and staining during the late phase (Capuano et al., 2020). While on ICGA, fibrovascular PEDs exhibit either a focused, well-defined hyperfluorescent area that is smaller than 1 disc diameter, known as a hot spot, or a broader, more variable hyperfluorescent area known as a plaque (Karampelas et al., 2020). On FAF, FPEDs display a range of patterns, such as zones of hyper-and hypo-autofluorescence corresponding to RPE proliferation, photoreceptor loss, organised blood and atrophy, or masking by fresh blood (Camacho et al., 2015). They are visible on OCT as an irregularly elevated RPE with an interior which is not optically empty (Coscas et al., 2007).
Artificial Intelligence: role in identifying biomarkers
Artificial intelligence has the potential to identify the diagnostic features for individual patient outcomes. The majority of advances in using AI for AMD have been focused on the application of models that are capable of facilitating image analysis, particularly automated segmentation, extraction, and quantification of imaging-based features. The key AI-based models for image analysis are discussed in this section (Table 1).
Table 1: Different artificial intelligence techniques in analysing the retinal biomarkers in AMD.
|
Study |
Study Region |
Imaging technique |
Clinical feature |
Model |
Metrics |
|
Fully Automated Detection and Quantification of Macular Fluid in OCT Using Deep Learning |
Austria |
OCT |
Detection and quantification of IRF and SRF |
DL |
AUC for IRF 0.94 AUC for SRF 0.92 |
|
DeepSeeNet: A deep learning model for automated classification of patient-based age-related macular degeneration severity from color fundus photographs |
Maryland |
CFP |
Large drusen, pigmentary abnormalities, and progression to late AMD |
DL (DeepSeeNet) |
AUC in the detection of large drusen (0.94), pigmentary abnormalities (0.93), and late AMD (0.97). |
|
Quantitative Analysis of OCT for Neovascular Age-Related Macular Degeneration Using Deep Learning |
United Kingdom |
OCT |
Drusen, IRF, SRF, SHRM, HRF, fibrovascular PED, and serous PED |
DL |
- |
|
Machine Learning of the Progression of Intermediate Age-Related Macular Degeneration Based on OCT Imaging |
Austria |
OCT |
Drusen regression, HRF |
ML |
Prediction within the first 2 years achieved an AUC of 0.75. |
|
Identifying Medical Diagnoses and Treatable Diseases by Image-Based Deep Learning |
China |
OCT |
Drusen, neovascularization |
DL (transfer learning algorithm) |
AUC: CNV vs normal-1; drusen vs normal- 0.99 |
|
Artificial intelligence for morphology-based function prediction in neovascular age-related macular degeneration |
Germany |
SD-OCT, FAF |
retinal microstructure in nvAMD |
ML |
Mean absolute error (MAE)- 3.94 dB |
|
Development of a Deep-Learning-Based Artificial Intelligence Tool for Differential Diagnosis between Dry and Neovascular Age-Related Macular Degeneration |
Republic of Korea |
OCT, FA and ICGA |
Drusen, sub-retinal fluid |
DL |
accuracy - >0.9 |
|
Artificial Intelligence to Identify Retinal Fundus Images, Quality Validation, Laterality Evaluation, Macular Degeneration, and Suspected Glaucoma |
Spain |
CFP and OCT |
Drusen, pigmentary abnormalities |
DL |
Retinal fundus image had AUC of 0.947, (sensitivity 96.9%, specificity 81.8%). AMD had AUC of 0.936 (sensitivity 90.2% specificity 82.5%), |
|
A Deep Learning Approach for Automated Detection of Geographic Atrophy from Color Fundus Photographs |
Maryland |
CFP |
Geographic atrophy |
DL |
For geographic atrophy detection, AUC- 0.933-0.976 |
|
Automatic drusen quantification and risk assessment of age-related macular degeneration on color fundus images |
The Netherlands |
CFP |
Drusen |
ML |
AUROC- 0.948 |
|
Predicting wet age-related macular degeneration (AMD) using DARC (detecting apoptosing retinal cells) AI (artificial intelligence) technology |
Italy |
OCT |
Subretinal fluid |
DL (Detection of Apoptosing Retinal Cells [DARC]) |
sensitivities and specificities >70% |
|
Role of Deep Learning-Quantified Hyperreflective Foci for the Prediction of Geographic Atrophy Progression |
Austria |
SD-OCT |
HRF |
DL |
- |
|
An enhanced OCT image captioning system to assist ophthalmologists in detecting and classifying eye diseases |
India |
OCT |
neo-vascularization, drusen |
Various CNNs |
Accuracy of 0.969 |
|
Predicting conversion to wet age-related macular degeneration using deep learning |
United Kingdoms |
OCT |
Neo-vascularisation |
Artificial intelligence system |
Sensitivity of 80% at 55% specificity and sensitivity of 34% at 90% specificity |
|
Deep learning is effective for the classification of OCT images of normal versus Age-related Macular Degeneration |
Washington |
OCT |
Drusen, retinal pigmented epithelium changes, IRF, SRF |
DL |
Dice coefficient for segmentation of IRF, SRF, SHRM and PRD are 0.78, 0.82, 0.75 and 0.80 |
|
Retinal Specialist versus Artificial Intelligence Detection of Retinal Fluid from OCT: Age-Related Eye Disease Study 2: 10-Year Follow-On Study |
Maryland |
SD-OCT |
Drusen, IRF, SRF |
ML (Notal OCT Analyzer) |
For retinal fluid accuracy was 0.805 and a sensitivity of 0.468 at 0.970 specificity |
|
Artificial Intelligence Machine Learning of Optical Coherence Tomography Angiography for the Diagnosis of Age-related Macular degeneration |
Taiwan |
OCT-A |
Neo-vascularization |
ML (ResNet34) |
Accuracy 87.2% |
|
Automatic drusen quantification and risk assessment of age-related macular degeneration on colour fundus images |
The Netherlands |
CFP |
Drusen |
ML (supervised) |
AUROC values of 0.948 and 0.954 |
|
Automatic identification of reticular pseudodrusen using multimodal retinal image analysis |
The Netherlands |
CFP, FA |
Reticular pseudodrusen |
ML |
AUROC value of 0.941 |
|
Quantification of key retinal features in early and late age-related macular degeneration using deep learning |
The Netherlands |
OCT-B scans |
SHRM, retinal fluid |
DL |
For 11 out of 13 features mean Dice score was 0.63±0.15 and ICC was 0.62±0.21 |
|
Machine learning to analyze the prognostic value of current imaging biomarkers in neovascular age-related macular degeneration |
Austria |
SD-OCT |
IRF, SRF, PED |
Random forest regression algorithm |
At baseline, OCT features and BCVA were correlated with R2 = 0.21 |
|
Application of automated quantification of fluid volumes to anti–VEGF therapy of neovascular age-related macular degeneration |
Austria |
SD-OCT |
IRF, SRF, PED |
DL (CNN) |
- |
|
Automated quantitative assessment of retinal fluid volumes as important biomarkers in neovascular age-related macular degeneration |
Population from different regions |
OCT |
IRF, SRF, PED |
AI |
Large ranges that differed by population were observed at the treatment-naïve stage: 0-3435nl (IRF), 0-5018nl (SRF), and 0-10022nl (PED) |
|
Automated segmentation of lesions, including subretinal hyperreflective material in neovascular age-related macular degeneration |
South Korea |
SD-OCT |
IRF, SRF, PED, SHRM |
Automated segmentation algorithm with CNN |
Dice coefficients for segmentation of IRF, SRF, SHRM, and PED were 0.78, 0.82, 0.75, and 0.80, respectively; |
|
Predicting risk of late age-related macular degeneration using deep learning |
Participants from Age-Related Eye Disease Studies AREDS and AREDS2 |
OCT, CFP |
Progression to late-stage AMD |
DL and survival analysis |
The C-statistic score was 86.4 |
|
Combining macula clinical signs and patient characteristics for age-related macular degeneration diagnosis: A machine learning approach |
Italy |
OCT |
Drusen, RPE pigmentation, subretinal fluid, macular thickness |
ML |
Logistic Regression, AdaBoost, and random forests with a mean AUC of 0.92, followed by decision trees and support vector machines with a mean AUC of 0.90. |
|
Risk Prediction Model for Progression of Age-Related Macular Degeneration |
South Korea |
- |
Drusen location, size, number |
Risk prediction model |
C-statistic score- 0.84 |
AI: Artificial intelligence; AMD: Age-related Macular Degeneration; AUC: rea under the ROC curve; DME: diabetic macular edema; RVO: Retinal Vein Occlusion; OCT: Optical Coherence Tomography; DL: Deep Learning; IRF: Intraretinal Fluid; SRF: Subretinal Fluid; CFP: Color fundus photograph; HRF: Hyperreflective Foci; iAMD: Intermediate AMD; ML: Machine Learning; SD-OCT: Spectral Domain Optical Coherence Tomography; nvAMD: Neovascular AMD; FA: Fluorescein Angiography; ICGA: Indocyanine Green Angiography; OCTA: OCT-Angiography; CNN: Convolutional Neural Network
3.1. Machine learning-based identification:
Grinsven et al. evaluated a ML system for the automatic detection and quantification of RPD by analysing images obtained from CFP, FAF, and near-infrared image (van Grinsven et al., 2015).
Schmidt-Erfuth et al. examined IRF, SRF, and PED in OCT volume scans to evaluate the predictive potential of ML in terms of best-corrected visual acuity (BCVA). At baseline, there was a slight correlation between BCVA and OCT (Schmidt-Erfurth et al., 2018a).
Bogunović et al. developed a ML-based approach that uses a large number of biomarkers to calculate the risk of AMD progression. The model is based on imaging biomarkers that were evaluated just three months apart at the baseline and first follow-up visit. With an AUC performance of 0.75, the evaluation revealed that the developed model is useful for forecasting drusen events within the next 2 years (Bogunović et al., 2017).
Marginean et al. used ML technologies to track the development of AMD with the goal of assisting the ophthalmologist in determining when early treatment is required. Surprisingly, shallow ML algorithms outperformed more sophisticated techniques like deep neural networks in this situation (Marginean et al., 2022).
Deep learning-based identification:
In recent years, deep learning (DL) has gained enormous global interest. DL has been widely used in occurred in image recognition, speech recognition, and natural language processing, but its impact on healthcare is just beginning. In context to diagnosis of ocular disorders, DL has been applied to CFP, OCT, and visual fields. In conjunction with telemedicine, DL in ocular imaging can be used in screening, diagnosing, and monitoring major ocular diseases (Ting et al., 2019).
Roy et al. proposed ReLayNet, a deep learning network architecture influenced by U-Net with modified layer-to-layer connections for segmentation. ReLayNet accomplished precise segmentation of seven retinal layers with fluid in pathological OCT scans (Roy et al., 2017). Ting et al. developed a clinically acceptable DL system for diagnosis of AMD. For AMD diagnosis (using 72 610 images) AUC was 0.931(Ting et al., 2017, 2019).
Fauw et al. developed a new DL architecture in context to reach the performance of retinal in a real-world. The DL architecture was tested on heterogeneous set of 3D-OCT scans (De Fauw et al., 2018).
Schlegl et al. established a fully DL-automated approach for measuring macular fluid in OCT images produced by AMD, DME, and retinal vein occlusion. They suggested that DL-based retinal fluid identification and measurement could yield outcomes similar to those of a human performer. They also asserted that DL-automated assessment of OCT pictures provided a bright future for enhancing the precision and dependability of retinal diagnosis for clinical investigations, practices, and patient care in ophthalmic settings (Schlegl et al., 2018). Lee et al. used a DL framework for the automated diagnosis and segmentation of retinal diseases. They developed a crucial OCT image segmentation model. This methodology was used by the authors in 14,884 clinically heterogeneous scans (Lee et al., 2018). Kermany et al. provided researchers with a human-labeled dataset to train convolutional neural networks (CNNs) to "read" OCT image layers and incorporate them into projected disease classifications (Kermany et al., 2018). Similar to this, Prahs et al. trained their deep learning algorithm to mimic a doctor when making treatment decisions (Prahs et al., 2018).
Peng et al. used DeepSeeNet, a DL model for automated classification of AMD from CFP images, to evaluate the extent and chances of progression of late AMD. DeepSeeNet's automated AMD risk categories demonstrated good reliability and accuracy (Peng et al., 2019).
In 2020, Peng et al. combined DL and survival analysis to develop a frame work for predicting patient risk of late AMD. The model attained a five-year C-statistic of 86.4 when validated in case of an independent test data set of 601 participants, which significantly outperformed that of retinal specialist using two existing clinical standards of 81.3 and 82.0, respectively (Peng et al., 2020).
Mores et al. used a DL–based segmentation algorithm for automatic identification and quantification of multiple OCT features, including drusen volume, retinal fluids, serous PED, HRF, and SHRM (Moraes et al., 2021). Liefers et al. utilized a DL for quantification and segmentation of retinal features that are commonly associated with both forms of late AMD. The mean intraclass correlation coefficient (ICC) for the model and observer was 0.66±0.22 and 0.62±0.21, respectively. (Liefers et al., 2021).
Bilc et al. developed a support tool based on graph theory and geodesic distance for segmentation of retinal layers. The system gives control and transparency over the segmentation process by allowing a human expert to intervene after each automatic step to validate fine-tuning of automatic segmentation. For AMD patients, this method has the limitation that the presence of drusen prevents accurate segmentation of OS-RPE and RPE-CH boundaries (Bilc et al., 2022; Damian & Nicoară, 2022).
Conclusion
Retinal biomarkers are crucial for identifying vulnerable patient populations and exposures that could cause disease before AMD development. Historically, clinical parameters such as drusen size, pigmentary abnormalities, and fellow eye status were the most important predictors. In clinical trials and clinical practice, the central retinal thickness serves as a biomarker to guide retreatment management. Fluid localization in different compartments offers superior prognostic value. Intraretinal fluid reduces vision and is regarded as degenerative if it persists beyond the initial therapeutic interval. Subretinal fluid is linked to superior visual benefits and a lower rate of geographic atrophy progression. The application of AI to ophthalmology practice represents a promising step forward in the direction of an automated and repeatable analysis of clinical data. AI-algorithms have the potential to enhance clinical research and clinical practice in AMD diagnosis and treatment, enabling optimal visual outcomes. Studies have demonstrated that a number of the most important biomarkers can be correctly classified using the most recent AI models, not only to diagnose disease but also to forecast the progression of disease. This up-to-date mini-review offers a thorough explanation of how structural retinal biomarkers serve as a valuable tool to diagnose and monitor the progression of the disease. Additionally, it summarizes studies related to AI and the performance of AI-based algorithms. In this context, clinicians will be better able to allocate hospital resources and customize care to the needs of specific patients. Future studies can focus on the identification of novel analysis methods and biomarkers diagnosing AMD.


Open Access By Aditum Open Access Journals id licensed under Creative Commons Attribution 4.0 International License. Based On a Work at aditum.org