Ophthalmology and Vision Care
OPEN ACCESS | Volume 6 - Issue 1 - 2026
ISSN No: 2836-2853 | Journal DOI: 10.61148/2836-2853/OVC


Mona Abdelkader *, Sameh Salah
Mansoura ophthalmic center, Faculty of medicine, Mansoura University.
*Corresponding Author: Mona Abdelkader, Mansoura ophthalmic center, Faculty of medicine, Mansoura University.
Received: January 15, 2022
Accepted: February 01, 2022
Published: February 11, 2022
Citation: Mona Abdelkader and Sameh Salah. (2022) “Short Wavelength Automated Perimetery in glaucoma”, Ophthalmology and Vision Care, 2(1); DOI: http;//doi.org/02.2022/1.1017
Copyright: © 2022. Mona Abdelkader. This is an open access article distributed under the Creative Commons Attribution License, which permits unrestricted use, distribution, and reproduction in any medium, provided the original work is properly Cited.
Purpose:
To assess the diagnostic ability of short wavelength automated perimetry (SWAP) and optical coherence tomography (OCT) to distinguish between normal, glaucoma suspect or early glaucoma & glaucomatous eye , to compare the ability of (SWAP) and (OCT) to discriminate glaucoma patients from normal eyes, and to detect difference in peripapillary retinal nerve fiber layer (RNFL) thickness between different severities of glaucoma
Subjects & methods:
Visual field parameters and OCT RNFL measurement of 70 eyes of 35 glaucoma patients with different glaucoma stages ,50 eyes of 25 glaucoma suspect and 60 eyes of 30 normal age-matched controls were compared.
Mean deviation (MD) and corrected pattern standard deviation (CPSD) were compared with OCT RNFL thickness measurements and the results were analyzed
Results:
Average RNFL thickness was (72.6±12.9) in glaucoma group, (99±15.5) in the control group, (94±12) in glaucoma suspect The inferior quadrant was the early parameters affected. MD was (6.6±3.7) &CSPD was (2.2±1.5) in glaucoma, (0.77±0.5) & (0.3±0.4), in control group &,(1.1±1.2),(0.6±0.6) in glaucoma suspect respectively
There was significant correlation between Visual field parameters &RNFL thickness in glaucoma group while in glaucoma suspect there were no correlation between visual field parameter &RNFL thickness
Conclusion:
OCT can detect evidence of glaucomatous damage earlier than SWAP.OCT can differentiate between different degrees of glaucoma.
Glaucoma is an optic neuropathy characterized by a specific& progressive injury to optic nerve & retinal nerve fiber layer (RNFL).[1] Because injury due to glaucoma is largely irreversible, early detection and prevention of glaucomatous damage is of visual importance. Examination of the optic nerve head and its surrounding RNFL is considered essential in both detecting and monitoring of glaucoma. [2]
The optic disc and retinal nerve fiber layer undergo structural changes in glaucoma that often precede the appearance of visual field defect with standard perimetry. [3,4] Unfortunately, RNFL defect can be difficult to identify during clinical examinations
Hence, objective methods of measuring these structures may aid physicians in making accurate diagnosis.
Advances in ocular imaging technology utilizing the optical properties of RNFL provide a potential means of obtaining quantitative RNFL thickness measurements. Furthermore, these techniques offer objectivity, rapidity and reproducibility of measurements.
Optical Coherence Tomography (OCT) is an optical technique that permits non-contact; noninvasive; high-resolution cross-sectional imaging of the anterior and posterior segments of eye and quantitative assessment of different layers. [5]
Short wave-length automated perimetery (SWAP) has greater sensitivity to early glaucoma than standard achromatic automated perimetery (SAP), SWAP is a method for ganglion cell testing for glaucoma diagnosis. The ability of SWAP to isolate specific visual function associated with retinal ganglion cells might allow it to detect glaucomatous defects earlier and more extensively than SAP. [6, 7]
The purposes of the study are to evaluate the relationship between visual field detected by SWAP and retinal nerve fiber layer thickness measured by OCT, to assess the role & diagnostic ability of OCT& SWAP to distinguish between normal, glaucoma suspect or early glaucoma & glaucomatous eye and to detect difference in peri-papillary RNFL thickness between different severities of glaucoma
Subjects & Methods:
This study was conducted on patients attending the Outpatient’s Clinic of Mansoura Ophthalmic Center.
A Total 90 Subjects (180 eyes) were included in the study, 30 healthy volunteers (60 eyes) ,35 Patients (70 eyes) with primary open angle glaucoma (POAG) and 25 patients (50 eyes) with glaucoma suspect were examined between March 2010 and December 2010.
Informed consent was received. All subjects underwent full ophthalmic examination including visual acuity, refraction using (Topcon auto-refractor, Japan), Goldman applanation tonometer, Gonioscopy, dilated fundus examination using plus 90D lens, direct & indirect ophthalmoscopy, standard visual field examinations (SAP), SWAP, OCT.
The inclusion criteria were best corrected visual acuity of at least 20/40, with spherical refractive error between +2 & -2D and astigmatism <2D. Patients with any type of retinal pathology, history of retinal or refractive laser procedures, history of retinal surgery, neurologic disease or any intraocular disease, ocular trauma, secondary glaucoma, history of diabetes & more than grade 1 nuclear sclerosis were excluded. All eyes had normal open angle and no retinal disease or significant vitreous opacity. Patients with consistently unreliable visual fields defined as (False negative>33%, false positive>33% & fixation loss>20%) were also excluded.
Normal subjects were of normal health volunteers recruited from hospital staff members and medical students. All had negative family for glaucoma. Both eyes of these normal subjects (60eyes of 30subjects) were included. All normal subjects had intra- ocular pressure measurement less than 21mmHg by Goldman applanation tonometer. Optic disc appearance based on clinical stereoscopic examination was normal , absence of glaucomatous optic neuropathy (GON) was defined as verticals cup disc asymmetry between fellow eyes of 0.2 or less. Cup disc ratio of 0.3 or less and an intact neuroretinal rim without peripapillary hemorrhages, notches, localized pallor or RNFL defect. Normal visual field indices (corrected standard pattern deviation (CSPD)&mean deviation (MD)) & glaucoma hemi field test result within normal limits.
Glaucoma suspect had normal visual fields, normal tension (less than 21mmHg) with glaucomatous optic neuropathy (GON) or normal visual field, absence glaucomatous optic neuropathy and intraocular pressure reading equal to or greater than 21mmHg on at least two separate Occasion. GON was defined either of the following, Cup disc asymmetry greater than 0.2, findings of rim pallor, thinning, notching, excavation or RNFL defect, high cup disc ratio (>0.6).
Glaucomatous eyes had GON plus associated visual field loss in the corresponding hemi field location. The evaluation of glaucomatous visual field defects was made based on a liberal criteria ( two or more contiguous points with pattern deviation sensitivity loss of P<0.1 or three or more contiguous points with sensitivity loss of P<0.05 in the superior or inferior arcuate areas or a 10-dB difference across the nasal horizontal midline at two or more adjacent locations and abnormal result in glaucoma hemi field lest. [8] Only patients who had more than two reliable consistent visual field results were included.
Glaucomatous eyes were subdivided according to mean deviation of SAP (Hodapp's classification): into 3subgrooup. [9] Early glaucoma was defined by visual field loss with an MD (≤-6dB), moderate glaucoma with MD between (-6dB & -12dB) and sever glaucoma with an MD worse than (-12dB).
The Optical Coherence Tomography (OCT):
The optical coherence tomography (Topcon, 3 dimensional- 1000, USA) employs low- coherence interferometer to assess peripapillary tissue thickness. Measurements were performed by means of near infra-red low coherence illumination (840mm) with a resolution of approximately to 17µm. Because OCT is based on near infra-red interferometer, images & measurements are not affected by refractive status or axial length of eye. [10] The internal fixation target was used owing to its higher reproducibility. [11] Three circular scans, each 3.4mm in diameter, centered on the optic disc, were obtained for each test eye. A good quality image was defined as an image with signal to noise ratio >50dB. Mean RNFL thickness was calculated with the inbuilt RNFL thickness average analysis protocol. Retinal thickness was measured with the location of the vitreoretinal interface & the retinal pigment epithelium defining the inner & outer boundaries of the retinal respectively. These landmarks are seen as sharp edges with high reflectivity. The boundaries of the RNFL were defined by first determining the thickness neurosensory retina.
A functional disc map was made by dividing the optic nerve head (ONH) into 12 equal radial sectors
This scan diameter was found to be optimal & reproducible for RNFL analysis. [12] three different parameters were employed for RNFL thickness:
First: was the average RNFL thickness of the entire circumference of the optic disc.
Second: was quadrant thickness consisting of superior (46-135 degree), nasal (136-225 degrees), inferior (226-315 degrees), temporal (316-360)
Third: were the values of RNFL thickness at each sector (every clock hours)
Short Wave- length Automated Perimetery (SWAP):
Short wave-length automated perimetery is a modification of SAP using (Humphrey Field Analyses 640 Carl ziss Co, San leandro, Calif). It utilizes a 440-nm 1.80 target at 200 milliseconds duration on a 100 candelas /m2 yellow background to test selectively the short wavelength – sensitive cones and their Connection. The test is most likely processed by small bistratified blue-yellow ganglion cells, which encompass approximately 9% of the total population of retinal ganglion cells. [13] The SWAP visual field, were tested with undilated pupils using 24-2 stimulus presentation pattern and full threshold strategy. Three minutes of adaptation to (100 candelas) yellow background proceed testing. An optimal lens correction was used, and the fellow eye occluded with eye patch. Mean RNFL correlation with global indices (MD, CSPD), RNFL superior & inferior RNFL correlation with regional V.F loss were determined. Also, RNFL hemi-field difference correlation with hemi-field difference in visual field loss were determined
Statistical Analysis:
Data were analyzed using statistical package for social science (SPSS). Multiple Comparisons between groups were conducted using analysis of variance. All correlation between RNFL thickness and SWAP were assessed by the Pearson Correlation Coefficients, Data were reported as mean ± Standard deviation (SD). P value of less than 0.01 was accepted as statistically significant. Receiver operating characteristic (ROC) curves were used to describe the ability of each parameter to differentiate between groups. A perfect test would have (100% sensitivity & 100% specificity) whereas a test with no diagnostic value would have ROC of 0.5. [15]
Sensitivity for SWAP or OCT was defined as the percentage of GON eyes that had an abnormality on the test. Specificity for SWAP or OCT was defined as the percentage of eye with normal optic disc structure that had normal test.
Results:
One hundred eighty eyes (180) of ninety (90) subjects were included in the study.
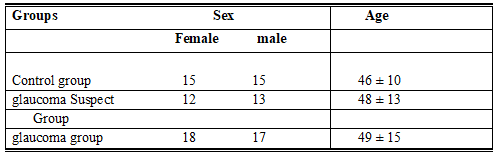
Their demographic features included in table 1. With regard to gender& age there were no significant differences between the groups.
Table 1: Demographic Features of Subjects.
The study included three groups:
Control healthy group included 60 eyes of 30 subjects, glaucoma suspect group included 50 eyes of 25 patients and glaucoma group included 70 eyes of 35 patients. Glaucoma group subdivided into 3 subgroups:
Early glaucoma included 25 eyes; moderate glaucoma included 25 eyes & sever glaucoma included 20 eyes.
RNFL thickness values in all parameters (Average, quadrants & clock hours) measured by OCT were in Table 2, 3. RNFL thickness was greatest in the superior & inferior quadrants in control normal group. RNFL thickness in the nasal & temporal quadrants was significantly thinner than in the superior & inferior quadrants. RNFL profile demonstrated the so-called "double- hump" pattern. [16] RNFL thickness in all parameters of glaucoma (early, moderate, sever) significantly differed from the control group. In glaucoma suspect group, RNFL thickness at inferior segments were significantly decreased compared with normal eyes.
OCT measured RNFL thickness was outside of normal limit in at least 1o'clock hour in 15 eyes and outside of normal limits in at least 2 clock hours in 5 eyes in glaucoma suspect. In glaucoma group the most frequent damaged OCT sectors were 6 clocks (35 eyes),7 clock (20 eyes) and8-o'clock (7 eyes,)
Mean deviation (MD) & Corrected pattern standard deviation (CPSD) of SWAP included in Table4, figure (1, 2, 3, 4, 5).
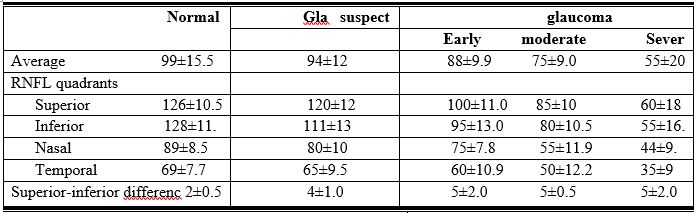 Table2: OCT parameters among groups
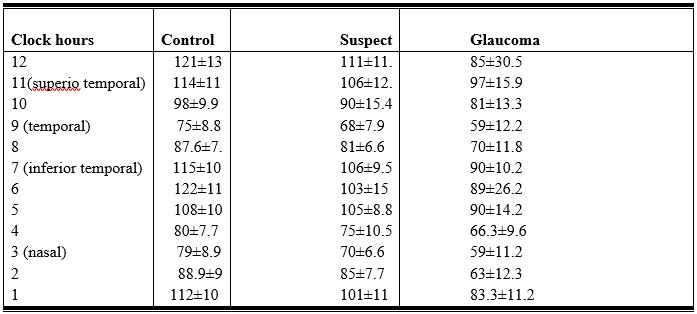 Table3: OCT over clock hours
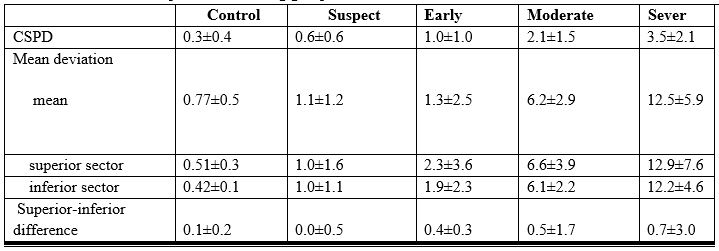
Table4: SWAP parameters among group
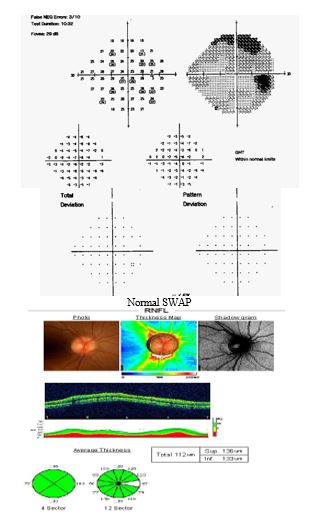
Normal OCT
Figure1: Normal group with normal OCT& normal V.F
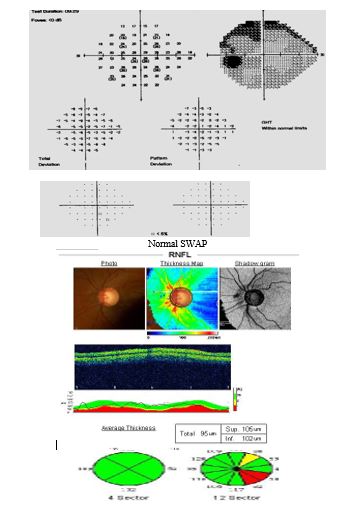
Figure 2: Glaucoma suspect with normal SWAP with abnormal OCT
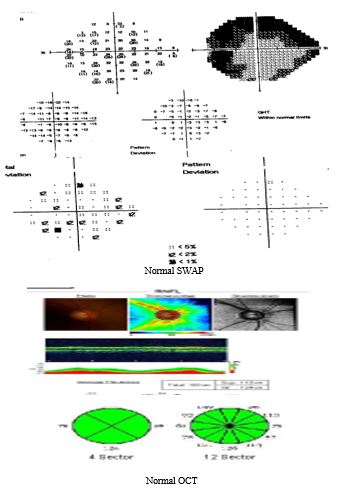
Figure 3: Glaucoma suspect with normal OCT, SWAP
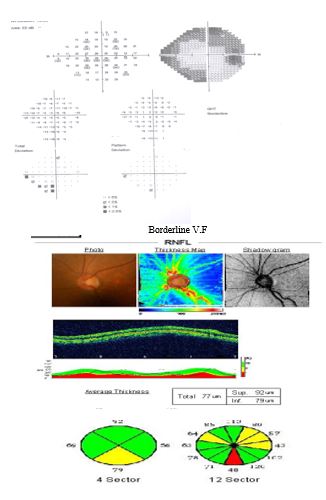
Figure 4: Early glaucoma with borderline SWAP &abnormal OCT
Abnormal sector 5,6,7 in OCT
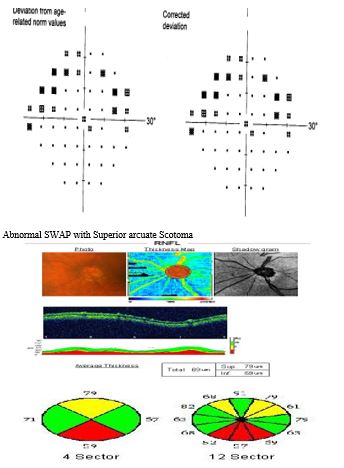
Figure 5: Moderate glaucoma with superior scotoma & inferior thinning of RNFL
Abnormal OCT with thinning superior& inferior quadrant
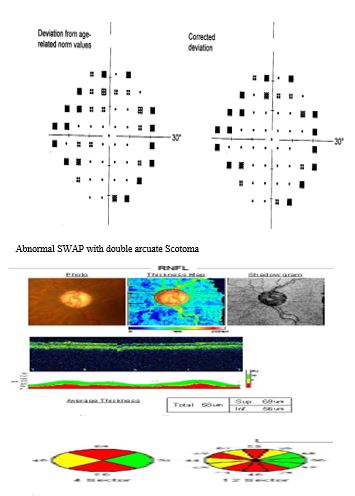
Figure 6: Sever glaucoma with abnormal OCT& SWAP
Visual field defects in the superior hemi field tended to correspond most frequently with inferior RNFL damage as measured with OCT. RNFL thickness at inferior& inferior temporal quadrant tended to correspond most frequently with superior nasal & superior arcuate position in SWAP in glaucoma group.
The relationship between RNFL thickness and visual field summarized in Table 5,6. In glaucoma, there were significant negative correlation between average RNFL& mean MD and between inferior RNFL & superior MD of SWAP while in glaucoma suspect no significant correlation between RNFL thickness &VF indices
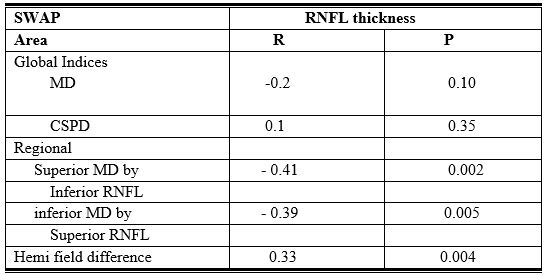
Table5: Correlation between RNFL thickness & SWAP parameters in glaucoma Suspect
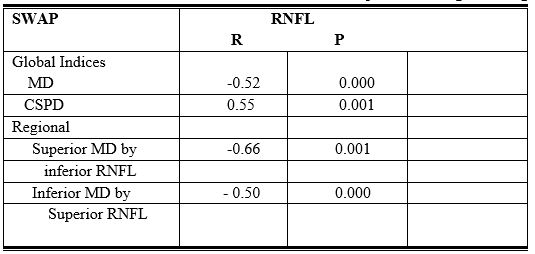
Table 6: Correlation between RNFL thickness & SWAP parameters in glaucoma group
There were no association between superior RNFL sectors & superior V.F region in either glaucoma suspect or early glaucoma
To assess the diagnostic ability of OCT & SWAP, Receiver operating characteristic curves was analyzing in glaucoma suspect & early glaucoma
In glaucoma Suspect, OCT parameters with the widest ROC were related to inferior segment RNFL thickness at 7 o'clock (0.811) inferior quadrant (0.822) & 6 o'clock (0.798).
In early glaucoma, OCT parameters with the widest curves has a similar tendency as in glaucoma Suspect, all were related to inferior region Table 7
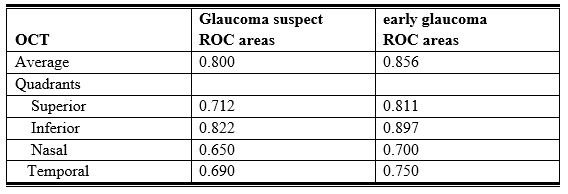
Table7: ROC Curve areas of OCT
In glaucoma Suspect, SWAP parameters with the widest ROC curves were related to superior nasal quadrant (0.611). Also, in early glaucoma
SWAP parameters were related to superior nasal quadrant with ROC curves (0.698)
Depending on the cluster criterion used, the proportion with abnormal SWAP ranged 35% to 50% in glaucoma suspect while by OCT, the proportion with abnormal RNFL thickness (one sector red or 2 sectors yellow) ranged from 55% to 80%.
A criterion with an estimated specificity in normal subjects of 91% result in 75% (15 eyes) in SWAP & 95% (3 eyes) in OCT. There was significant correlation between OCT abnormalities &SWAP visual field defect in glaucoma group.
Discussion:
Early diagnosis of glaucoma is critical to prevent permanent structural damage & irreversible visual loss. Detection of glaucoma typically relies on examination of structural damage to the optic nerve combined with measurement of visual function. OCT& SWAP were used in this study for early detection of glaucoma.
OCT provides quantitative and objective information of RNFL thickness. Also, RNFL thickness is acquired rapidly and often don't require pupil dilation. In addition, OCT measurements are not affected by refractive error and corneal bierfringence. [17, 18]
In this study, significant difference in RNFL thickness parameters among control group, all grades of glaucoma and glaucoma suspected were observed.
Previous studies have shown that OCT generated RNFL thickness is reliable for differentiating early glaucoma from normal eyes. [18-21]
Chen et al showed that average RNFL was the best parameter for differentiating early glaucoma from normal eye. [19]
While, Kamanori et al, Showed that inferior RNFL was the best parameter for differentiation. [22]
Sibata, et al found that average RNFL followed by inferior RNFL thickness had the highest power to discriminate between early glaucoma and normal eyes.
In this study, it was found that the inferior RNFL thickness followed by average RNFL thickness had the highest power to discriminate the glaucoma suspect & early glaucoma
Results in this study showed that OCT and short wavelength perimetery were well correlated. These results support the relationship between structure & function in glaucomatous eyes previously shown histopathologically and photographically and using other optical techniques. [23] optical coherence tomography measured infero temporal RNFL thinning (sectors 6. o’clock, 7 o'clock, and 8 o'clock) corresponded with SWAP damage in superior nasal region.
This result is in agreement with observations that glaucomatous visual field damage is likely to occur in a hemi field area, with superior field affected more than inferior, and that the inferior segment of optic disc is more susceptible to glaucomatous changes. [24]
Also, Sibota etal found correlation between visual field indices (MD & CPSD) and the average RNFL. There was significant positive correlation with MD and a significant negative correlation with CPSD. [21]
The Same as Yalvac etal found significant correlation between global indices MD & CSPD& RNFL thickness. [25]
While parisi etal, showed highly significant correlation between overall RNFL & CPSD, the correlation with MD having been less significant. [26]
In this study, there were correlation between MD & CPSD and RNFL thickness in all grade of glaucoma while no correlation between RNFL (average) & MD or CPSD in glaucoma suspect.
There were correlation between superior V.F defect & inferior RNFL more significant than correlation between superior RNFL & inferior V.F defect in glaucoma suspect, In glaucoma, there were significant correlation between superior V.F & inferior V.F with inferior RNFL & superior RNFL respectively.
This can be explained that SWAP stimulus affects a small subset of ganglion cell.
In summary, RNFL thickness measured on OCT provides useful method in accurately & objectively distinguish normal from glaucoma, even in the early stages of glaucoma and help to differentiate various severities of glaucoma. The average & inferior RNFL thickness among the most efficient parameters for distinguishing such differentiation.
OCT identified more SAP normal glaucomatous eyes as having abnormalities compared to normal than did SWAP in glaucoma suspect. In established glaucoma, OCT measurement of RNFL thickness & SWAP measurement of visual function are well correlated: This finding validates both techniques as indicators of glaucomatous damage


Open Access By Aditum Open Access Journals id licensed under Creative Commons Attribution 4.0 International License. Based On a Work at aditum.org