International Surgery Case Reports
OPEN ACCESS | Volume 8 - Issue 1 - 2026
ISSN No: 2836-2845 | Journal DOI: 10.61148/2836-2845/ISCR


Sergey Belyakin1,*, Sergey Shuteev1,2
1Department of General Physics, Physics Faculty, Lomonosov Moscow State University, Moscow, Russia.
2Laboratory of dynamic systems, Physics Faculty, Lomonosov Moscow State University, Moscow, Russia.
*Corresponding Author: Sergey Belyakin, Department of General Physics, Physics Faculty, Lomonosov Moscow State University, Moscow, Russia.
Received date: May 21, 2021
Accepted date: May 29, 2021
published date: June 11, 2021
Citation: Belyakin S, Shuteev S, (2021) “Classical Soliton Theory for Studying the Dynamics and Evolution of In Network.”. International Surgery Case Reports, 2(5); DOI: http;//doi.org/03.2021/1.1026.
Copyright: © 2021 Sergey Belyakin. This is an open access article distributed under the Creative Commons Attribution License, which permits unrestricted use, distribution, and reproduction in any medium, provided the original work is properly cited
This paper presents the dynamic model of the soliton. Based on this model, it is supposed to study the state of the network
1. Introduction
The term neural networks refers to the networks of neurons in the mammalian brain. Neurons are its main units of computation. In the brain, they are connected together in a network to process data. This can be a very complex task, and so the dynamics of neural networks in the mammalian brain in response to external stimuli can be quite complex. The inputs and outputs of each neuron change as a function of time, in the form of so-called spike chains, but the network itself also changes. We learn and improve our data processing capabilities by establishing reconnections between neurons [1–3]. The training set contains a list of input data sets along with a list of corresponding target values that encode the properties of the input data that the network needs to learn. To solve such associative problems, artificial neural networks can work well-when new data sets are governed by the same principles that gave rise to the training data [4].
2. Neural networks
The mammalian brain is made up of different areas that perform different tasks. The cortex is the outer layer of the mammalian brain. We can think of it as a thin sheet (2 to 5 mm thick) that folds on its own to increase its surface area. The cerebral cortex is the largest and most developed part of the human brain. It contains a large number of nerve cells, neurons. The human cortex contains about 1010 neurons. They are connected by nerve threads (axons) that branch out and end in synapses. These synapses are connections to other neurons. Synapses connect to dendrites, branched extensions of the body of a nerve cell designed to receive input signals from other neurons in the form of electrical signals. A neuron in the human brain can have thousands of synaptic connections to other neurons. The resulting network of connected neurons in the cortex is responsible for processing visual, audio, and sensory data. Fig.1 Neurons in the cerebral cortex (the outer layer of the brain, the largest and most developed part of the human and mammalian brain). Fig.2 shows a more schematic view of the neuron. The information is processed from left to right. On the left are the dendrites that receive the signals and connect to the cell body of the neuron, where the signal is processed. The right part of the picture shows the axon through which the output is directed to the dendrites of other neurons. The information is transmitted as an electrical signal. The information is transmitted as an electrical signal. Fig.3 shows a Schwann cell, which can be in a neutral state and create a left positive or right negative chirality on the axon. Fig.4 shows an example of the time series of the electric potential of a pyramidal neuron [5]. The time series consists of an intermittent series of electric potential jumps. Periods of rest without spikes occur when the neuron is inactive, and during periods rich in spikes, the neuron is active. Fig.4D. Temporary portraits of the system (1).
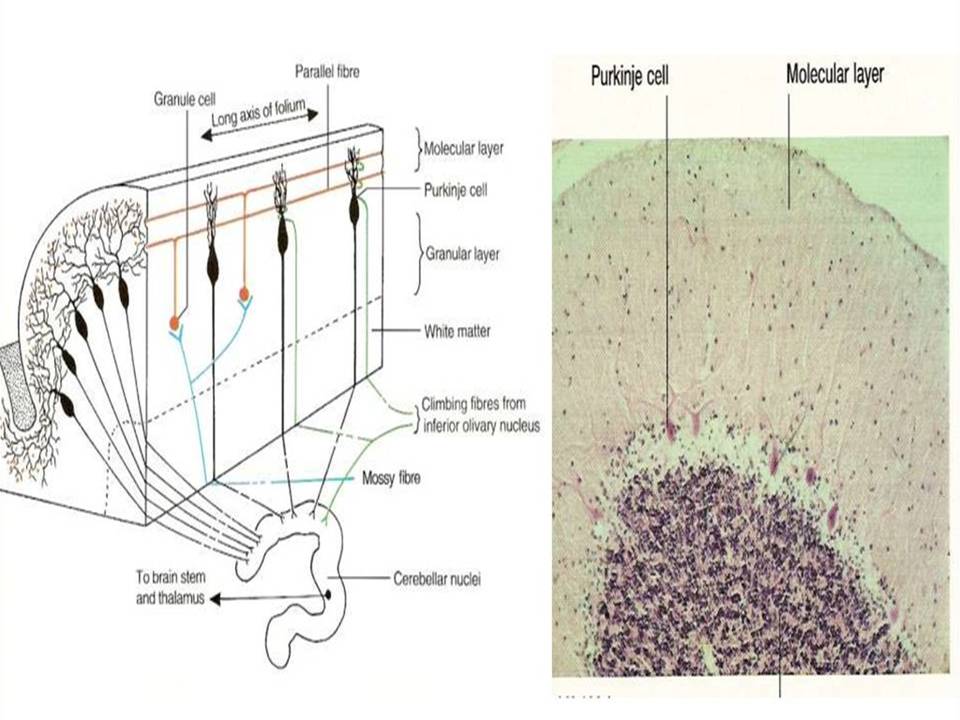
Figure 1: Neurons in the cerebral cortex (the outer layer of the brain, the largest and most developed part of the human and mammalian brain).
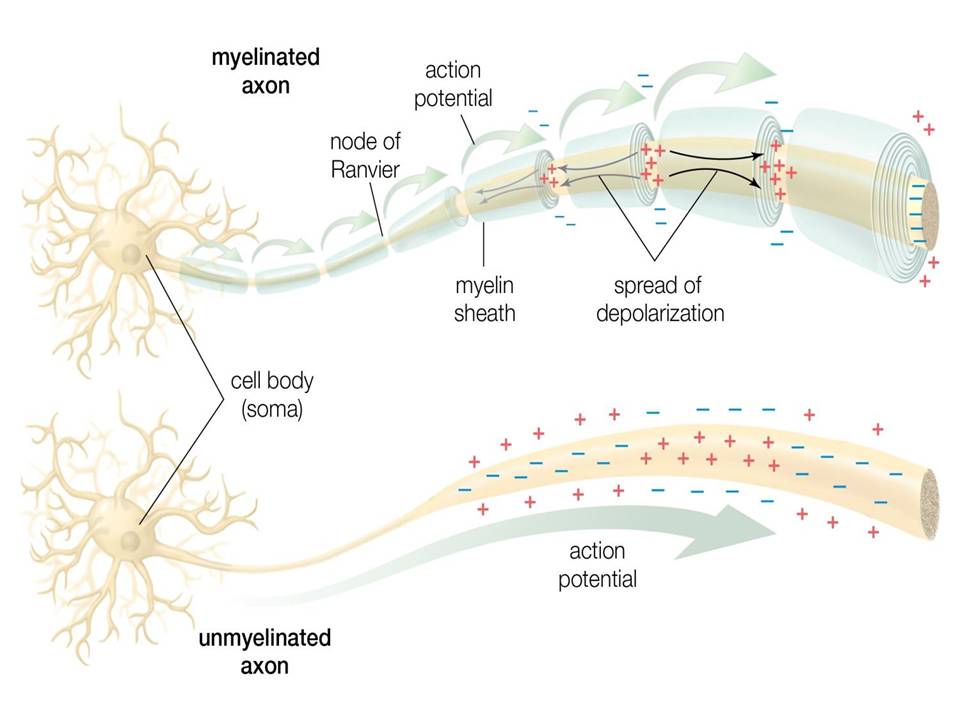
Figure 2: Schematic representation of a neuron. Dendrites receive input signals in the form of electrical signals through synapses. The signals are processed in the cell body of the neuron. The output signal is transmitted from the body of the nerve cell to other neurons via the axon.

Figure 3: Shows a Schwann cell, which can be in a neutral state and create a left positive or right negative chirality on the axon.
Figure 4: Shows an example of the time series of the electric potential of a pyramidal neuron. The time series consists of an intermittent series of electric potential jumps.
3. The mathematical dynamic model of the soliton
The mathematical dynamic model of the soliton is represented by the equation (1) [6,7]. 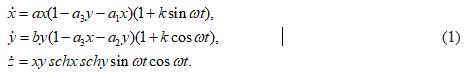
Time portraits of the system (1) are shown in Fig.5(a) active with positive a =1.0, a1 = 0.2, a2 = 0.1, a3 = 1.0, b = –2.0, k = 0.045, ω = 64π and negative a =–1.0, a1 = 0.2, a2 = –0.1, a3 = 1.0, b = 2.0, k = 0.045, ω = 64π chirality. Fig.5(b) passive positive a =0.09, a1 = 0.2, a2 =0.1, a3 = 1.0, b = –0.09, k = 0.045, ω = 64π and negative a =–0.09, a1 = 0.2, a2 = –0.1, a3 = 1.0, b = 0.09, k = 0.045, ω = 64π chirality:
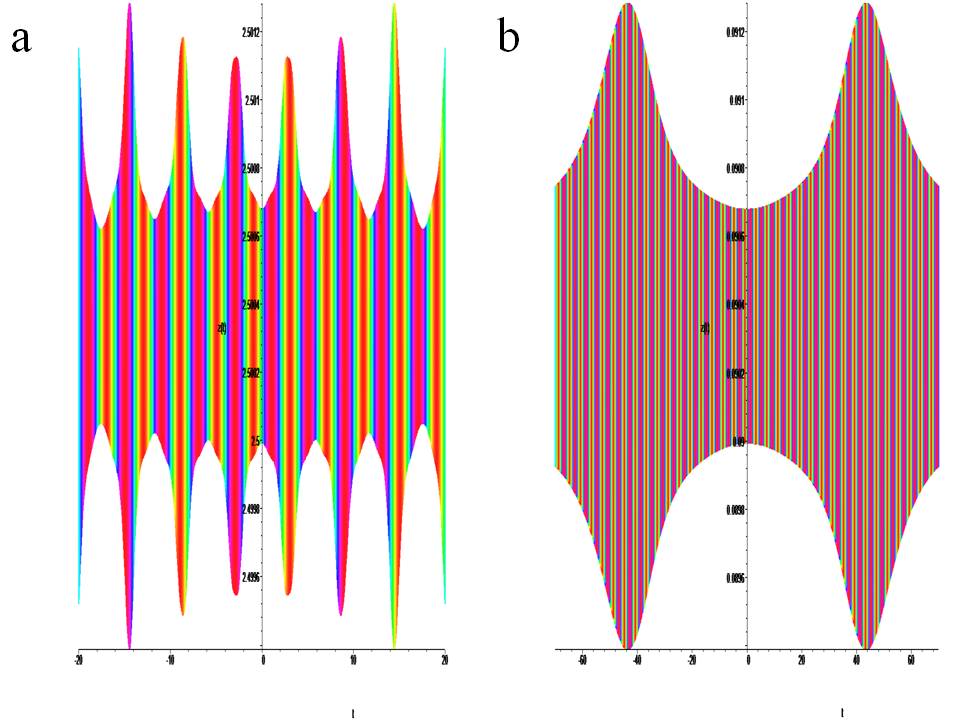
Figure 5: Temporary portraits of the system with chirality. (1) at : a) x0 = 0.4, y0 = 0.4, z0 = 2.5, b) x0 = 0.4, y0 = 0.4, z0 = 0.09.
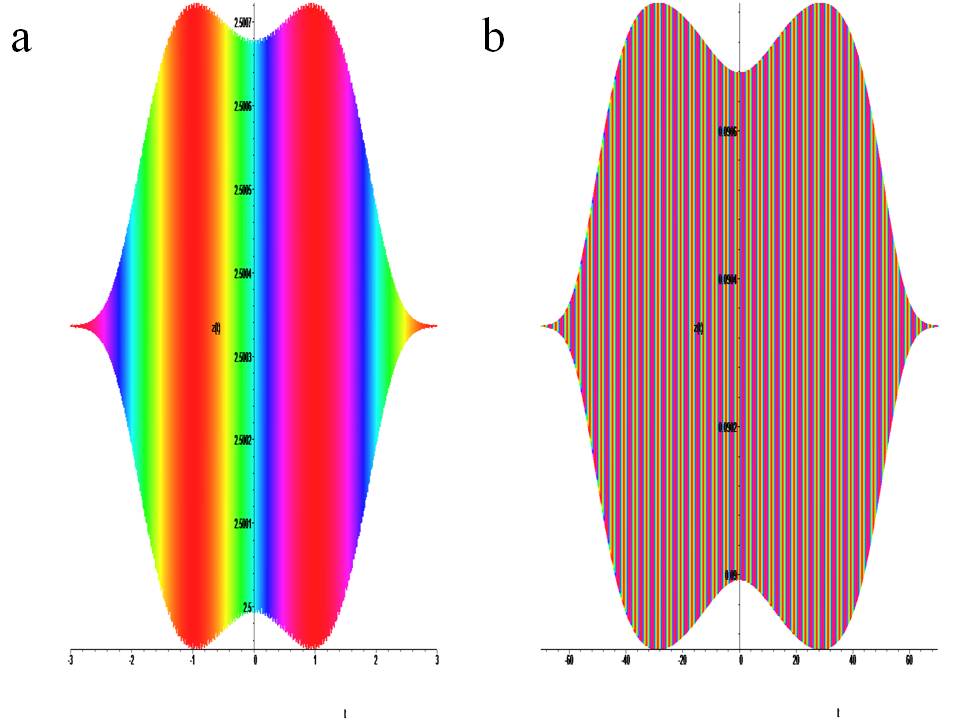
Figure 6: Temporary portraits of the system with no chirality. (1) at : a) x0 = 0.4, y0 = 0.4, z0 = 2.5, b) x0 = 0.4, y0 = 0.4, z0 = 0.09.
Time portraits of the system (1) are shown in Fig.6(a) active with positive a =1.0, a1 = 0.2, a2 = 0.1, a3 = 1.0, b = 2.0, k = 0.045, ω = 64π and negative a =–1.0, a1 = 0.2, a2 = –0.1, a3 = 1.0, b = –2.0, k = 0.045, ω = 64π lack of chirality. Fig.6(b) passive positive a =0.09, a1 = 0.2, a2 =0.1, a3 = 1.0, b = 0.09, k = 0.045, ω = 64π and negative a =–0.09, a1 = 0.2, a2 = –0.1, a3 = 1.0, b =– 0.09, k = 0.045, ω = 64π lack of chirality:
5. Result
The active states of the system are shown in Fig.5a, and their active states are shown in Fig.2(top) in yellow and Fig.4(E,F) in green.
The active states of the system are shown in Fig.5b, and their active states are shown in Fig.2(bottom) in yellow and Fig.4E in purple. Creates a continuous chaotic modulation.
The inactive state of the system is shown in Fig.6a its active state is shown in Fig.4(A,C) in yellow. It is presented in a limited time frame.
The inactive state of the system is shown in Fig.6b its inactive state is shown in Fig.4(B,C) in blue and Fig.4F in purple. It is presented in a limited time frame.
Summary:
Artificial neural networks use a highly simplified model for the fundamental computing unit-the neuron. In its simplest form, the model is simply a binary threshold unit. The network performs these calculations sequentially. Usually, discrete sequences of calculation time steps are considered, t = 0,1,2,3,.... Either all neurons are updated simultaneously at one time step (synchronous update), or only one selected neuron is updated (asynchronous update) [8–19]. We proposed a different approach to use the wave-soliton approach, taking into account chirality. In the presence of different chirality, three states are possible, with positive chirality, the signal is transmitted without loss, with negative chirality, the signal creates pulsations in certain parts of the axon. In the absence of a signal, a chaotic self-excitation is observed in the axon. A run a way with no chirality exists for a short time and represents a stop signal. The conclusion is that the soliton model can be used to study the behavior of an individual axon


Open Access By Aditum Open Access Journals id licensed under Creative Commons Attribution 4.0 International License. Based On a Work at aditum.org