
Richard M. Grimes 1*, Deanna E. Grimes 2
1Adjunct professor in the Department of Medicine, Division of General Medicine, McGovern Medical School at the University of Texas Health Science Center at Houston, USA.
2Professor Emerita at the Cizik School of Nursing at the University of Texas Health Science Center at Houston, USA.
*Corresponding author: Richard M. Grimes, Adjunct professor in the Department of Medicine, Division of General Medicine, McGovern Medical School at the University of Texas Health Science Center at Houston USA.
Received date: January 24, 2023
Accepted date: January 30, 2023
published date: February 03, 2023
Citation: Richard M. Grimes, Deanna E. Grimes. (2023) “Can 90-90-90 Policy for Control of Human Immunodeficiency Virus Infection be Accurately Calculated in the United States of America”. International Journal of Epidemiology and Public Health Research, 3(1). DOI: http;//doi.org/01.2023/1.1033.
Copyright: © 2023 Richard M. Grimes. This is an open access article distributed under the Creative Commons Attribution License, which permits unrestricted use, distribution, and reproduction in any medium, provided the original work is properly cited.
The United Nations organization for dealing with HIV infection (UNAIDS) recommends that countries adopt 90-90-90 as a policy for controlling HIV infection. It defines the policy as “90% of all people living with HIV will know their HIV status; 90% of all people with diagnosed HIV infection will receive sustained antiretroviral therapy (ART); and 90% of all people receiving antiretroviral therapy will have viral suppression” (UNAIDS, 2014). If a country achieved 90-90-90, 72.9% (.9 X .9 X .9) of Persons living with HIV (PLHs) would have a level of HIV infection that is unlikely to be transmitted through sex (Cohen, Chen & McCauley, 2011; Rodger et al., 2016). The 90-90-90 policy has been accepted by over 150 cities worldwide (Global Web Portal, 2021). For this to be a viable policy, all three elements need to be accurately measured to evaluate progress toward accomplishing 90-90-90. It is the purpose of this paper to examine the measurability of each of the 90’s in the context of the United States
Introduction
The United Nations organization for dealing with HIV infection (UNAIDS) recommends that countries adopt 90-90-90 as a policy for controlling HIV infection. It defines the policy as “90% of all people living with HIV will know their HIV status; 90% of all people with diagnosed HIV infection will receive sustained antiretroviral therapy (ART); and 90% of all people receiving antiretroviral therapy will have viral suppression” (UNAIDS, 2014). If a country achieved 90-90-90, 72.9% (.9 X .9 X .9) of Persons living with HIV (PLHs) would have a level of HIV infection that is unlikely to be transmitted through sex (Cohen, Chen & McCauley, 2011; Rodger et al., 2016). The 90-90-90 policy has been accepted by over 150 cities worldwide (Global Web Portal, 2021). For this to be a viable policy, all three elements need to be accurately measured to evaluate progress toward accomplishing 90-90-90. It is the purpose of this paper to examine the measurability of each of the 90’s in the context of the United States.
The First 90: 90% Of All People Living with Hiv Will Know Their Hiv Status
The 90-90-90 policy has been demonstrated as impossible to evaluate in Asian countries due to the uncertainty of HIV prevalence (Grimes & Grimes, 2021). If prevalence is not accurate then neither of the other the 90’s can be accurate because they are derived from prevalence. Having an accurate number of prevalent cases is unachievable. As UNAIDS states: “it is impossible to count the exact number of people living with HIV, people who are newly infected with HIV or people who have died from AIDS related illness in any country: doing so would require regularly testing every person for HIV and investigating all deaths, which is logistically impossible and ethically problematic” (UNAIDS, 2022). Because of this difficulty in knowing prevalence with precision, it is usually stated as a point estimate with high and low estimates around it. This is called the credible range which means that the true prevalence is somewhere between the high and low estimates. It should not be thought of as a normal distribution where the ends of the range are less likely than the midpoint.
Once it is recognized that there is no precise number that can be assigned to prevalence, the difficulty of evaluating 90-90-90 becomes apparent. For example, if a country had a point estimate of 10,000 cases with a credible range of 8,500 to 11,500, then 90% of the point estimate would be 9,000. This would be defined as the desired number of HIV infected persons to be identified. However, if the true prevalence is 5% lower (9,500), then 94.7% of the prevalent cases would have to be identified (9000 ÷ 9500). If the true prevalence is 10% lower, then 100% of the HIV infected population would have to be identified. Actual Prevalences more than 10% below the point estimate would mean that it would be impossible to meet the goal of 9000 cases. Similarly, if the true prevalence is 5% higher (10,500) then reaching the goal of identifying 9000 persons, would identify only 85.7% (9000÷ 10,500) of the prevalence. If the true prevalence is 10% higher (11000), accomplishing the goal of 9000 would mean that 81.8% (9,000÷11,000) of the true prevalence would be accomplished.
While this can be mathematically demonstrated. It is not clear how error would occur in the real world. Therefore, this study was conducted to examine the potential for error in high prevalence counties in the United States.
Methods
The Centers for Disease Control and Prevention (CDC) provided a point estimate of the prevalence in HIV infection in 2019 for 20 counties in the United States for which the point estimate was at least 10,000 persons (Centers for Disease Control and Prevention, 2021a). CDC also provides a 95% confidence interval around this. This means that there is a 95% probability that the true prevalence lies within the high and low estimate. This is the credible range. For our calculations we used 90% of the point estimate as the goal for first 90 0f the 90-90-90 sequence. We then calculated the degree of error that would be introduced if the low end or the high end of the confidence interval was the true prevalence. The low end of the prevalence interval was then divided by 90% of the point estimate to determine what percent of the true prevalence would have to be identified in order to meet the 90% goal. Next, we assumed that the high end of the interval was the true prevalence. The goal of 90% of point estimate was divided by the high end of the prevalence interval to see what percent of the true prevalence was identified if 90% of the point estimate was reached.
Results
Table one shows that, if the low estimate was the true Prevalence, then the counties would have the task of locating 92.6% to 97.8% of the infected persons in the county in order to meet the 90% of the point estimate. If the high end of prevalence interval was the true prevalence, reaching 90% of the point estimate would result in locating and testing only 83.3% to 87.6% of the true prevalence.
Table 1: Effect of Varying Estimates of Prevalence In 2019 On Achievement Of 90-90-90 In 20 Counties with Estimated Prevalence Of At Least 10,000 Hiv Cases
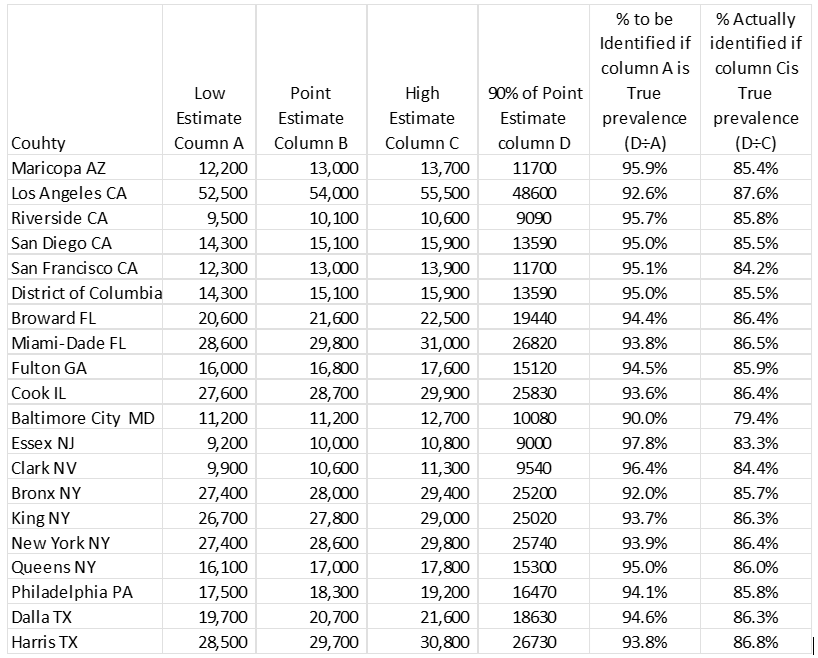
Source: Centers for Disease Control and Prevention (See Reference 7)
The Second 90: 90% Of All People with Diagnosed Hiv Infection Will Receive Sustained Antiretroviral (Art) Treatment
Achieving this “90” requires several steps prior to the actual receipt of medications. First those who are identified as HIV positive must be linked to care. The Centers for Disease Control and Prevention (2020) estimated that 87.7% of newly diagnosed individuals were linked to care within three months of being HIV tested. as measured by receipt of an HIV viral load or CD4 count. However, the use of home HIV test kits may make the CDC estimate of new HIV positive cases too low and inflate the percent that are linked to care. This may not be a trivial number. France, with a population that is one fifth of the United States, distributed 95,000 home test kits in 2019 (Staista, 2021). An internet survey of men from the U.S.A. who have sex with men and who self-identified as HIV negative found that 82% of the 6163 respondents were highly likely or somewhat likely to use a free home HIV test (Sharma, Sullivan & Khosropour, 2011). A follow up study of New Yorkers who received a home test kit found that, of those who tested positive, 22% did not receive a confirmatory test during the study period so that their test results could not be linked to subsequent HIV laboratory tests (Edelstein et al., 2020). This could be an important source of error, given that there is some evidence that those who seek anonymous HIV testing have higher rates of positivity (Salway-Hottes & Gilbert, 2012).
Entry to care is merely the first step to being sufficiently engaged in care to actually receive ART. The failure to remain in care prior to receiving ART has been documented since the early days of multidrug therapy (Giordano et al., 2005) and regularly since that time (Marks et al., 2010; Lourenco et al., 2016; Yoo-Jeong et al., 2022). Barriers to remaining in care include injection drug use (Salway-Hottes & Gilbert, 2012; Giordano et al., 2005), alcohol use (Salway-Hottes & Gilbert, 2012), younger age (Salway-Hottes & Gilbert, 2012; Govindasamya, Ford, & Kranzerd, 2012), indigency (Salway-Hottes & Gilbert, 2012; Judd et al., 2021), transportation difficulties, stigma, gender, and problems with child care (Govindasamya, Ford, & Kranzerd, 2012), and source of payment (Marks et al., 2010). Providing services such as substance abuse counselling (Monroe et al., 2020), case management (Marks et al., 2010; Nijhawan et al., 2017), evening hours and multiple medical care services (Marks, et al., 2010) have not been found to maintain patients in care prior to initiation to ART.
An additional factor impacting access to sustained ART is access to experienced providers and adequate facilities. This is highly variable in the USA, ranging from excellent in parts of major cities to marginal in some rural areas. PLWAs living in urban areas have better proximity to care but may experience significant travel time because of needing to use public transportation. Due to low population density, HIV care in rural areas requires extended travel time and the need for private transportation (Salway-Hottes & Gilbert, 2012; Vyavaharkar et al., 2013). It is likely that availability of and accessibility to care will impact the ability of areas to reach the second 90.
Perhaps the most important barrier to sustained ART is the requirement of finding an entity that will cover the cost of care in a manner that continues without interruption. In the United States HIV related costs are considerable with an estimated lifetime cost of $420,285 (Bingham et al., 2021). These costs are covered by a hodgepodge of funding sources including private insurance, state and local governments, the Veterans Administration, The Indian Health service, Medicare, Medicaid, charitable organizations, and the AIDS Drug Assistance Program (ADAP). Each of these funding sources has multiple rules for who is eligible for payment of care. These can include place of residence, income, age, current or previous employment, ability to prove Native American ethnicity or previous military service. A major source of payment for ART medications and other HIV related costs is the ADAP program. This is administered by the individual states and the District of Columbia so there are 51 different rules for eligibility which change with some frequency depending on available funding. The services that will be reimbursed and the deductibles and co-pays for the privately insured are based on literally hundreds of different policies that are offered by dozens of insurance companies and are negotiated by employers. These can be changed through loss of employment or by employers renegotiating benefits or changing insurers. Determining who can receive clinical care, laboratory assays and ancillary services are determined at the clinical level and vary by the PLWA’s funding sources and on available resources such as staff, space and available ancillary services.
Measuring the percent of HIV infected persons who are receiving sustained ART is problematic due to the degree to which PLWHs leave care for various periods. A study of over 100,000 of persons living with HIV (PLWHs) showed that less than half were consistently retained in care (Hall et al., 2012). A meta-analysis involving over 75,000 PLWHs reported that 41% were not retained in care (Marks et al., 2010). A multisite trial that compared an enhanced intervention to standard of care only increased retention from 45% to 55% (Gardner et al., 2014). Failure to remain in care can be due to a number of factors such requirements to regularly apply for reauthorization of coverage instituted by the entity that pays for the medications. One study of 4872 PLWHs enrolled in Medicaid and who had been prescribed ART showed that over half of the enrollees had a gap in coverage in a four-year period (Monroe et al., 2017). The problem of gaps in care and undetectable viral loads is not restricted to those on Medicaid. A study that compared viral loads in both privately insured and those on Medicaid showed that 30% of the privately insured and 47% of Medicaid enrollees did not achieve viral suppression (Goldstein et al., 2020). The barriers that mitigate against 90% of PLWHs obtaining and utilizing sustained ART significant and unlikely to be surmounted in the USA’s fragmented healthcare system.
The Third 90: Achieving Viral Suppression
In as much as the regular receipt of medical care is required for PLWHs to obtain prescriptions for ART, it is difficult to see how those who are not in care can be taking the medications that would make them undetectable. Sustained ART is not now, nor is it ever likely to be 90% of PLWHs, until some means of retaining all patients in care and getting 90% of them to receive ART on a sustained basis. The Centers for Disease Control and Prevention estimated in 2020 that only about 64% of those receiving HIV care are virally suppressed below 200 viral copies (Centers for Disease Control and Prevention, 2020). This is very difficult to estimate because, as discussed above, PLWHs have gaps in care and are not likely to be receiving prescriptions. Therefore, it is unlikely that they have undetectable viral loads. Out-of-care PLHs are not being tested to measure their viral loads so it would be impossible to determine the population percent of persons with undetectable vial loads. Even among those who regularly attend HIV care, their viral loads are only measured at points in time, which are months apart, so it is not certain what the levels of virus might be between these periodic samples.
Adherence to ART is essential if the virus is to be suppressed. However, medication taking is a personal choice and is carried out without being observed by the health care providers. So, it is never clear whether any PLWH is taking the medication as prescribed in between medical care visits. Using the CDC measure of retention in care as “the percentage of persons with diagnosed HIV who had two or more CD4 or viral load tests, performed at least three months apart during a 12-month period” (HIV Gov. HIV Care Continuum, 2021), it is possible for a “retained” PLWH to have up to nine months between Viral loads. The medication taking behavior during this period is not known and may be falsely assessed as detectable or undetectable based on the most recent period of adherence to the regimen at the time of testing.
Measuring viral loads can only be done in a clinical setting so the ability to measure the level of undetectable PLWHs can only be done on those who have been retained in care. Those who were not retained in care or who never entered care have viral loads of an unknown level. The community level of undetectability should follow the usual measure of determining medication effectiveness that is used in clinical trials, intent-to-treat. The number of persons ever prescribed ART should be the denominator rather than the number whose viral loads are currently being measured. Given the high number of PLWHs whose adherence to clinical attendance was discussed above demonstrates the implausibility of ever being able to measure this last 90%.
Discussion
It is impossible to accurately measure HIV Prevalence. Those who attempt to estimate it recognize this lack of precision and make their estimates as ranges. So, whenever a percent of those being identified is calculated, it is inherently inaccurate. Further compounding this error is the fact that here is no way of determining the number of persons who test positive using home test kits but do not seek care after testing positive. Determining the second 90% cannot be accurately accomplished because of the inability to determine what happens to individuals who were linked to care but are not receiving sustained ART. The financial, personal, clinical and access barriers are large and significant impediments to providing sustained care and subsequent ART. The third 90 is not calculable because of the lost-to-follow-up problems of those who were once in care but who are no longer receiving ART prescriptions, viral load. Also, the issues of PLWAs not adhering to their prescriptions is persistent and has not been solved after 25 years of attempting to rectify this problem.
The 90-90-90 policy, although admirable in its intent, is flawed in its assumption of uniformity in the behaviors of either the undiagnosed PLWHs or the known to be infected populations. It has been shown that, once individuals learn of their HIV positivity, they modify their risk-taking behavior (Wenijaa, Bazzi, & Bazzi, 2019). Therefore, it is reasonable to assume that the 10% who have never been tested may be different in their sexual and drug using behaviors. It is also reasonable to assume that many of those who have not been tested are recent entrants to the risk pools and, when infected, are more likely to become spreaders to others who have recently entered the same risk pool. It has been estimated that those who do not know their HIV status are 3.5 times more likely to spread the infection than those who are aware of their status (Marks, Crepaz & Janssen, 2006). Skarbinski et al., 2013, estimated that PLWHs who did not know their status accounted for 30.2% of HIV transmissions. There is also the assumption that those who are receiving ART and are undetectable will remain in that status. The high level of persons who were in care and left care are thought to be responsible for over 60% of HIV transmissions (Skarbinski et al., 2013).
In the unlikely event that it became possible to determine a close approximation of each of the 90s, there would be an additional problem with 90-90-90. It is a cross sectional measure of the dynamic experiences of PLWHs. The number of individuals becoming infected varies with time and the social environment. For example, the addition of websites for those seeking sexual partners has had a major effect on the venues for the availability of sex. Drug overdose deaths numbered over 100,000 in the 12-month period ending in April 2021. This is a five- fold increase since 1999 (Centers for Disease Control and Prevention, 2021b). Many of these involved injections suggesting that there is significant potential for HIV transmission through injection drug use.
In summary, the 90-90-90 concept is elegant in its simplicity and stimulates thinking about the areas where interventions could reduce the transmission of HIV. However, it is insufficient for measuring population levels of testing, access to care, paying for care, sustaining access to medications, retaining PLWHs in care, adherence to ART prescriptions and regular receipt of viral load assays. We need to better understand the linkage between HIV prevalence and these barriers if we are going to control HIV.
,

Open Access By Aditum Open Access Journals id licensed under Creative Commons Attribution 4.0 International License. Based On a Work at aditum.org