Gastroenterology and Hepatology Research
OPEN ACCESS | Volume 7 - Issue 1 - 2026
ISSN No: 2836-2888 | Journal DOI: 10.61148/2836-2888/GHR


Tatiana Yoshimi Obara, Carla Roberta de Oliveira Carvalho*
University of São Paulo, Institute of Biomedical Sciences, Department of Physiology and Biophysics.
*Corresponding author: Carla Roberta de Oliveira Carvalho, University of São Paulo, Institute of Biomedical Sciences, Department of Physiology and Biophysics.
Received date: November 20, 2021
Accepted date: December 12, 2021
published date: January 06, 2022
Citation: Tatiana Y Obara, Carla Roberta de Oliveira Carvalho. (2022) “Insulin Resistance and NAFLD: The "Chicken or Egg" Causality Dilemma in Metabolic Disorders.”, J of Gastroenterology and Hepatology Research, 3(1); DOI: http;//doi.org/01.2022/2.10124
Copyright: © 2022 Carla Roberta de Oliveira Carvalho. This is an open access article distributed under the Creative Commons Attribution License, which permits unrestricted use, distribution, and reproduction in any medium, provided the original work is properly Cited.
Insulin is an essential peptide hormone that controls carbohydrate and lipid metabolism. Its intracellular signaling pathway starts with the tyrosine kinase activation of the transmembrane receptor, and the downstream signal transduction continues through the PI3K-Akt and MAPK pathways, ultimately influencing the functions of several cell types. The PI3K-Akt pathway regulates GLUT4 translocation, glycogenesis, glycogenolysis, glycogenesis, lipolysis, and lipogenesis, while the MAPK pathway modulates cellular growth, proliferation, survival, inflammation, and apoptosis. Perturbed intracellular insulin-mediated signaling can lead to insulin resistance, causing hyperinsulinemia, hyperglycemia, dyslipidemia, ectopic lipid accumulation, and inflammation. In some cases, metabolic disorders develop and progress to diseases such as non-alcoholic fatty liver disease. Therefore, this review aims to discuss the knowledge about altered insulin response in tissue specific insulin receptor knockout mouse models and the non-alcoholic fatty liver disease.
Introduction:
The association between physical inactivity and poor-quality diets is a major cause of the metabolic disease epidemic in contemporary society. The prevalence of disorders such as insulin resistance (IR), nonalcoholic fatty liver disease (NAFLD), obesity, and type 2 diabetes mellitus (T2DM) has increased internationally over the years and is responsible for a high mortality rate, making these conditions a public health problem. In this sense, understanding the pathophysiology is essential for the prevention and treatment of these diseases.
IR is a condition in which the cells exhibit a lower response rate to insulin than normal cells. Since insulin is responsible for regulating carbohydrate and lipid metabolism, irregularities in insulin signaling can induce the development and progression of other diseases. For example, insulin resistance is a risk factor for developing DM, cardiovascular disease, and NAFLD.
This review analyzes the insulin signaling mechanism under physiological conditions and discusses the main consequences of IR and its relationship with NAFLD.
Insulin is an essential peptide hormone for energy homeostasis maintenance. Initially, the β-cells of the islets of Langerhans in the pancreas synthesize a precursor protein called preproinsulin consisting of a signal sequence, an A-chain, a B-chain, and a C-peptide. The cleavage of its signal peptide and the formation of disulfide bridges between the A and B chains forms proinsulin (Liu M et al., 2018). Subsequently, the proinsulin is cleaved at both ends of the C-peptide. This domain is removed, and a mature insulin peptide only comprising the A and B chains is produced (Weiss & Philipson, 2014).
Insulin secretion depends on blood glucose levels. The β-cells identify variations in plasma glucose concentration and react by secreting the hormone. Initially, glucose from the extracellular fluid, which mirrors plasma glucose, enters the β-cell via glucose transporter 2 (GLUT2), a membrane protein constitutively expressed in the cell membrane. Afterward, the enzyme glucokinase catalyzes glucose phosphorylation and conversion into glucose 6-phosphate. Since this reaction is the rate-limiting step of glucose catabolism and the phosphorylation rate is proportional to glucose levels, glucokinase is considered the blood glucose sensor. It allows the modulation of insulin secretion according to blood glucose levels (Roncero et al., 2004). Glucose-6-phosphate is converted into pyruvate through glycolysis; thus, this pyruvate is transformed into acetyl-CoA, which is utilized in the Krebs cycle to produce ATP. The increase in intracellular ATP concentration leads to an increase in the ATP/AMP ratio, which causes the ATP- sensitive potassium channels to close, promoting depolarization of the β-cell plasma membrane. Consequently, it increases the probability of opening voltage-dependent calcium channels, which allow Ca2+ influx. The calcium accumulation culminates in the exocytosis of insulin granules (Fu et al., 2013).
The most notable functions of insulin are the regulation of postprandial glycemia and lipid homeostasis. The maintenance of the glycemic metabolism is mediated by glucose uptake in adipose and muscle tissues, regulated by hepatic glucose production (i.e., glycogenolysis and gluconeogenesis), and induced by glycogen synthesis. Lipogenesis is regulated by lipogenesis stimulation in hepatocytes and adipocytes and by lipolysis inhibition in adipocytes. Defects in the cellular response to this hormone (i.e., IR) have hepatic and systemic consequences related to several metabolic diseases.
Summary of the main reactions in metabolic regulation and description of lipid droplets:
Before analyzing the main insulin signaling pathways, a description of lipid droplets (LDs) (Figure 1) and a brief review of the reactions related to the control of glucose and lipid homeostasis (Figure 2) are necessary for understanding the relationship between these signaling events and their influence on regulatory mechanisms.
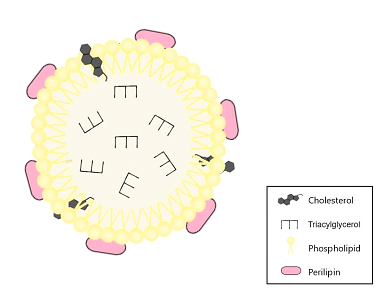
Figure 1: Structure and components of the lipid droplet (LD). The lipid droplet has a phospholipid monolayer, which is associated with perilipin and cholesterol. The core is composed of triacylglycerol.

Figure 2: Summary of the main substrates of insulin-related biochemical reactions. Description of glycogenesis, glycogenolysis, glycolysis, gluconeogenesis, lipolysis, and lipogenesis reactions.
1,3-bisphosphoglycerate (1,3BPG), 2-phosphoglycerate (2PGA), 3-phosphoglycerate (3PGA), diacylglycerol (DAG), dihydroxyacetone phosphate (DHAP), fructose 1,6-bisphosphate (F1,6BP), fructose 6-phosphate (F6P), fatty acids (FA), glucose 1-phosphate (G1P), glycerol 3-phosphate (G3P), glucose 6-phosphate (G6P), glyceraldehyde 3-phosphate (GA3P), lysophosphatidic acid (LPA), monoacylglycerol (MAG), phosphatidic acid (PA), phosphoenolpyruvate (PEP), uridine diphosphate (UDP), uridine diphosphate glucose (UDPG), triacylglycerol (TAG).
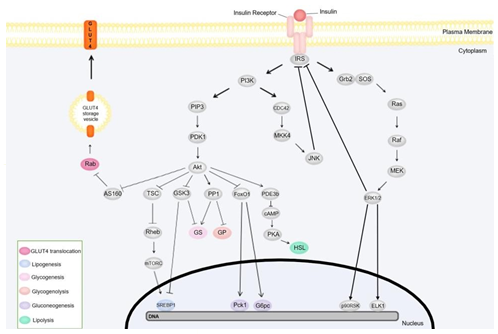
Figure 3: Mechanisms of insulin signal transduction: PI3K and MAPK pathways. The box in the lower- left corner lists energy regulation-associated proteins and genes and their function. The illustration does not represent the location of the pathway components since its focus is to illustrate the reactions sequences more clearly. Protein kinase B (Akt), Akt substrate of 160 kDa (AS160), cyclic adenosine monophosphate (cAMP), cell division cycle 42 (CDC42), ETS transcription factor (ELK1), extracellular signal-regulated kinase (ERK), forkhead box O1 protein (FoxO1), glucose 6-phosphatase catalytic subunit (G6pc), glucose transporter 4 (GLUT4), glycogen phosphorylase (GP), growth factor receptor-bound protein 2 (Grb2), glycogen synthase kinase 3 (GSK3), glycogen synthase (GS), hormone-sensitive lipase (HSL), insulin receptor substrate (IRS), c-Jun N-terminal kinase (JNK), mitogen-activated protein kinase (MAPK), MAPK/ERK kinase (MEK), mitogen-activated protein kinase kinase-4 (MKK4), mammalian target of rampamycin complex (mTORC), p90 ribosomal protein S6 kinase (p90RSK), phosphoenolpyruvate carboxykinase 1 (Pck1), phosphodiesterase 3b (PDE3b), phosphoinositide-dependent kinase 1 (PDK1), phosphatidylinositol 3-kinase (PI3K), phosphatidylinositol 3,4,5-triphosphate (PIP3), protein kinase A (PKA), protein phosphatase 1 (PP1), Ras homolog enriched in brain (Rheb), Son of Sevenless (SOS), sterol regulatory element binding protein-1c (SREBP-1c), tuberous sclerosis complex (TS0
LDs are cytosolic organelles that store lipids. They are composed of a lipid core and a membrane which consists of a phospholipid monolayer, cholesterol, and membrane-associated proteins. These proteins belong to the perilipin family and regulate the access of lipases to lipids, thus influencing lipolysis (Fujimoto & Parton, 2011).
As mentioned previously, the breakdown of glucose is initiated by its conversion to pyruvate through glycolysis. During this process, glucose is converted to glucose 6-phosphate (G6P), which gives rise to fructose 6-phosphate (F6P). F6P is then phosphorylated to fructose 1,6-bisphosphate (F1,6BP), generating glyceraldehyde 3-phosphate (GA3P) and dihydroxyacetone phosphate (DHAP). Sequentially, both molecules are converted into 1,3-bisphosphoglycerate (1,3BPG), which is dephosphorylated into 3- phosphoglycerate (3PGA) and transformed into 2-phosphoglycerate (2PGA). The 2PGA is used to produce 2-phosphoenolpyruvate (PEP) and, ultimately, pyruvate (Dashty, 2013).
Glycogen is a polysaccharide composed of glucose residues. Therefore, both synthesis (glycogenesis) and breakdown (glycogenolysis) modify the intracellular glucose concentration by adding or removing glycogen. The first step in glycogenesis involves converting G6P (produced from glucose) into glucose 1- phosphate (G1P), which can then bind to uridine triphosphate, forming uridine diphosphate glucose (UDPG). The glycogen synthase (GS) enzyme then catalyzes the transfer of glucose residues from UDPG to the glycogen fragment, extending the polymer. In contrast, glycogenolysis follows the opposite direction of glycogenesis reactions. The phosphorylation of glycogen into G1P is succeeded by G6P formation and conversion to glucose by glycogen phosphorylase (GP) (Dashty, 2013).
Lipid homeostasis is primarily mediated by lipogenesis and lipolysis. Lipolysis is characterized by repeated fatty acids removal until only glycerol remains. The process begins with the conversion of triacylglycerol (TAG) to diacylglycerol (DAG), catalyzed by adipocyte triacylglycerol lipase (ATGL). Subsequently, DAG is transformed to monoacylglycerol (MAG) by hormone-sensitive lipase (HSL). Finally, MAG is converted to glycerol by monoacylglycerol lipase (MGL). Free fatty acids (FFA) can be oxidized to generate energy. The resulting glycerol is transported from adipocytes to hepatocytes and can participate in gluconeogenesis upon conversion to DHAP (Marzzoco & Torres, 2015).
On the other hand, lipogenesis uses glucose as a substrate for lipid synthesis, which will be addressed in two steps: de novo lipogenesis (DNL), the fatty acid synthesis and its esterification into TAG. The fatty acid synthesis starts with the glucose processing into pyruvate, which will be transformed into acetyl-CoA. Next, acetyl-CoA is converted into malonyl-CoA and will originate fatty acids such as palmitate (Marzzoco & Torres, 2015). Subsequently, the ACSL enzyme catalyzes the conversion of fatty acids into acyl-CoA, which can be used in TAG biosynthesis (Li et al., 2010). It is important to point out that TAG synthesis also depends on glycolysis for converting glucose into GA3P and DHAP. Like glycerol, these substances can be converted to glycerol 3-phosphate (G3P), which can generate lysophosphatidic acid (LPA) with the addition of acyl-CoA. The addition of another acyl-CoA to LPA generates phosphatidic acid (PA), whose phosphorylation results in DAG. Finally, adding one more acyl-CoA converts DAG to TAG (Coleman & Mashek, 2011).
Gluconeogenesis links the metabolisms of carbohydrates, proteins, and lipids, since lactate, amino acids (alanine and glutamine), and glycerol are used for endogenous glucose production. Both lactate and alanine are converted into pyruvate, while glutamine is transformed into α-ketoglutarate. Subsequently, pyruvate (originating from lactate and amino acid processing and glycolysis) and α-ketoglutarate are converted to oxaloacetate, giving rise to PEP. Additionally, the PEP formed from 2PGA is converted to 3PGA and eventually gives rise to 1,3BPG. The glycerol that is converted to G3P can also be used to produce DHAP, consequently forming F1,6BP, which is dephosphorylated into F6P. Finally, F6P generates G6P, which is converted into glucose (Marzzoco & Torres, 2015).
Food intake promotes an increase in blood glucose levels that β-cells can detect. In response to increased plasma glucose concentrations, these cells release insulin secretory granules content into the internal environment, and the hormone is transported to the target cells through the blood flow. Insulin-stimulated cells have a transmembrane receptor that belongs to the receptor tyrosine kinase family. This receptor comprises two α-subunits responsible for hormone binding and two β-subunits that transduce the signal to the cell interior. Insulin binding activates this receptor and induces kinase activity through autophosphorylation of the β-subunits. Next, tyrosine kinase phosphorylates the tyrosine residues of the insulin receptor substrates (IRS), creating recognition sites for proteins with Src homology 2 (SH2) domains. Both regulatory subunit p85 of phosphatidylinositol 3-kinase (PI3K) and growth factor receptor-bound protein 2 (Grb2) have SH2 domains and bind to the IRS, initiating a signal transduction pathway and promoting different cellular responses (De Meyts, 2016; White, 2012).
IRS binding to the regulatory p85 subunit of PI3K activates its catalytic p110 subunit, resulting in the generation of phosphatidylinositol 3,4,5-triphosphate (PIP3). PIP3 activates phosphoinositide-dependent kinases 1 and 2 (PDK1 and PDK2), which in turn activate protein kinase B (Akt). The activated Akt phosphorylates and regulates substrates involved in several cellular metabolism reactions (De Meyts, 2016; White).
For example, glycogen synthase kinase 3 (GSK3) is an Akt substrate involved in blood glucose regulation. This kinase is responsible for the phosphorylation and consequent inactivation of GS, which catalyzes glycogen synthesis. In this sense, Akt-mediated phosphorylation of GSK3 leads to inhibition of this kinase, promoting glycogen synthesis (Han et al., 2016). A previous study showed that GSK3 downregulates the Sterol Regulatory Element Binding Proteins-1c (SREBP-1c) transcription factor expression, leading to the upregulation of lipogenesis-related gene expression (Bengoechea-Alonso & Ericsson, 2009).
Akt also phosphorylates the Akt substrate of 160 kDa (AS160), inhibiting GTPase activating protein (GAP) activity on Rab, a G protein that regulates vesicle movement and fusion. AS160 inhibition disrupts GTP breakdown into GDP. Since GDP-associated Rab is inactive whereas GTP-bound Ras is active, the inhibition of GAP activity results in active Rab, inducing translocation of cytoplasmic vesicles containing GLUT4. Following vesicle translocation, GLUT4 proteins are inserted into the plasma membrane of adipocytes and cardiac and striated skeletal muscle fibers, enabling cellular glucose uptake, and lowering the blood glucose concentration (Sano, 2003; Miinea, 2005).
Tuberous sclerosis complex (TSC) acts as a GAP on Ras homolog enriched in brain (Rheb) proteins. Similar to the mechanism of GAP-mediated Rab inactivation, TSC promotes the breakdown of Rheb-associated GTP into GDP, inactivating Rheb. Rheb stimulates the mammalian target of rapamycin complex (mTORC1), which promotes the activation of SREBP-1c. In other words, the TSC complex inhibits lipogenesis. However, insulin signaling induces TSC phosphorylation by Akt, resulting in the inactivation of this complex and enabling lipogenic genes expression (Matsuzaka et al., 2004; Yecies, 2011).
Akt has also been shown to phosphorylate and activate the regulatory subunit PPP1R3G of protein phosphatase 1 (PP1). Upon phosphorylation, the regulatory subunit binds to GS, GP, and glycogen phosphorylase kinase (GPK), regulating their activities. For example, binding the PPP1R3G and PPP1R3B subunits to GS leads to its dephosphorylation and activation, inducing glycogen synthesis through a GSK3- independent pathway. Additionally, PP1 also dephosphorylates and inactivates GP, catalyzing the removal of a glucose residue from glycogen and generating G1P. Thus, we can conclude that PP1 activation promotes glycogenesis and inhibits glycogenolysis since G1P can be converted to G6P and give rise to glucose (Li et al., 2019).
The transcription factor forkhead box O1 (FoxO1) is another Akt substrate. It stimulates the gene expression of phosphoenolpyruvate carboxykinase 1 (Pck1) and glucose 6-phosphatase catalytic subunit (G6pc), which can activate gluconeogenesis. Upon phosphorylation, the FoxO1 factor is sequestered from the nucleus to the cytoplasm of the cell, thus preventing it from promoting gluconeogenesis (Puigserver, 2003).
During fasting, catecholamines bind to β-adrenergic receptors and activate adenylate cyclase. Consequently, the cyclic adenosine monophosphate (cAMP) synthesis increases, activating protein kinase A (PKA). PKA phosphorylates and activates HSL and perilipin, promoting lipolysis (Duncan, 2007). However, insulin is secreted after feeding, leading to phosphodiesterase 3b (PDE3b) phosphorylation and activation and cAMP hydrolysis, preventing lipolysis (Holm, 2003).
Since blood glucose levels increases promote the activation of several mechanisms that stimulate its reduction, we can conclude that a negative feedback system sustains the insulin-mediated regulation of glucose homeostasis. The uptake of glucose by GLUT4 and its conversion into glycogen and fatty acids (by glycogenesis and lipogenesis, respectively) leads to the reduction of blood glucose. The newly produced glycogen is stored in the liver and muscles, while the fatty acids are esterified into TAG, packed into very- low-density lipoprotein (VLDL) and transported to peripheral tissues through the blood (Hall & Guyton, 2011). In contrast, the inhibition of both hepatic glucose production (i.e., glycogenolysis and gluconeogenesis) and lipolysis prevents increases in blood glucose levels due to reduced endogenous glucose synthesis and glycerol (an essential substrate for gluconeogenesis) flux from the adipocytes to hepatocytes.
The other branch of the insulin signaling pathway is the mitogen-activated protein kinase (MAPK) pathway, mediated by Grb2 binding to IRS or Shc. Grb2 is an adaptor protein bound to a guanine nucleotide exchange factor called Son of Sevenless (SOS). When bound to the IRS, the Grb2-SOS complex activates the Ras protein by exchanging Ras-associated GDP for GTP, inducing a cascade activation of Raf, MAPK/ERK kinases 1 and 2 (MEK1 and MEK2), and extracellular signal-regulated kinases 1 and 2 (ERK1 and ERK2). The activated ERK phosphorylates the transcription factors p90 ribosomal protein S6 kinase (p90RSK) and ETS transcription factor ELK1 (ELK1) and induces cell growth, proliferation, and survival (Taniguchi et al., 2006).
Insulin can activate p38 MAPK and c-Jun-N-terminal kinase (JNK), although they are often associated with cellular stress. The insulin-mediated p38 activation pathway is still unknown (Gehart et al., 2010). On the other hand, JNK activation occurs by PI3K activation. In contrast to the PI3K-Akt mediated pathway, the signaling pathway that activates the JNK factor is independent of PI3K's catalytic subunit (p110) activation. The p85 subunit activates the cell division cycle 42 (CDC42) GTPase, which phosphorylates the MKK4 kinase. MKK4 activation leads to the consequent activation of JNK (Taniguchi et al., 2007). Some MAPKs promote insulin signaling regulation by negative feedback. Both ERK and JNK phosphorylate IRS1's serine residue, inactivating this substrate (Bouzakri et al., 2003; Miller et al., 1996).
Experimental knockout mouse models with inactivation of the insulin receptor gene in specific tissues were developed to evaluate the insulin function in each tissue. The main models are LIRKO, FIRKO, and MIRKO, and their genetically modified tissues are liver tissue, adipose tissue, and muscle tissue, respectively. The phenotypes of these animals are presented in Table 1.
Table 1. Insulin receptor knockout consequences: Comparison of insulin actions, affected by tissue- specific receptor deletion and the phenotype between the knockout models. Free fatty acids (FFA), fat- specific insulin receptor knockout (FIRKO), hepatic glucose production (HGP), liver-specific insulin receptor knockout (LIRKO), muscle-specific insulin receptor knockout (MIRKO), triacylglycerol (TAG).
|
Insulin receptor knockout mice |
|||
|
Model |
Tissue |
Altered insulin action |
Physiological consequences |
|
LIRKO |
Liver |
Impaired suppression of HGP Impaired glycogen storage Decreased lipolysis |
Insulin resistance Hyperinsulinemia Fasting hyperglycemia Glucose intolerance Decreased serum TAG and FFA |
|
FIRKO |
White adipose |
Reduction in insulin-induced glucose uptake Impaired lipogenesis Impaired lipolysis inhibition |
Insulin resistance Fatty liver Decreased whole-body fat mass |
|
MIRKO |
Skeletal muscle |
Reduction in insulin-induced glucose uptake in isolated muscle cells Decreased glycogen synthesis |
Hypertriglyceridemia Fatty liver |
Table 1: Summary of main physiological consequences in the 3 tissue- specific insulin receptor knockout mice.
The LIRKO mice display lower plasma TAG and fatty acid concentrations (indicating attenuated lipid synthesis in the hepatocytes) and reduced glycogen accumulation compared to the control group. Although the basal rate of hepatic glucose production was lower than the control mice, LIRKO animals could not inhibit hepatic glucose production and had upregulated gluconeogenesis-related enzyme expression. The primary physiological manifestations described in this animal model include hyperglycemia, hyperinsulinemia, insulin resistance, and glucose intolerance (Michael et al., 2000).
FIRKO mice, on the other hand, have reduced glucose uptake and show signs of lipogenesis induction (downregulated SREBP-1c expression) and lipolysis inhibition. These alterations probably lead to reduced TAG content compared to control animals, demonstrating insulin's importance in lipid metabolism. Despite the impaired glucose translocation, FIRKO mice maintained average blood glucose concentrations (Blüher et al., 2002).
Finally, myocytes from MIRKO mice display attenuated glycogen synthesis and insulin-induced glucose uptake rates. Notably, these animals can maintain normal blood glucose and plasma insulin concentrations. It is plausible that a compensatory mechanism capable of reducing blood glucose levels by fatty acid and TAG accumulation could account for this discrepancy. The hypertriglyceridemia and increased fatty acid concentration described in MIRKO mice could result from glucose flowing to the liver and adipose tissue. In other words, glucose excess is converted into fatty acids and TAG. Thus, euglycemia is maintained while lipid concentrations rise (Brüning JC et al., 1998; Kim et al., 2000).
The physiological differences between these knockout models highlight insulin's relevance in several tissues. Moreover, evidence suggests that insulin-sensitive tissues may compensate for impaired cellular function due to insulin receptor silencing. In this sense, these models have phenotypes that are different from individuals with systemic insulin resistance.
Insulin resistance is a metabolic condition characterized by a decreased cellular response to insulin. Its origin is not well defined since this condition can be caused by genetics, environmental factors, diet, and other metabolic disorders. Notably, hyperinsulinemia, hyperglycemia, and dyslipidemia, commonly observed with persistent insulin resistance, can disrupt energy homeostasis and lead to the onset and progression of other diseases.
Reduced insulin responsiveness disrupts GLUT4 translocation in striated skeletal muscle cells and decreases glucose uptake (Tremblay et al., 2001). Insulin resistance has been shown to inhibit the suppression of hepatic glucose production (Basu et al., 2005). Consequently, the increase in blood glucose levels is detected by the pancreatic β cells, which increase insulin secretion to compensate for the resistance. During this process, mechanisms responsible for increasing β cell mass and/or activity will be triggered to amplify hormone synthesis and secretion (Steil et al., 2001; Chen et al., 1994). Thus, although these mechanisms cause hyperinsulinemia, the blood glucose remains at normal levels (Eckel et al., 2005). Other studies suggest that hyperinsulinemia is responsible for insulin resistance development, reporting that constant insulin secretion desensitizes target cells (Hirashima et al., 2003; Shanik et al., 2008; Ward et al., 1990;), generating a vicious cycle marked by a gradual increase in hyperinsulinemia and resistance.
While increased insulin secretion is limited by the β-cell's capacity for hormone synthesis and secretion, this condition is associated with reduced glucose uptake and increased hepatic glucose production, culminating in hyperglycemia characteristic of type 2 diabetes mellitus (Ormazabal et al., 2018). Hyperglycemia has also been linked to insulin resistance, thus creating another cycle like described above (Tomás et al., 2002). It has been shown that excess intracellular glucose leads to reactive oxygen species (ROS) formation causing mitochondrial dysfunction and oxidative stress (Nishikawa et al., 2000). Besides inducing cellular damage, ROS can damage DNA and activate poly (ADP-ribose) polymerase (PARP), an inhibitor of the glycolytic enzyme glyceraldehyde-3-phosphate dehydrogenase (GAPDH). PARP inhibition results in the accumulation of glycolysis intermediates that produce advanced glycation end products (AGEs). The AGEs modify molecules of the extracellular matrix and intracellular and extracellular proteins, resulting in cellular dysfunction, altered gene transcription, and inflammation induction (Brownlee, 2005; Kaikini et al., 2017). Furthermore, ROS can cause endoplasmic reticulum (ER) stress that activates the unfolded protein response (UPR) pathway and, in some cases, induce cell death (Tesauro M & Mazzotta F, 2020). Hyperglycemia induced cellular damage and dysfunction can occur in several tissue types and is frequently associated with neuropathy, nephropathy, retinopathy, cardiovascular system injury, glucotoxicity with consequent β-cell dysfunction and/or reduced insulin secretion, as commonly observed in patients with diabetes mellitus (Mouri & Badireddy, 2021; Tesauro & Mazzotta, 2020).
Another insulin resistance-induced alteration involves lipid metabolism, with its physiological manifestations including ectopic lipid accumulation and dyslipidemia. These alterations are due to the cell's inability to inhibit lipolysis and stimulate lipogenesis. Thus, since insulin is responsible for stimulating the suppression of lipolysis in adipocytes, resistance could be due to an increase in this hormone activity. Consequently, insulin increases non-esterified fatty acids (NEFA) and glycerol concentrations delivered to the liver for re-esterification or muscles where it contributes to ectopic fat accumulation (Morigny et al., 2016).
As discussed earlier, insulin signaling induces lipogenesis through SREBP-1c regulation. It is reasonable to suppose that insulin-insensitive tissues exhibit attenuated SREBP-1c synthesis and/or activation and lipogenesis rates. Interestingly, the rate of lipogenesis was reported to increase in individuals with obesity, diabetes mellitus, and NAFLD (Ameer et al., 2014; Smith et al., 2020). However, two possible explanations for this contradiction have been discussed by Haas et al. (2012).
The first hypothesis proposes that insulin resistance is selective, with some signaling pathway branches being stimulated by insulin while others are not. For example, the SREBP-1c branch can be activated by insulin and could stimulate lipogenesis, whereas the FoxO1 branch is insulin resistant and unable to inhibit gluconeogenesis, causing hyperglycemia. In contrast, the LIRKO mice have complete resistance to the hormone, impairing the entire signaling pathway (Brown & Goldstein, 2008). Therefore, lipogenesis is decreased, and hepatocytes cannot inhibit gluconeogenesis.
The other hypothesis suggests that insulin-independent pathways stimulate lipogenesis in resistant tissues. One lipogenesis-inducing pathway is mediated by the carbohydrate-sensitive response element-binding protein (ChREBP). A previous study reported that glucose activates ChREBP, regulating lipogenic genes like SREBP-1c (Denechaud et al., 2008). Other studies have demonstrated carbohydrate-induced lipogenesis activation under impaired insulin action. It has also been shown that carbohydrate-rich diets induce hypertriglyceridemia, even after infusing somatostatin, an insulin secretion inhibitor (Ginsberg et al., 1982). Moreover, mice treated with streptozotocin (a drug that causes insulin depletion) displayed SREBP-1c activation in response to carbohydrates (Matsuzaka et al., 2004).
Dyslipidemia is the result of an imbalance in serum lipids levels such as low-density lipoprotein cholesterol (LDL-C), high-density lipoprotein (HDL), and TAG (Pappan & Rehman, 2021). Specific alterations include hypertriglyceridemia, reduced HDL levels, and variable LDL-C composition (Howard, 1999). Dyslipidemia promotes increased VLDL synthesis and secretion and reduced VLDL clearance, indicating elevated concentrations of LDL-C and HDL-cholesterols. Furthermore, insulin-resistant subjects display increased cholesterol ester transporter protein (CETP) activity and reduced lipoprotein lipase activity. The augmented CETP activity improves the enrichment of HDLs with TAG. Thus, hepatic lipase can catabolize HDL into small dense LDL (sdLDL) and attenuate HDL serum concentrations. In contrast, lipoprotein lipase participates in VLDL catabolism, providing the substrate for HDL formation, and its reduction implies decreased HDL levels (Ginsberg et al., 2005; Robins et al., 2011).
Lipotoxicity caused by dyslipidemia and ectopic fat accumulation also contribute to insulin resistance. Excess FFA causes ROS generation, mitochondrial dysfunction, and oxidative stress. Accumulated DAG activates protein kinase C (PKC), activating nicotinamide adenine dinucleotide phosphate (NADPH) with consequent ROS synthesis. The ROS then activates JNK, which induces IRS serine phosphorylation, resulting in insulin resistance, increased pro-inflammatory cytokine expression, and apoptosis. It was recently reported that prolonged exposure to saturated fatty acids produces ER stress and activates the unfolded protein response (UPR), which can induce apoptosis (Yung & Giacca, 2020).
Similar to the selectivity of resistance in lipogenesis, the MAPK pathway induction by insulin is not blocked in insulin-resistant cells. It was previously proposed that hyperinsulinemia could overstimulate this pathway and intensify insulin resistance (Cusi et al., 2000). As discussed earlier, both ERK and JNK can phosphorylate the serine residue of IRS and disrupt insulin signaling. Furthermore, the inflammation induced by the IKK pathway also impairs insulin signaling (DeFronzo, 2010).
Metabolic Syndrome:
Metabolic syndrome is a cluster of risk factors including obesity, hypertension, dyslipidemia, hyperglycemia, a pro-inflammatory state, and insulin resistance for developing cardiovascular diseases and T2DM. In addition to concomitantly presenting at least two of these risk factors, the clinical diagnosis of metabolic syndrome consists of measuring waist circumference and blood pressure and analyzing blood glucose and plasma lipid levels. Individuals with this syndrome have a larger waist circumference, elevated blood pressure, elevated fasting blood glucose and TAG, and a reduced plasma HDL concentration (Lanktree & Hegele, 2017).
It is impossible to determine a common cause since several factors (genetic, environmental, and dietary) influence the development of the risk factors. However, it is possible to state that the metabolic abnormalities and their diagnosed consequences are closely associated with the effects of altered lipid and glucose metabolism.
Therefore, the combination of irregular energy substrates and metabolic disorder pathogenicity implies the metabolic reprogramming of several systems; and may contribute to the development and progression of other disorders such as nonalcoholic fatty liver disease (NAFLD), nonalcoholic steatohepatitis (NASH), and sleep apnea (Eckel et al., 2005).
NAFLD is a condition that comprises a spectrum of liver disorders. It ranges from simple steatosis with hepatocyte fat accumulation of greater than 5% of the liver mass (Brunt, 2009) and NASH characterized by steatosis, inflammation, and liver damage. Its progression can lead to fibrosis, cirrhosis, and hepatocellular carcinoma (Hashimoto et al., 2013).
Historically, the study of liver fat accumulation-related diseases began with the first description of changes in liver histology associated with alcohol abuse. Later, several authors defended this hypothesis, suggesting that alcohol intake would cause hepatic steatosis and cirrhosis, originating the concept of alcoholic liver disease (ALD). However, in 1980, Jurgen Ludwig diagnosed patients with steatosis, fibrosis, and cirrhosis who denied consuming alcohol. Consequently, the terms "nonalcoholic fatty liver disease" and "nonalcoholic steatohepatitis" were created to distinguish these metabolic disorders from ALD (Fouad et al., 2020; Lonardo et al., 2020).
Currently, NAFLD's daily alcohol consumption limit is 20g for women and 30g for men. Thus, daily alcohol consumption above this limit may induce ALD development (Hashimoto et al., 2015). Besides alcohol, this condition excludes from its etiology other steatosis-inducing factors such as the use of steatosis-inducing drugs and some liver diseases (Hashimoto et al., 2013).
One of the most accepted theories regarding the etiology of NAFLD is the multiple hits hypothesis. It suggests that the mechanism responsible for NAFLD's origin and progression is composed of diverse factors such as changes in lipid metabolism (lipid accumulation, lipotoxicity, and adipose tissue dysfunction), variations in the gut microbiota, diet, genetic factors, and post-transcriptional modifications. Indeed, lipid metabolism alterations are related to insulin resistance and obesity (Buzzetti et al., 2016).
As reviewed, insulin resistance is strongly associated with NAFLD. Additionally, the metabolic syndrome evidence and multiple hits hypothesis suggest that insulin resistance induces NAFLD development. Therefore, it is essential to analyze the consequences of insulin resistance in NAFLD pathophysiology. It is well known that reduced glucose uptake by GLUT4 and HGP inhibition results in increased blood glucose, which induces hyperinsulinemia. The high insulin levels overstimulate the DNL-inducing pathway, while hyperglycemia enables excessive fatty acid synthesis by providing high substrate availability for lipogenesis. Simultaneously, both the dietary fat uptake and adipose tissue lipolysis contribute to the increased flux of FFAs to the liver. Previous work has shown that the FFAs are then esterified into TAG, which in excess can induce hepatic steatosis (Paschos & Paletas, 2009).
High FFA concentrations can exceed the capacity of β-oxidation to reduce these substances leading to ROS generation and mitochondrial damage and dysfunction. Both oxidative stress and hyperglycemia can induce misfolded protein formation and accumulation, resulting in ER stress and UPR activation. Consequently, JNK and SREBP-1c pathways are activated, increasing lipogenesis and insulin resistance through IRS serine phosphorylation. Additionally, lipotoxicity alters cytokine and chemokine secretion and concentrations in adipocytes, stimulating macrophage recruitment. These macrophages release more cytokines and induce inflammation. For example, tumor necrosis factor-α (TNF-α) stimulates the MAPK pathway and activates inhibitor of the nuclear factor-κB kinase (IKK), whose function is NF-κB phosphorylation. Both TNF-α targets subsequently induce inflammation via JNK activation (Samuel & Shulman 2012; Buzzetti et al., 2016).
Conclusion:
Insulin is an essential hormone for regulating energy homeostasis, which is mediated by carbohydrate and lipid metabolism. Thus, alterations in insulin-mediated intracellular signaling can lead to insulin resistance, modifying the metabolism of various tissues. These metabolic alterations are associated with inflammation and increased serum insulin, glucose, and lipids concentrations and may influence the onset and progression of metabolic disorders. In the long term, these disturbances can result in organ damage and dysfunction.
Although insulin resistance is one of the multiple hits of NAFLD, it is not necessarily the cause of the disease. NAFLD is also not just a manifestation of metabolic syndrome since it can induce metabolic disturbances such as insulin resistance. As discussed, steatosis may result from excess FFAs, generated by insulin resistance, while hepatic fat accumulation may be the cause. We deduce that insulin resistance and NAFLD have a bidirectional relationship that determines the pathological progression. However, it is not possible to establish a generic causal relationship between these conditions. Thus, we must analyze each case to determine which came first.
The authors declare that there is no conflict of interest that could be perceived as prejudicing the impartiality of this review.
Author contribution:
TYO wrote the main text, and designed the figures, and CROC suggested the idea and helped with the text. Both authors have edited and approved the final version of the manuscript.
Acknowledgments:
This study was supported by grants from the Brazilian research agencies: Fundação de Amparo à Pesquisa do Estado de São Paulo (FAPESP – 2019/20464-8), and Conselho Nacional de Desenvolvimento Científico e Tecnológico (CNPq – 308093/2019-4)


Open Access By Aditum Open Access Journals id licensed under Creative Commons Attribution 4.0 International License. Based On a Work at aditum.org