Clinical Psychology and Mental Health Care
OPEN ACCESS | Volume 7 - Issue 1 - 2025
ISSN No: 2994-0184 | Journal DOI: 10.61148/2994-0184/CPMHC


Sergey Belyakin1*, Sergey Shuteev2
1Department of General Physics, Physics Faculty, Lomonosov Moscow State University, Moscow, Russia. 2Laboratory of dynamic systems, Physics Faculty, Lomonosov Moscow State University, Moscow, Russia.
*Corresponding Author: Sergey Belyakin, Department of General Physics, Physics Faculty, Lomonosov Moscow State University, Moscow, Russia.
Received: July 27, 2021
Accepted: August 13, 2021
Published: August 18, 2021
Citation: Sergey Belyakin, Sergey Shuteev. “ Pathophysiology of The Covid-19”. Clinical Psychology and Mental Health Care, 3(2); DOI: http;//doi.org/03.2021/1.10044.
Copyright: © 2021 Sergey Belyakin. This is an open access article distributed under the Creative Commons Attribution License, which permits unrestricted use, distribution, and reproduction in any medium, provided the original work is properly Cited.
The study of the effect of periodic exposure to relaxation oscillations occurring in a Van der Pol-type oscillator greatly influenced the development of mathematics in this direction. Early studies of such models demonstrated both bistability (the possibility of observing one of two modes depending on the initial conditions) and aperiodic dynamics [1-2]. These and some other results predetermined the development of the theory of maps with complex dynamics [3]. Studies of periodic effects on nonlinear oscillators have shown that multistability and aperiodic dynamics can be explained by considering one-dimensional circle maps (functions that map the circle's circumference to themselves, see below) [4-5]. It was also shown that such maps can demonstrate aperiodic dynamics as a result of a sequence of bifurcations of doubling the period [6-9].
1. Introduction
A huge number of works have been devoted to the study of the dynamics of continuous circle maps both from the point of view of mathematical interest and from the point of view of attitude to physical and biological problems [10-12]. The circle maps can also be discontinuous; the bifurcations of these maps are not so well studied. Among the studied discontinuous maps, we can distinguish a piecewise linear monotonically increasing irreversible circle map. Keener [13] considered mappings in the case when they have at least one fixed point. Such maps were considered in ergodic theory (see, for example, [14]). The dynamics of irreversible discontinuous maps that do not have fixed points was studied for piecewise linear models in the application to the study of neural networks and analog-to-digital converters. But we are primarily interested in the applications of circle mapping to the study of cardiac arrhythmias. Bub and Glass [15] considered the possible dynamics of a generalized class of discontinuous irreversible maps of a circle without fixed points and applied the results to a mathematical model of a ventricular or ventricular parasystole. In [16-22], attempts were also made to model the parasystole, but the first who guessed to use the circle mapping to study the heart was academician V. I. Arnold [23]. Although Glass recognized that the ACS and the ectopic pacemaker, as well as the ACS (sinoatrial node, covers the atrial myocardium) and having come to the AV (atrioventricular node, covers the ventricular myocardium) do not generate impulses independently, but interact in a complex way depending on the electrophysiological properties of the heart tissue, in his works the mutual influence of oscillators was not taken into account, even when modeling the induced parasystole (sinus pacemaker and ectopic affect each other), not to mention pure parasystole (when the pacemakers do not interact) [24].
The circle map curve the phase response and the Arnold tongues of
Consider some physical quantity ξ, which reflects the internal state of the biological oscillator. Let the eigenfrequency of the oscillator be equal T0. Let's call a marker any event that can be clearly seen in the experiment, which is reached by the value ξ only once per period. Such a marker may be, for example, the beginning of the action potential in the cardiac preparation. Let's define the oscillator phase as follows. The phase of an arbitrarily selected marking event (for example, the maximum value of ξ) is assumed to be zero. At any next time t, 0 < t < T0, the phase is defined as φ = t ∕ T0 (mod1). Since the rhythm is restored after the perturbation of the system, the introduced phase completely determines the state of the system.
Suppose that an external periodic perturbation acts on a nonlinear oscillator. Then each external influence shifts the state of the system to a new state (1):
φn+1 = φn + f (φn) (mod1). (1)
The function f (φn) is called the phase response curve (PRC) [25] and determines the phase change after the stimulus. It is convenient to represent the points f (φn) of the system state lying on the circle of the unit radius. Then, by iterating the mapping (1), one point of the circle is converted to another point of the same circle. If the circle map is continuous, then it can be characterized by a number called the topological degree and equal to the number of passes through φn+1 the unit circle during f (φn) the time it passes once. In periodic perturbations of self-oscillations with a stable limit cycle, the dynamics is often described by maps of a circle with a topological degree 0 (when the over-threshold response gives rise to a new cycle) or 1 (which expresses a sub-threshold response to stimulation). The different types of circle maps are shown in Fig.1.
Along with the topological degree, an important characteristic of the circle display is the number of rotations. We define it as the time average ratio of the external perturbation period to the period of the perturbed oscillator. If the rotation number is rational, ρ = M/N (here M is the number of cycles of the stimulator, and N is the number of cycles of the nonlinear oscillator), then the dynamics of the system will be periodic with the capture of the multiplicity phase N/M. If the rotation number is irrational, the system demonstrates quasi-periodic or chaotic behavior.
In many cases, the disturbance by a single pulse of a spontaneously oscillating system leads to a phase shift of the current rhythm (see, for example, [26] and references there). The magnitude of the shift depends on both the magnitude of the stimulus and its phase in the cycle. The graph of the dependence of the new phase on the previous phase (i.e., PRC) is either a continuous circle map with a topological degree of 1 or 0, or a discontinuous function. Phase shift experiments were performed for a large number of different systems. We are interested, first of all, in the phase response curve, experimentally obtained in the study of cardiac drug. In [27] the duration of the cycle of spontaneous oscillations of Purkinje fibers after stimulation by short pulses of electric current was measured. The obtained phase response curve of the Biphase form is shown in Fig.2. Based on the study of this experimental material, the following generalizations can be made [27].
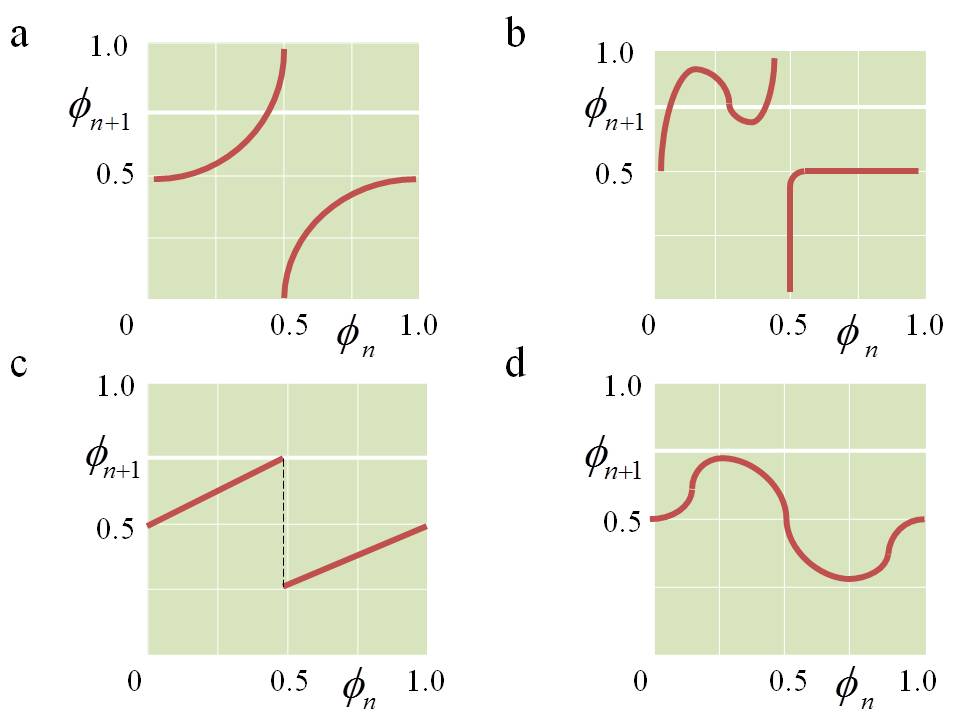
Fig.1. Different types of circle maps [25]: (a) reversible, topological degree 1; (b) irreversible, topological degree 1; (c) piecewise continuous; (d) topological degree 0.
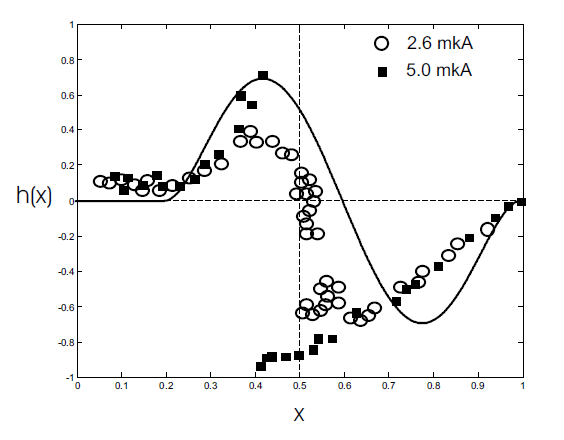
Fig.2. Phase response curve of cardiac tissue obtained experimentally [27]. The graph shows the dependence of the duration of the perturbed cycle (expressed in relative parts from the duration of the cycle in the control) on the phase of the cycle in which the pulse is applied.
After the disturbance, the rhythm is usually restored (after the transition process) with the same frequency and amplitude as before the disturbance, and its phase is shifted. Depending on the phase, a single stimulus can result in either an elongation (early stimulus) or a shortening (late stimulus) of the duration of the perturbed cycle. At some amplitudes of the stimulus, obvious discontinuities are observed. To further study the dynamics of any constructed model, it is necessary, having experimentally obtained PRC, to find a good analytical approximation of this curve. This will allow to investigate the main features of the behavior of the system. The main characteristic of the desired function is the need to directly depend on only two physical parameters: the amplitude of the stimulus and the phase of the applied perturbation. All other (so-called "internal") parameters describing the course of the curve should (ideally) be reduced to these two.
One of the simplest (and coarsest) approximations of a given PRC is the sinusoidal function, which ultimately results in a map of the form (2):
φn+1 = f (a,b,φn) = φn + a + b sin 2πφn (mod1). (2)
Where a and b are constants. However, despite its simplicity, this approximation correctly reflects the qualitative structure of the phase portrait of the system under study.

Fig.3. Schematic diagram of Arnold tongues. In shaded areas there is a steady phase capture. There are always other zones between any two capture zones.
The analysis of bifurcations of reversible circle maps was undertaken in the last century by A. Poincare and still attracts much -by V. I. Arnold [23] (see also [28] and the references given there). For fig.3 the bifurcation diagram of the circle diffeomorphism on the parameter plane (b, a) is shown. This diagram is divided into areas called language (or horns) of Arnold, which correspond to the sustainable capture phase ratio N/M (i.e., N cycles of the stimulator has M cycles of a nonlinear oscillator). Arnold languages exist for all rational relations N/M, where N and M are mutually Prime numbers. This means that there are an infinite number of Arnold languages that correspond to all possible ratios of frequencies of the stimulator and the perturbed oscillator. Between any two languages corresponding to N/M and N*/M* phase captures, there is another capture region corresponding to the capture of multiplicity phases (N+N*)/(M+M*). The structure shown in Fig.3, is the usual behavior for low stimulus amplitudes in simple theoretical models discussed below. However, as the amplitude of the periodic effect increases, this structure collapses.
2. Discrete models
In this section, we will consider two leading centers (AB the blockade of one of the leading centers) that can be pacemakers in the heart tissue, build a model of such interaction and investigate its behavior.
Phase diagrams for one-way interaction of pacemakers
First, let's consider the mapping (2) from the form (3):
xn+1 = xn + a + γh(xn) (mod1). (3)

Fig.4. a)Stable phase captures of multiplicity 1: k. b) The structure of some phase capture regions for piecewise linear mapping of the circle (a). Fig. 4. a)Stable phase captures of multiplicity 1: k. b) The structure of some phase capture regions for piecewise linear mapping of the circle (a).
We find the conditions for the existence of stable captures of phases of multiplicity 1:k of the mapping (3). Stable captures of 1:k of this mapping exist if (4)is fulfilled:

These analytically found captures are shown in Fig. 4a. The location of the phase capture regions in the parameter r space (α, γ), obtained as a result of a numerical (calculations were performed in Pascal) study of the system (3), is shown in Fig. 4b. Without limiting generality, we chose the interval of variation of the parameter α, which determines the ratio of periods, in the range from 1 to 2. Different colors correspond to different areas of phase capture of multiplicity N:M (for N cycles of an external stimulus, there are M cycles of a nonlinear oscillator). The dotted line indicates the value of γ = 1/4. A simple analysis of the system (3) shows that below the value of γ = 1/4, the mapping is monotonic (see below), the phase captures are separated from each other and are Arnold languages. Above the specified value, the picture becomes more complicated: the grips begin to overlap, which indicates the appearance of multistability. The mapping (3) is monotonic fi'(xn), i=1,2,3, are simultaneously positive or negative, i.e. the systems of inequalities (5) are fulfilled:

After their transformations and the exclusion of an incompatible system, we obtain conditions for the amplitude of the stimulus γ: -1/4 < γ < 1/4, i.e. below the line γ = 1/4, the mapping (3) is monotonic.
3. The sinusoidal model
As in the previous paragraph, we will consider the case of a one-way connection of oscillators: h(x)=sin(2πx).
4. Areas of phase capture in the one-way interaction of pacemakers, taking into account refractoriness
First, let us again consider the situation when a non-linear oscillator is affected by a constant external disturbance h(x)=sin(2πx). In this case, the display (2) will become the standard circle display. Let us consider the phase patterns of the display (2) when taking into account the refractoriness period. In the simplest case, the presence of a period of refractoriness can be expressed using such a parameter δ that if the stimulus falls within the interval [0; δ], then h (x)= 0. Let us assume, for example, δ=0.1 . The general structure of the phase capture regions obtained as a result of a numerical study of the system (6) is shown in Fig. 5a. Therefore:
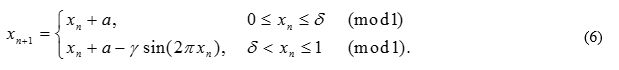
Note that with this account of refractoriness, the PRC becomes discontinuous (see Fig. 5b, red line).
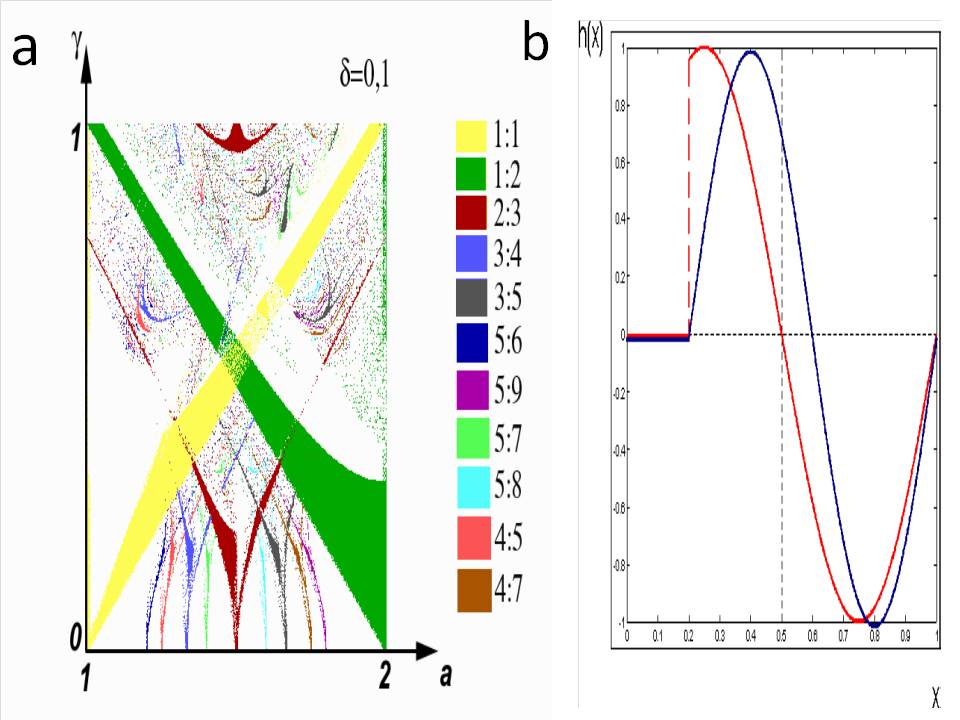
Fig.5. a) A phase diagram for the sine representation of a circle taking into account the refractoriness period (6). b) Sinusoidal approximations of the PRC: discontinuous, corresponding to the representation (6) (red); continuous, specifying the system (6) (blue).
5. Analogy with pathological heart rhythms
In conclusion of this section, we will draw an analogy between the results obtained and the pathological conditions of the heart tissue. Using the constructed models, it is possible, for example, to describe the interaction of the sine and ectopic pacemakers, ACS and AWU, and the effect of an external disturbance on the sine rhythm, shown in Fig. 6.
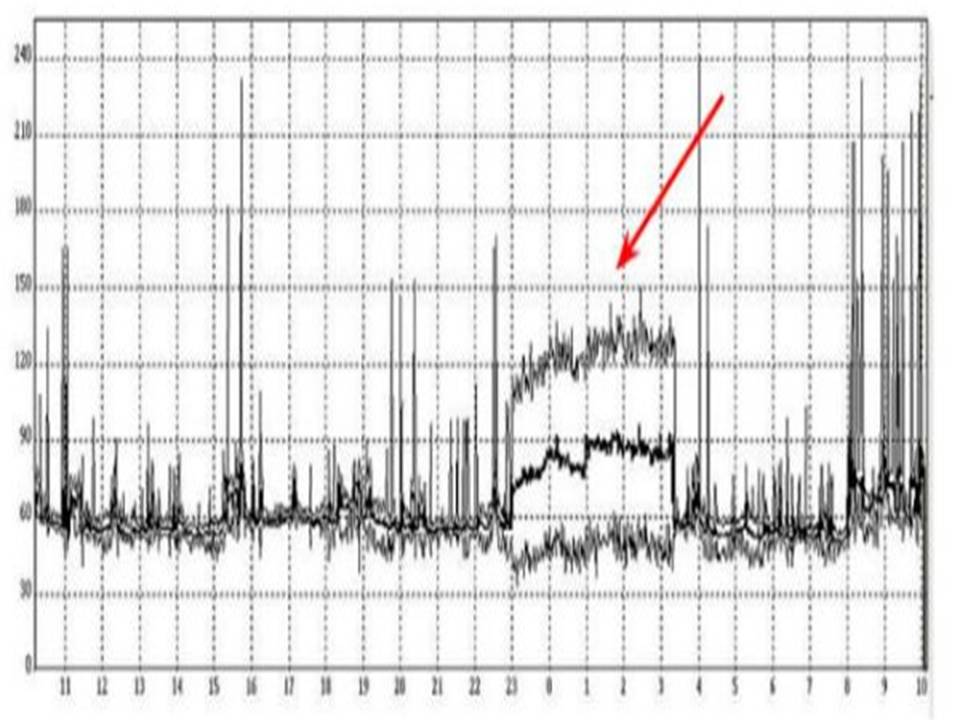
Fig.6. The model describes the interaction of sinus and ectopic pacemakers, ACS and AVU, and the effect of an external disturbance on the sinus rhythm with pathological conditions of the heart tissue.
If, for example, we consider the first pulse oscillator of the ACS, and the second-the AV, then we can find that some stable phase captures correspond to the pathologies observed in clinical practice. In this case, among the various constructed captures, there are both the normal sine rhythm (1:1 multiplicity capture) and the classical Wenckebach rhythms (N:(N-1) multiplicity captures) and N:1 AB-blockades. If the first pulse system is considered AV, and the second-SAU, then inverted Wenckebach rhyth ms appear (similar to direct ones, but in which the roles of the ventricles and atria change), observed in some patients. It should be noted that the considered response functions for various approximations of the form of the function h(x) are model functions. They were taken to analyze the characteristic features of the dynamics of two nonlinearly interacting oscillation sources. In practice, these functions must be selected taking into account additional physical assumptions about the nature of the interaction and take into account experimental data on the response of a separate oscillatory system to single pulses of external perturbation. For example, in [20], the effect of short pulses on aggregates of spontaneously oscillating cells from the embryo's heart was considered. The experimentally obtained phase response curves were investigated by exponential functions, and the "internal" parameters were chosen for reasons of the best correspondence of the curve graphs to the experimental points. Their dependence on physical parameters was also chosen in a similar way. As a result, the phase diagram obtained numerically corresponded quite well to the real dynamics of the system. Knowledge of such areas and the dynamics of the system in these areas allows you to remove the system from an undesirable synchronization mode to a more favorable mode by external perturbation (for example, by a series of single pulses), which is vitally important. We also note that the analysis of phase diagrams makes it possible to find ways to control such systems. For example, we can consider the effect of an additional periodic pulse action on the behavior of interacting oscillatory subsystems. The study of possible modes of behavior of such a system by varying the frequency and amplitude of an external disturbance will allow to bring its dynamics to a predetermined one, for example, to the complete suppression of the ectopic pacemaker by sine. This problem, considered in the next section, is very relevant for the general theory of control of nonlinear dynamical systems and excitable media, in particular, heart tissue, which is satisfactorily described by the models given in this paper (see also [54-55]). Fig.7 shows a real electrocardiogram of atrial fibrillation.

Fig.7. A. L. Myasnikov Institute of Cardiology, Moscow, patient: S. P. Balashova.
6. Relaxation model of Poincare oscillator
A widely used idealization of some periodically stimulated oscillators is the Gelfand and cetlin model [29], or the relaxation model [26,30-32]. In this model, the value referred to as activity increases to the upper threshold, leading to some event. Then the activity returns to the lower threshold. If the rates of rise and fall of activity to the thresholds are fixed, and the thresholds are also fixed, then a periodic sequence of events is generated, the frequency of which is easy to determine. Periodic perturbation in relaxation models can be included in the form of threshold modulation, usually sinusoidal.
In some works, instead of sinusoidal modulation of the threshold, other functions were considered, for example, Delta function peaks, rectangular and triangular pulses, etc. (see references in [33]). Arnold in [23] briefly discussed the possibility of using obtained model in the relaxation mapping to study the rhythms Wenkebach. Subsequent researchers found that piecewise linear monotone, discontinuous maps (Fig.1c), similar to those found in the relaxation model, appear in theoretical models of atrial-ventricular communication in AB blockade [34,35]. Such mappings can be experimentally measured and used to predict complex rhythms observed in humans [36].
Despite the wide application, the relaxation model too simplistically describes the interaction of the oscillator and the external perturbation; much more vital is the use of models that take into account the individual response of the system to the external perturbation. Cardiologists usually assume that the nonlinear ODE that contains oscillation with a stable limit cycle, represent a suitable model for the generation of periodic activity of the heart [37]. In the case where the limit cycle is quickly achieved after a single stimulus, and the action of a single stimulus is known, it is possible to calculate the effect of periodic stimulation. The prototype of the model with a periodically perturbed limit cycle is the van der Pol equation with a sinusoidal perturbation.
Consider the effect of a periodic sequence of short pulses on the oscillations described by a system with a limit cycle (see, for example, [33]). The simplest model is Poincare oscillator. In this model, a stable limit cycle is a circular trajectory. The perturbation is a horizontal displacement of magnitude b, and after stimulation, the system rapidly approaches the limit cycle along its radius.
If it is the phase φn immediately preceding the nth stimulus, then the phase preceding (n +1) the nth stimulus is simply φn+1 = τ + g(φn, b) (mod1).
Where τ is the time interval between periodic stimuli normalized for the eigenfrequency of the autogenerator, and PRC g(φ) is easily calculated [37-39].
This theoretical model for periodically perturbed limit cycles was independently proposed by several researchers [38-41]. Since for a simple model with a limit cycle RPC is calculated quite easily, it is possible to use analytical and numerical methods to determine the detailed structure of the phase capture zones as a function of the amplitude b and frequency a of the stimulus. In this example, for low stimulus amplitudes (b ≤ 1), the capture zone topology has a classical Arnold structure (Fig.3), and the circle display is a reversible degree 1 display. However, for b > 1, the dynamics is described by displaying a circle of zero topological degree. The extensions of Arnold's languages have a more complex form. There are bifurcations in the system, leading to doubling of the period and chaos.
This model, although different from the exact electrophysiological models, nevertheless, surprisingly well reproduces many features observed in experiments on the study of periodically perturbed aggregates of some heart cells [42]. For example, glass et al. observed period doubling bifurcations and chaotic dynamics in the stimulation of heart fiber aggregates at frequencies slightly lower than the internal frequency at moderate stimulus amplitude. The same behavior was observed in the Poincar \ ' e oscillator [38,39,41].
The study of periodic exposure to the limit cycle has a direct application to the study of ventricular, or ventricular parastole. If the ectopic beat occurs outside the period of ventricular refractoriness, it is observed on the electrocardiogram, and the next normal (sinus) beat is blocked. A similar model can be used to predict the sequences of sinus and ectopic beats in patients with ventricular parasistole (see, for example, [43-47]). In work [47] it is established that the model of pure parasistole (where sinus and ectopic pacemakers coexist without mutual influence on each other) corresponds well to reality.
However, the model of the perturbed cycle does not answer the question of what happens at large relaxation times to the limit cycle (this model is built on the assumption of a rapid return of the system to it, which allows only one phase variable to be taken into account in the calculations). In addition, it is not known what happens when the values of the parameters at which the existence of the limit cycle is controversial. Thus, it seems necessary to consider a model based on more General principles that take into account the change in the length of the perturbed cycle depending on the type of PRC without any additional conditions imposed on the behavior of the a priori system [48].

Open Access By Aditum Open Access Journals id licensed under Creative Commons Attribution 4.0 International License. Based On a Work at aditum.org