Clinical Cardiology Interventions
OPEN ACCESS | Volume 6 - Issue 1 - 2026
ISSN No: 2836-077X | Journal DOI: 10.61148/2836-077X/JCCI


S.M. DEBBAL *, L.Hamza Ch
Genie -Biomedical Laboratory (GBM), Department of electronic, Faculty of science engineering, university Aboubekr Belkaid, BP 119, Tlemcen 13000, Algeria
*Corresponding author: S.M. DEBBAL, Genie -Biomedical Laboratory (GBM), Department of electronic, Faculty of science engineering, university Aboubekr Belkaid, BP 119, Tlemcen 13000, Algeria.
*Corresponding author: S.M. DEBBAL, Genie -Biomedical Laboratory (GBM), Department of electronic, Faculty of science engineering, university Aboubekr Belkaid, BP 119, Tlemcen 13000, Algeria.
Received date: December 29, 2020
Accepted date: January 10, 2021
Published date: January 25, 2021
Citation: DEBBAL S.M, Hamza Ch. “Pathologies cardiac discrimination using the Fast Fourir Transform (FFT) The short time Fourier transforms (STFT) and the Wigner distribution”. J Cardiology Interventions, 1(1); DOI: http;//doi.org/03.2020/1.1004.
Copyright: © 2021 S.M. DEBBAL. This is an open access article distributed under the Creative Commons Attribution License, which permits unrestricted use, distribution, and reproduction in any medium, provided the original work is properly cited.
This paper is concerned with a synthesis study of the fast Fourier transform (FFT), the short time Fourier transform (STFT and the Wigner distribution (WD) in analysing the phonocardiogram signal (PCG) or heart cardiac sounds. The FFT (Fast Fourier Transform) can provide a basic understanding of the frequency contents of the heart sounds. The STFT is obtained by calculating the Fourier transform of a sliding windowed version of the time signal s(t). The location of the sliding window adds a time dimension and one gets a time-varying frequency analysis. the Wigner distribution (WD) and the corresponding WVD (Wigner Ville Distribution) have shown good performances in the analysis of non-stationary and quantitative measurements of the time-frequency PCG signal characteristics and consequently aid to. signals. It is shown that these transforms provides enough features of the PCG signals that will help clinics to obtain diagnosis. Similarly, it is shown that the frequency content of such a signal can be determined by the FFT without difficulties qualitative
1. Introduction
Heartbeat sound analysis by auscultation is still insufficient to diagnose some heart diseases. It does not enable the analyst to obtain both qualitative and quantitative characteristics of the phonocardiogram signals [1], [2]. Abnormal heartbeat sounds may contain, in addition to the first and second sounds, S1 and S2, murmurs and aberrations caused by different pathological conditions of the cardiovascular system [2]. Moreover, in studying the physical characteristics of heart sounds and human hearing, it is seen that the human ear is poorly suited for cardiac auscultation [3]. Therefore, clinic capabilities to diagnose heart sounds are limited.
The sound emitted by a human heart during a single cardiac cycle consist of two dominant events, known as the first heart sound S1 and the second heart sound S2 (Figure1),
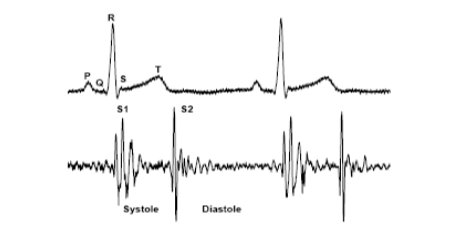
Figure1. Correlation between the phonocardiogram signal (PCG) and the electrocardiogram signal (ECG)
S1 relates to the closing of the mitral and tricuspid valves whilst S2 is generated by the halting of the aortic and pulmonary valves leaflets [1]. S1 corresponds in timing to the QRS complex in ECG (Electrocardiogram) and S2 follows the systolic pause in the normal cardiac cycle. Heartbeat sound analysis by auscultation only is still insufficient to diagnose some heart diseases. It does not enable the analyst to obtain both qualitative and quantitative characteristics of S1 and S2 of the phonocardiogram [1-2]. Moreover, in studying the physical characteristics of heart sounds and human hearing, it is seen that the human ear is poorly suited for cardiac auscultation [3]. Therefore, clinic capabilities to diagnose heart sounds are limited. In this paper we are interested in the study of the physical characteristics of the second heart sound S2 which consist of two major components in the spectrum of the signal . One of these components A2 is due to the closure of the aortic valve and the other P2 is due to the closure of the pulmonary valve.
Figure1
The aortic component is loudest than the pulmonic component. It is discernible at all the auscultation sites.It is best heard at the right base, with the diaphragm of the chest piece firmly pressed, whereas the pulmonic on a may only be audible at the left base, with the diaphragm of the chest piece firmly pressed.
The aortic component has higher frequency contents and generally precedes the pulmonary component because in normal heart activity the aortic valve closes before the pulmonary valve. The difference of time occurrence between these valves activities is known in medical community [4 - 6] as split. However in many diseases [1] this order of time occurrence may be reverse and its delay varies.
The characteristics of the PCG signal and other features such as heart sounds S1 and S2 location; the number of components for each sound; their frequency content; their time interval; all can be measured more accurately by digital signal processing techniques.
The FFT (Fast Fourier Transform) can provide a basic understanding of the frequency contents of the heart sounds. However, FFT analysis remains of limited values if the stationary assumption of the signal is violated. Since heart sounds exhibit marked changes with time and frequency, they are therefore classified as non - stationary signals. To understand the exact feature of such signals, it is thus important, to study their time – frequency characteristics.
In fact, the spectrogram (STFT) cannot track very sensitive sudden changes in the time direction. To deal with these time changes properly it is necessary to keep the length of the time window as short as possible. This, however, will reduce the frequency resolution in the time-frequency plane. Hence, there is a trade-off between time and frequency
Resolutions [6]. However, the Wigner distribution (WD) and the corresponding WVD (Wigner Ville Distribution) have shown good performances in the analysis of non-stationary signals. This comes from the ability of the WD to separate signals in both time and frequency directions. One advantage of the WD over the STFT is that it does not suffer from the time-frequency trade-off problem. On the other hand, the WD has a disadvantage since it shows cross-terms in its response. These cross-terms are due to the nonlinear behaviour of the WD and bear no physical meaning. One way to remove these cross-terms is by smoothing the time-frequency plane, but this will be at the expense of decreased resolution in both time and frequency [7].
The WD was applied to heart sound signal it shows no success in displaying or separating the signal components in both the time and frequency direction [6], although it provides high time-and frequency- resolution in simple monocomponent signal analysis [8]
2. Theoretical background
2.1 Fourier Transform (FT)
In 1882, Joseph Fourier discovered that any periodic function could be represented as an infinite sum of periodic complex exponential functions [9][10]. The inclusive property of only periodic functions was later extended to any discrete time function. The Fourier transform (FT) [as regular Fourier Transform] converts a signal expressed in the time domain to a signal expressed in the frequency domain. The FT is widely used and usually implemented in the form of FFT algorithm (fast Fourier transform). The mathematical definition of the FT is given below.
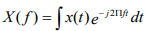 ------ 1
Where t and  are respectively the time and frequency parameters. The time domain signal is multiplied by a complex exponential at a frequency and integrate over all time. In other words, any discrete time signal may be represented by a sum of sines and cosines, which are shifted and are multiplied by a coefficient that changes their amplitude. are the Fourier coefficients which are large when a signal contains a frequency component around the frequency .
The peaks in a plot of the FT of a signal correspond to dominant frequency components of the signal. Fourier analysis is simply not effective when used on non-stationary signals because it does not provide frequency content information localized in time. Most real-world signals exhibit non stationary characteristics (such as heart sound signals). Thus, Fourier analysis is not adequate.
2.2 Short-time Fourier transform (STFT)
The STFT is obtained by calculating the Fourier transform of a sliding windowed version of the time signal s(t). The location of the sliding window adds a time dimension and one gets a time-varying frequency analysis.
The mathematical representation of STFT is :
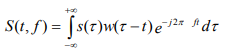 ------- 2
Where  it is the sliding window applied to the signal
 ,
, is the frequency and t is the time.
The length of the window is chosen so that to maintain signal stationary in order to calculate the Fourier transform. To reduce the effect of leakage (the effect of having finite duration), each sub-record is then multiplied by an appropriate window and then the Fourier transform is applied to each sub-record. As long as each sub-record does not contain rapid changes the spectrogram will give an excellent idea of how the spectral composition of the signal has changed during the whole time record. However, there exist many physical signals whose spectral content is so rapidly changing that finding an appropriate short-time window is problematic, since there may not be any time interval for which the signal is stationary. To deal with these time changes properly it is necessary to keep the length of the time window as short as possible. This, however, will reduce the frequency resolution in the time-frequency plane. Hence, there is a trade-off between time and frequency resolutions.
2.3 Wgner Distribution function (WD)
In contrast to the STFT, which is resolution limited either in time or in frequency (dictated by the window function), and suffers from smearing and side lobe leakage, the WD offers excellent resolution in both the frequency and time domains. The WD of two signals, x(t), y(t), is defined via,
 --------3
The auto WD is obtained when x(t) = y(t)=s(t), it is a bilinear function of the signal s(t). The WD, and can also be expressed as
 ---------------------4
Where t and are respectively, the time and frequency variables, and * denotes the complex conjugate.
The WD had shown good applications in the analysis of non-stationary signal [11-13]. This comes from the ability of this method to separate signals in both time and frequency directions. The WD has a disadvantage that it is limited by the appearance of cross-terms. These cross-terms are due to the nonlinear behaviour of the WD and bear no physical meaning. One way to remove these cross-terms is by smoothing the time-frequency plane [7], but this will be at the expense of decreased resolution in both time and frequency.
3. Results and discussion
3.1 Fast Fourier transforms application
An FFT algorithm is first applied to the PCG signal given in Figure1. The frequency spectrum illustrated in Figure 4a shows that the normal PCG signal has a frequency content varying from around 40Hz up to 200Hz. The FFT can be applied to the first part of this signal to analyse the frequency content of S1 as shown in Figure 4b and then to the second half to analyse the frequency content of S2 as shown in Figure4c. A 512 points FFT is applied to S1 and S2. At this stage the sound S1 or S2 cannot be separated.
In fact; the application of the FFT on heart sounds S1 and S2 after their separation or identification show that the basic frequency components are obviously detected by the Fourier transform.
The spectrum of S1 has reasonable values in the range 10-180Hz. The spectrum is distinctly resolved in time into two majors components (M1 and T1) while the most of the energy of these sounds appears to be concentrated.
The two components A2 (due to the closure of the aortic valve) and P2 due to the closure of the pulmonary valve) of the second sound S2 are obvious in Figure 4c. The spectrum of the sound S2 has reasonable values in the range 50-250Hz. The spectrum for this sound is distinctly resolved in time into two majors components (A2 and P2) as shown in Figure 4c.
However the FFT analysis of S2 cannot tell neither which of A2 and P2 precedes the other, nor the value of the time delay known as the “split” which separate them. For a normal heart activity usually A2 precedes P2 and the value of the split is lower than 30ms. This time delay between A2 and P2 is very important to detect some pathological cases. The sound S2 seem to have higher frequency content than that of S1 as shown in Figure4b and Figure4c.
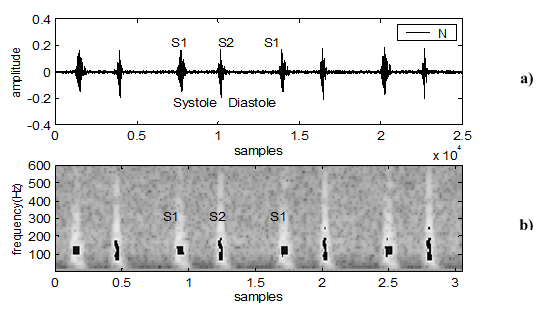
Figure 4: The STFT application of the normal PCG (N), a. the normal PCG signal (N), b. the spectrogram of the normal signal ( N)
The FFT is applied also to analyse fourth PCG signals one normal and three different marked pathological cases (the aortic-insufficiency, the aortic-stenosis and the mitral-stenosis). These are illustrated in Figure5 along with the normal PCG signal. The basic frequency content is obviously different from that of the normal PCG signal. It is clearly shown that there is great loss of frequency component in each of the pathological case with respect to normal case. In addition except the aortic- insufficiency case where we note the apparition of frequency component higher than 200Hz , the other cases (mitral-stenosis and aortic-stenosis) present a frequency spectrum limited to 200Hz.
The aortic-insufficiency and the aortic-stenosis are two pathological cases resulting from a severe organic attack, which generally involves a disappearance of the aortic component A2 of the sound S2. This shown in their corresponding PCG frequency responses illustrated in Figure5,
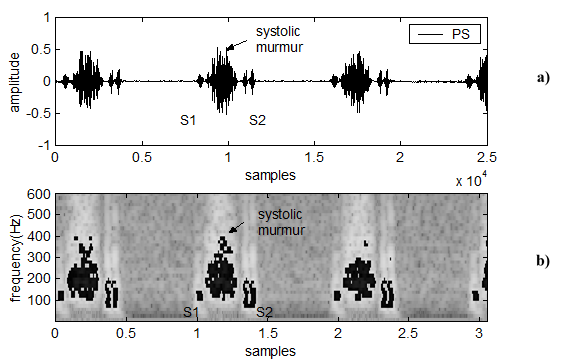
Figure 5: The STFT application of the pulmonary stenosis, a)The pulmonary stenosis signal (PS) b)The spectrogram of the signal PS
where we notice a lack in frequency contents in the range under 100Hz compared to the normal case, where there is much more frequency component in this range. On the other hand the mitral-stenosi is rather a severe attack of the mitral valves thus involving a presystolic reinforcement as well as a bursting of the sound S1.
As the frequency extent of the sound S1 is less important than that of the sound S2, the spectral response of the PCG signal related to this pathological case is not much affected compared to that of the normal case as was the case in the aortic -insufficiency and aortic-stenosis
In conclusion, and by applying the spectral analysis to different PCG signals, we can affirm which of the sounds S1 or S2 is directly concerned by the pathology, and more precisely which component of these sounds is affected.
With regard to normal PCG the basic frequency components are obviously detected by the FFT but not the time delay between these components. In fact as it was shown for example in Figure4c, the components A2 and P2 of the second sound S2 are obvious. However the FFT analysis of S2 cannot tell what is the value of the time delay between A2 and P2. It is thus essential to look for a transform which will describe a kind of “time-varying” spectrum.
Figure4-Figure5
3.2 Short-time Fourier transforms application
The normal phonocardiogram signal (Figure 6a) and the coarctation of the aorta (Figure 6a) are analyzed in this section. The coarctation of the aorta has been deliberately chosen here to evaluate the performance of the STFT analysis for it is very similar to the normal case. Figures 6a illustrate thus such a signal where we can notice that the temporal representation is almost similar to that of normal case given in Figure 6a.

Figure 6: The STFT application of the aortic of the regurgitation, a)The aortic of the regurgitation signal (AR), b)The spectrogram of the signal AR
Figure 6b and Figure 7b provide respectively the STFT application of the normal and the CA case. From these Figures we can see the difference of the time-frequency features between them. For the two cases (N and CA), the second sound (S2) is shown to have higher frequency content than of the first sound (S1) [14, 15]. This expected since the amount of blood present in the cardiac chambers is smaller [16[[17].
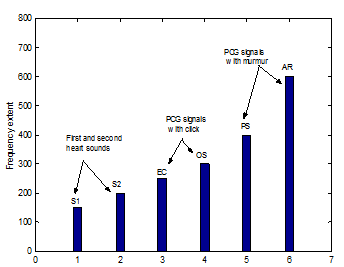
Figure 7: Frequency extent of the three Groups of the PCG signals
We consider here two examples of the phonocardiogram signals with murmur: the pulmonary stenosis (PS: Figure 8a) with a systolic murmur and the aortic regurgitation (AR: Figure 9a) with a diastolic murmur.
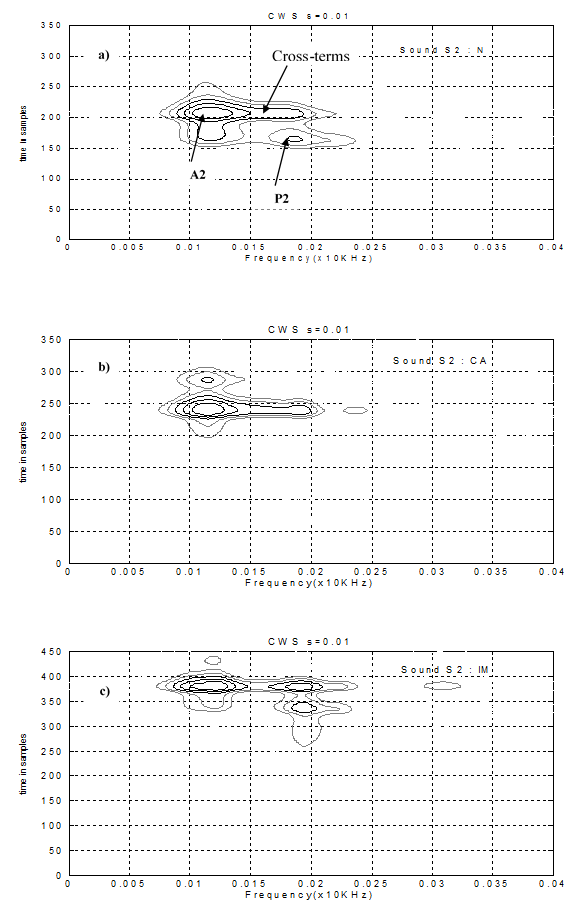
Figure 8: The wigner distribution of the second cardiac sound S2 : a) the normal case , b) the coarctation of the aorta case (CA), c) the innocent murmur case (IM)
Figure 8b and Figure 9b shows respectively the STFT application of the PS and AR signals. We can notice that the frequency extent of the diastolic murmur of the AR case is highly (About 600Hz) than the systolic murmur of the PS case (about 400 Hz).
Figure 8 – Figure 9
In this section we presents the experimental results of the short-time frequency transform application of the three followings groups of the PCG signals used.
Group 1: normal (N) or similar morphological signal (CA) ;
Group 2: opening snap (OS) and ejection click (EC);
Group 3: PCG signal with width murmur (PS and AR).
Figure 10 provides a better representation of the results obtained concerning the frequency contents of the sounds and murmurs analysed. If under the normal conditions (N) or in the presence of similar signals (CA) the frequency content of the sound S2 is more significant than that of the sound S1.
We noted that the light murmurs (OS, EC.) can influence the time-frequency content of the principal sounds S1 and S2 and have a frequency extent more significant than them.
Finally, in fact the width murmurs (PS and AR cases) present a frequency extent very significant. Discrimination between the systolic and diastolic murmurs can be made starting from this frequency extent, diastolic murmurs thus having a frequency extent more significant than the systolic murmurs. In more these murmurs seem not too much not to affect the time-frequency content of the sounds S1 and S2
Figure10
3.3 Wigner distribution application
Figure11 shows the WD application of the cardiac sound of the normal case (11a), the coarctation of the aorta (11b) and the innocent murmur (11c). One can notice here that the two principal components (A2 and P2) start to appear in the presence cross-terms. The WD results may be improved by increasing the sampling rate of original signal, but it still suffers from the cross-terms problem because of the nonlinearity of the WD.
However, the Wigner distribution (WD) has shown good performances in the analysis of non-stationary signals. This comes from the ability of the WD to separate signals in both time and frequency directions. One advantage of the WD over the STFT is that it does not suffer from the time-frequency trade-off problem. On the other hand, the WD has a disadvantage since it shows cross-terms in its response. These cross-terms are due to the nonlinear behaviour of the WD and bear no physical meaning. One way to remove these cross-terms is by smoothing the time-frequency plane, but this will be at the expense of decreased resolution in both time and frequency
Figure 11
4. Conclusion
The cardiac (heartbeat sound) cycle of phonocardiogram (PCG) is characterized by transients and fast changes in frequency as time progresses. It was shown that basic frequency content of PCG signal can be easily provided using FFT technique. However, time duration and transient variation cannot be resolved; the CWT wavelet transform therefore i is a suitable technique to analyse such a signal. It was also shown that the coefficients of the continuous wavelet transform give a graphic representation that provides a quantitative analysis simultaneously in time and frequency. It is therefore very helpful in extracting clinically useful information.
The measurement of the time difference between the A2 and P2 components in the sound S2, the number of major components of the sounds S1 and S2 and the frequency range and duration for all these components and sounds can be accurately achieved for the CWT simultaneously as was clearly illustrated.
It is found that the wavelets transform is capable of detecting the four major components of the first sound S1 and the two components (the aortic valve component A2 and the pulmonary valve component P2) of the second sound S2 of a normal PCG signal . These components are not accurately detectable using the STFT or WD. However the standard FFT can display the frequencies of the components A2 and P2 but cannot display the time delay between them.
The application of the STFT in the analysis of the PCG signals made it possible to obtain appreciable information on the time-frequency content of the sounds S1, S2 and of the added murmurs (OS,EC or width murmurs).
If under the normal conditions (N) or in the presence of similar signals (CA) the frequency content of the sound S2 is more significant than that of the sound S1. We noted that the light murmurs (OS, EC.) can influence the time-frequency content of the principal sounds S1 and S2 and have a frequency extent more significant than them.
Finally in fact the width murmurs (PS and AR cases) present a frequency extent very significant. Discrimination between the systolic and diastolic murmurs can be made starting from this frequency extent, diastolic murmurs thus having a frequency extent more significant than the systolic murmurs. In more these murmurs seem not too much not to affect the time-frequency content of the sounds S1 and S2.
The two version of analysis of the wavelet transform (DWT and PWT) make it possible to gather time-frequency information concerning the characteristics of the cardiac sounds.
It is shown that the FFFT, the STFT, the WD and the WT techniques provides more information of the PCG signals with murmurs that will help physicians to obtain qualitative and quantitative measurements of the time and the time-frequency PCG signal characteristics and consequently aid to diagnosis.


Open Access By Aditum Open Access Journals id licensed under Creative Commons Attribution 4.0 International License. Based On a Work at aditum.org