Clinical Cardiology Interventions
OPEN ACCESS | Volume 6 - Issue 1 - 2026
ISSN No: 2836-077X | Journal DOI: 10.61148/2836-077X/JCCI


S.M. DEBBAL *, L.Hamza Ch
Genie -Biomedical Laboratory (GBM), Department of electronic, Faculty of science engineering, university Aboubekr Belkaid, BP 119, Tlemcen 13000, Algeria
*Corresponding author: S.M. DEBBAL, Genie -Biomedical Laboratory (GBM), Department of electronic, Faculty of science engineering, university Aboubekr Belkaid, BP 119, Tlemcen 13000, Algeria.
*Corresponding author: S.M. DEBBAL, Genie -Biomedical Laboratory (GBM), Department of electronic, Faculty of science engineering, university Aboubekr Belkaid, BP 119, Tlemcen 13000, Algeria.
Received date: December 29, 2020
Accepted date: January 10, 2021
Published date: January 25, 2021
Citation: DEBBAL S.M, Hamza Ch. “Heart Sounds analysis using the Three Wavelet Transform Versions the Continuous Wavelet Transform (CWT), The Discrete Wavelet Transform (DWT) and the Wavelet Packet Transforms (PWT)”. J Cardiology Interventions, 1(1); DOI: http;//doi.org/03.2020/1.1003.
Copyright: © 2021 S.M. DEBBAL. This is an open access article distributed under the Creative Commons Attribution License, which permits unrestricted use, distribution, and reproduction in any medium, provided the original work is properly cited.
Heart murmurs are the first signs of cardiac valve disorders. Indeed, heart auscultation has been recognized for a long time as an important tool for the diagnosis of heart disease; it is the most common and widely recommended method to screen for structural abnormalities of the cardiovascular system. Detecting relevant characteristics and forming a diagnosis based on the sounds heard through a stethoscope, however, is a skill that can take years to be acquired and refine. The efficiency and accuracy of diagnosis based on heart sound auscultation can be improved considerably by using digital signal processing techniques to analyze the pathological phonocardiogram (PCG) signals.This paper is concerned with a synthesis study of the three wavelet transform version :The continuous wavelet transform (CWT), The discrete wavelet transform (DWT) and the wavelet packet transforms (PWT) in analysing the phonocardiogram signal (PCG). It is shown that these transforms provide enough features of the PCG signals that will help clinics to obtain qualitative and quantitative measurements of the time-frequency PCG signal characteristics and consequently aid to diagnosis.
1. Introduction
Heartbeat sound analysis by auscultation is still insufficient to diagnose some heart diseases. It does not enable the analyst to obtain both qualitative and quantitative characteristics of the phonocardiogram signals [1], [2]. Abnormal heartbeat sounds may contain, in addition to the first and second sounds, S1 and S2, murmurs and aberrations caused by different pathological conditions of the cardiovascular system [2]. Moreover, in studying the physical characteristics of heart sounds and human hearing, it is seen that the human ear is poorly suited for cardiac auscultation [3]. Therefore, clinic capabilities to diagnose heart sounds are limited.
The sound emitted by a human heart during a single cardiac cycle consist of two dominant events, known as the first heart sound S1 and the second heart sound S2 (Figure1), S1 relates to the closing of the mitral and tricuspid valves whilst S2 is generated by the halting of the aortic and pulmonary valves leaflets [1]. S1 corresponds in timing to the QRS complex in ECG (Electrocardiogram) and S2 follows the systolic pause in the normal cardiac cycle. Heartbeat sound analysis by auscultation only is still insufficient to diagnose some heart diseases. It does not enable the analyst to obtain both qualitative and quantitative characteristics of S1 and S2 of the phonocardiogram [1-2]. Moreover, in studying the physical characteristics of heart sounds and human hearing, it is seen that the human ear is poorly suited for cardiac auscultation [3].
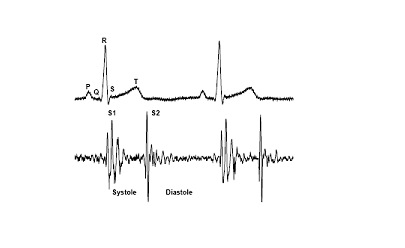
Figure1. Correlation between the phonocardiogram signal (PCG) and the electrocardiogram signal (ECG)
Figure1
The aortic component is loudest than the pulmonic component. It is discernible at all the auscultation sites.It is best heard at the right base, with the diaphragm of the chest piece firmly pressed, whereas the pulmonic on a may only
be audible at the left base, with the diaphragm of the chest piece firmly pressed.
The aortic component has higher frequency contents and generally precedes the pulmonary component because in normal heart activity the aortic valve closes before the pulmonary valve. The difference of time occurrence between these valves activities is known in medical community [4 - 6] as split.
However, in many diseases [1] this order of time occurrence may be reverse and its delay
varies. The characteristics of the PCG signal and other features such as heart sounds S1 and S2 location ; the number of components for each sound; their frequency content; their time interval; all can be measured more accurately by digital signal processing techniques.
The FFT (Fast Fourier Transform) can provide a basic understanding of the frequency contents of the heart sounds. However, FFT analysis remains of limited values if the stationary assumption of the signal is violated. Since heart sounds exhibit marked changes with time and frequency, they are therefore classified as non - stationary signals. To understand the exact feature of such signals, it is thus important, to study their time – frequency characteristics.
In this paper the wavelet transform is used to analyse both the normal and pathological abnormal heart sound in both time and frequency domains. This technique has been shown to have a very good time resolution for high-frequency components. In fact, the time resolution increases as the frequency increases and the frequency resolution increases as the frequency decreases [4],[5].
Furthermore, the wavelet transform has demonstrated the ability to analyse the heart sound more accurately than other techniques STFT or Wigner distribution [6] in some pathological cases.
In fact, the spectrogram (STFT) cannot track very sensitive sudden changes in the time direction. To deal with these time changes properly it is necessary to keep the length of the time window as short as possible. This, however, will reduce the frequency resolution in the time-frequency plane. Hence, there is a trade-off between time and frequency resolutions [6].
However the Wigner distribution (WD) and the corresponding WVD (Wigner Ville Distribution) have shown good performances in the analysis of non-stationary signals. This comes from the ability of the WD to separate signals in both time and frequency directions. One advantage of the WD over the STFT is that it does not suffer from the time-frequency trade-off problem. On the other hand, the WD has a disadvantage since it shows cross-terms in its response. These cross-terms are due to the nonlinear behaviour of the WD and bear no physical meaning. One way to remove these cross-terms is by smoothing the time-frequency plane, but this will be at the expense of decreased resolution in both time and frequency [7].
The WD was applied to heart sound signal it shows no succes in displaying or separating the signal components in both the time and frequency direction [6], although it provides high time-and frequency- resolution in simple monocomponent signal analysis [8] [9].
To overcome these difficulties with the STFT and the WD an alternative way to analyse the non-stationary signals is the wavelet transform (WT). The wavelet Transform is a technique in the domain of time-frequency distributions. The representation timescale of WT based on a dyadic paving appears more flexible. It a mathematical structure governed by a formula of exact inversion [10] making possible the existence of orthonormal basis. This makes the wavelet to be a simultaneous function of time and frequency.
This paper is concerned with a synthesis study of the three wavelet transform version: The continuous wavelet transform (CWT), the discrete wavelet transform (DWT) and the wavelet packet transforms (PWT) in analysing the phonocardiogram signal (PCG). It is shown that these transforms provide enough features of the PCG signals that will help clinics to obtain qualitative and quantitative measurements of the time- frequency PCG signal characteristics and consequently aid to diagnosis.
2. Theoretical background
2.1 Continuous Wavelet Transform (CWT)
The continuous wavelet transform was developed as a method to obtain simultaneous, high resolution time and frequency information about a signal. The term ‘wavelet’ was first mentioned in 1909 in a thesis by Alfred Haar [M.Misiti.Y.Misiti.G.Oppenheim.J.-M.Poggi.Wavelet Toolbox:For use with MATLAB.The Math Works Inc.1996], although the progress in the field of wavelet has been relatively slow until the 1980’s when scientist and engineers from different fields realized they were working on the same concept and began collaborating .
The CWT rather than the STFT uses a variable sized window region .Because the wavelet may be dilated or compressed, different features of the signal are extracted. While a narrow wavelet extracts high frequency components, a stretched wavelet picks up on the lower frequency components of the signal.
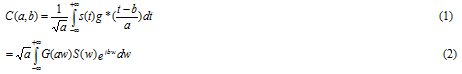
The CWT is computed by correlating the signal s (t) with families of time-frequency atoms g(t), it produce a set of coefficients C(a,b) given by :
Where

The analyzing wavelet function g(t) should satisfy some properties. The most important ones are continuity, integrability, square integrability, progressivity and it has no d.c component. Moreover, the wavelet g(t) has to be concentrated in both time and frequency as much as possible. It is well known that the smallest time-bandwidth product is achieved by the Gaussian function [3]. Hence the most suitable analyzing wavelet for time-frequency analysis is the complex exponential modulated Gaussian function of the form:
When e is a small correction term, theoretically necessary to satisfy the admissibility conditions of wavelets;  is chosen large enough so that the correction term is negligible and can be ignored.
This is known as the Gabor wavelet. It was shown [5] that 5.33, which is enough to make the correction term negligible and gives an optimal time-bandwidth product.
In a continuous wavelet transform, the wavelet corresponding to the scale and the time location b is given by

Where g(t) is the wavelet “prototype” or mother which can be thought of as a band pass function. The factor is used to ensure energy preservation [5].

with j,k ÎZ
The wavelets are in this case:

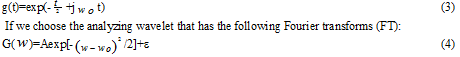
The discrete wavelet transforms (DWT) has been recognized as a natural wavelet transform for discrete-time signals. Both the time and time-scale parameters are discrete. The discretization process partially depends upon the algorithm chosen to perform the transformation. The Figure2
Figure2: a) Exemple of the discrete wavelet decompostion for three levels b) Filter banks of the decomposition of each level
shows the discrete wavelet decomposition on three levels, as well as the note associated filter bank for each level. We note that the width of the filter banks band-pass is veritable according to the decomposition level. The wavelet analysis permits to decompose the phonocardiogram signal in filter banks. The signal to be analyzed is decomposed in approximation an in detail while using two filter h and g.
Figure2-Figure3
2.3 Wavelet packet transforms (WPT)
Wavelet packet analysis is an extension of the discrete wavelet transform (DWT) and it turns out that the DWT is only one of the much possible decomposition that could be performed on the signal. Instead of just decomposing the low frequency component, it is therefore possible to subdivide the whole time-frequency plane into different time-frequency pieces as can be seen from. The advantage of wavelet packet analysis is that it is possible to combine the different levels of decomposition in order to achieve the optimum time-frequency representation of the original [13].
To obtain a uniform filter bank we will use the wavelet packet analysis which is a generalization of the discrete wavelet transform analysis. The decomposition is also made of the details signal "D". Figure3 shows the wavelet packet decomposition on three levels as well as the filter banks associated for each uniform level.

Figure3: a) Exemple of the packet wavelet decompostion for three levels b) Filter banks of the decomposition of each level
3. Results and discussion
3.1 Continuous wavelet transforms application
An algorithm under MATLAB environnement of the Continuous Wavelet Transform is developed then applied to analyse the different PCG signals. First the normal PCG is studied as illustrated by Figure 5.a.
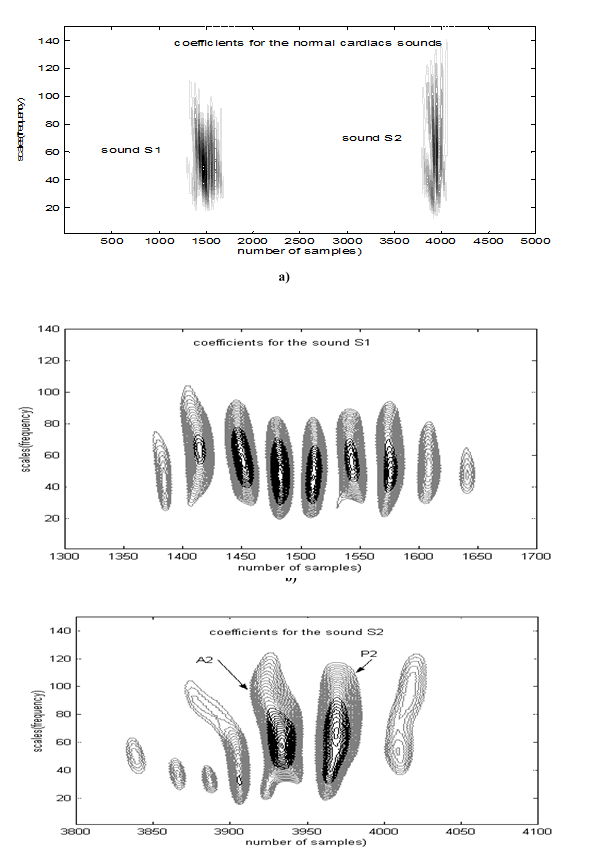
The two heart sounds are clearly shown in dark colour. They are spaced with 2500 samples corresponding to 0.312 seconds. The continuous wavelet transforms of S1 and S2 are also displayed separately in Figure4.b

Figure 4: Frequency extent of the three Groups of the PCG signals
Figure 5.c respectively. The sound S2 is shown to have higher frequency content than that of the S1. This is expected since the amount of blood present in the cardiac chambers is smaller [1], [13].
On Figure 5b we can see that S1 is clearly resolved in two major components (M1 and T1). The wavelet transform allows measurement and determination of this time difference, and thus allows a diagnosis process regarding this important parameter to be produced.
Moreover, the ability of the wavelet transform in heart disease diagnosis can be studied by applying the CWT algorithm on different marked cases. The result of this application are illustrated in Figure6b (aortic-insufficiency), Figure 6c (aortic-stenosis) Figure 6d (mitral-stenosis). The coefficients of the CWT allow us to clearly discern the frequency range of each signal. It also shows the major components according to the temporary variation; the maximal amplitude is characterized by a darker color than those of the small amplitude
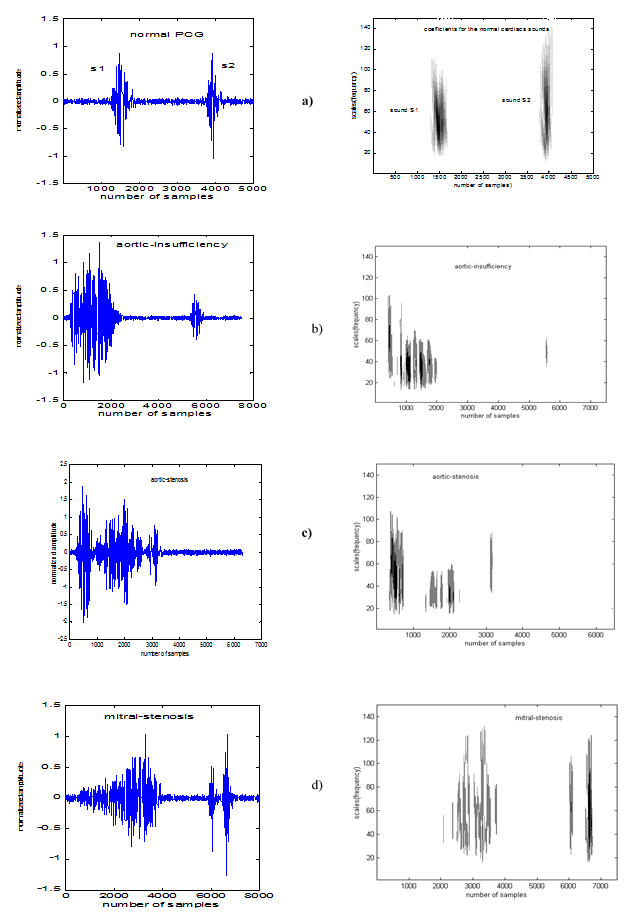
Figure 5. Continuous wavelet transform analysis (CWT) for the normal cardiac sounds S1 and S2
Figure5-Figure6
3.2 Discrete wavelet transforms application
The multiresolution analysis based on the discrete wavelet transform (DWT) is a powerful tool in and filtering, separating and identification of the internal components and murmurs of the various analyzed signals (Figure7).
Figure15a shows the application of the discrete wavelet transform of one cycle of the normal PCG. Levels d1 and d2 represent the high frequency variations of the base line of PCG signal. Levels d3 and d4 emphasize clearly the side of high frequency content of the sound S2 compared to S1The component A2 (the most predominant in sound S2) appears better on levels d5 and d6. Level d7 represents the two principal components of the sound S1 (M1, T1).
The same analysis by using the discrete wavelet transform concerning the coarctation of the aorta and the mitral stenosis is also applied (Figures8b and Figure8c). Figure 8b, in level d7, provide a well representation of the third component "C" added a the two majors components of the sound S2 (A2 and P2).
Figure 7 – Figure 8
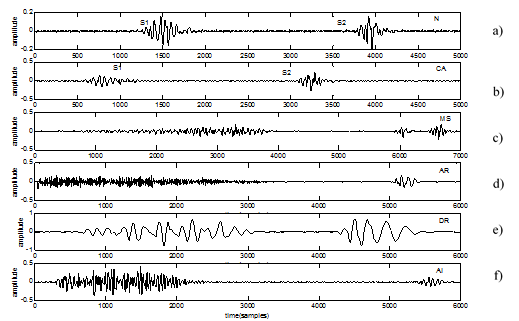
Figure 7: PCG signals used a) normal (N), b) the coarctation of the aorta (CA) c) the mitral stenosis (MS) , d) the aortic regurgitation (AR), e) the diastolic ruble (DR) , f) the aortic insufficiency (AI)-
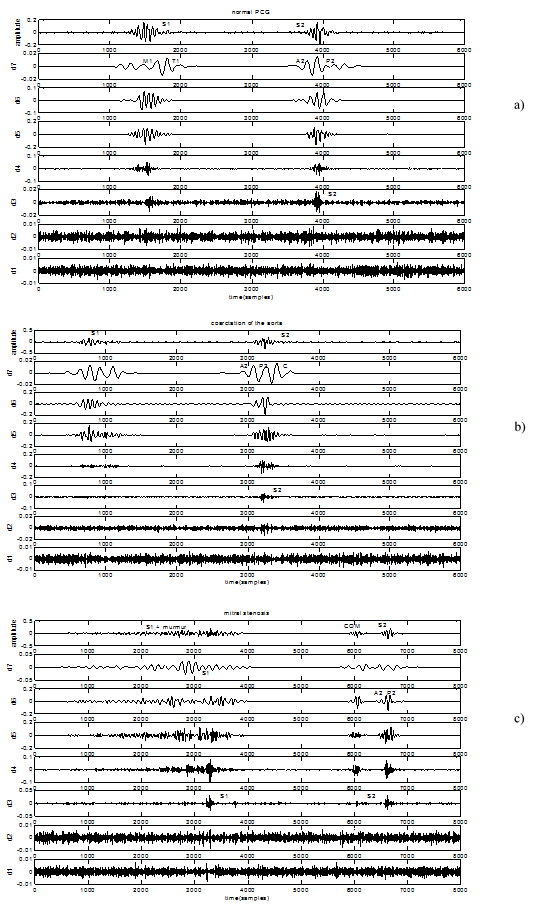
Figure8: Discrete wavelet transforms (DWT) analysis for a) the normal PCG , b) the Coarctation of the aorta , c) the mitral stenosis
3.3 Packet wavelet transforms application
The used of the wavelet packet transform is exactly the same as those developed in the discrete wavelet transform. The only difference is that wavelet packets offer a more complex and flexible analysis, because in wavelet packet analysis, the details as well as the approximations are split (Figure3). Single wavelet packet decomposition gives a lot of bases from which you can look for the best representation with respect to a design objective. The wavelet packet method is thus a generalization of wavelet decomposition that offers a richer range of possibilities for signal analysis. In wavelet analysis, a signal is split into an approximation and a detail. The approximation is then itself split into a second-level approximation and detail, and the process is repeated.
The wavelet packet transforms analysis in this paper give important features of the extent frequency of the heart sounds (S1 or S2) and cardiac murmur. These features can be help clinician in their diagnosis or recognizing pathological conditions concerning the recording PCG signals.
Figure 16 provide a time frequency (TF) representation of one cardiac cycle of the heart sounds concerning the normal PCG signal (Figure 9a), the coarctation of the aorta case (Figure 9b) and the mitral stenosis case (Figure 9c). These figures shown the frequency range of each component or murmur of the PCG signal studied. Thus, we can observe the component "C" added of the two major’s component for the sound S2 (A2 and P2). The same result has
Figure 10 has the advantage of presenting at the same time the frequency extent of the various components of the cardiac sound like their frequency site one compared to the other . We can shown clearly that the Diastolic ruble (DR) case have high frequency content that the aortic insufficiency case (AI) or the aortic regurgitation case (AR).

Figure 10 : Wavelet packet Transform (WPT) analysis for a) the aortic Insufficiency (Ai) , b) the aortic regurgitation (AR) , c) the Diastolic Rumble

Figure9: Wavelet packet transform (WPT) analysis for a) the normal PCG , b) the coarctation of the aorta , c) the mitral stenosis
Figure 9 -Figure10
4. Conclusion
The cardiac (heartbeat sound) cycle of phonocardiogram (PCG) is characterized by transients and fast changes in frequency as time progresses.
It is found that the wavelets transform is capable of detecting the four major components of the first sound S1 and the two components (the aortic valve component A2 and the pulmonary valve component P2) of the second sound S2 of a normal PCG signal.
The three version of analysis of the wavelet transform ( CWT, DWT and PWT) make it possible to gather time-frequency information concerning the characteristics of the cardiac sounds.
It is shown that the WT techniques provides more information of the PCG signals with murmurs that will help physicians to obtain qualitative and quantitative measurements of the time and the time-frequency PCG signal characteristics and consequently aid to diagnosis.


Open Access By Aditum Open Access Journals id licensed under Creative Commons Attribution 4.0 International License. Based On a Work at aditum.org