Clinical Cardiology Interventions
OPEN ACCESS | Volume 6 - Issue 1 - 2026
ISSN No: 2836-077X | Journal DOI: 10.61148/2836-077X/JCCI


Divij Khetan 1, Deepak Agrawal 2*, Anil Kumar Gupta 3
1MBBS, MD (General Medicine), DM Cardiology, Consultant and Head, Department of Cardiology, Khetan hospital, Jaipur
2MBBS, MD (General Medicine), DNB Cardiology, Chief Interventional Cardiologist, Swastik multispecialty hospital, Dudu, Jaipur
3MBBS, MD (General Medicine), DM Cardiology, Consultant Cardiologist, Amar medical and research centrer, Jaipur
*Corresponding Author: Deepak Agrawal, MBBS, MD (General Medicine), DNB Cardiology, Chief Interventional Cardiologist, Swastik multispecialty hospital, Dudu, Jaipur
Received date: June 06, 2021
Accepted date: June 15, 2021
published date: June 23, 2021
Citation: Khetan D, Agrawal D, Anil K Gupta. (2021) “Comparative study of QT, QT Dispersion, and T-Wave Peak to End Time Changes After Thrombolysis and Primary Percutaneous Coronary Intervention in Patients Presenting with Acute ST-Elevation Myocardial Infarction.” J Clinical Cardiology Interventions, 2(3); DOI: http;//doi.org/04.2021/1.1018
Copyright: © 2021 Deepak Agrawal. This is an open access article distributed under the Creative Commons Attribution License, which permits unrestricted use, distribution, and reproduction in any medium, provided the original work is properly cited
Background: QT dispersion (maximum QT interval minus minimum QT interval) was originally proposed as an index of the spatial dispersion of ventricular recovery times.
Aim of the Study: To compare QTc, QTd, and TPe in thrombolytic versus percutaneous coronary intervention therapies in patients with acute STEMI and evaluate the effect on electrocardiographic QT interval, corrected QT interval, QT dispersion and TPE with implications of such assessment for prediction of ventricular arrhythmias.
Methods: The study was conducted on 100 patients presented with acute STEMI. Patients were divided into two groups. First group included 50 patients treated with thrombolytic therapy. Second group included another 50 patients treated with PCI. QT intervals of the studied patients were manually calculated at admission (before treatment) and in 24 hours (after treatment).
Results: Most patients studied were males, diabetic, hypertensive and smoker. Mean age of male patient was 57.1±8.3 years & for female was 55.6±4.6 years. Patients with anterior STEMI were more than inferior STEMI. There was a significant reduction in QTmax(p<0.02), QTc(p<0.001), QTd(p<.001) and TPe(p<.001) before and after reperfusion regardless of reperfusion strategy. There was significant reduction in QTmax(p<.001), QTmin(p<.03) and TPe(p<.001) but non- significant reduction in QTc(p<0.13) and QTd(p<.024) before and after thrombolysis.
There was a significant reduction in QTc (p<.02), QTd(p<.001) and TPe(p<.001) before and after PCI. Our study revealed higher significant reduction in QTmax(p<.001), QTc(p<.001), QTd(p<.006), TPe(p<.008) after PCI therapies than after thrombolytic therapies.
There were non-significant differences in Intervals, QTc and dispersions before reperfusion according to site of infarct. There were non-significant differences in QT, QTc and dispersions after reperfusion according to site of infarct.
Conclusion: Primary PCI is associated with higher significant reduction in QT intervals, QTc and dispersion than thrombolytic therapy. Our study showed that primary PCI was effective in reducing the degree of arrhythmogenic indices such as QTd and TPe and may be used as markers for successful reperfusion.
Introduction:
Coronary Artery Disease (CAD) is a chronic disease with symptoms that require ongoing monitoring and treatment to prevent further complications such as myocardial infarction and heart failure. [1]
The Electrocardiogram (ECG) is a necessary tool for diagnosis of myocardial infarction and cardiac arrhythmia. The QT interval reflects the duration of ventricular electrical activity determined by the phases of depolarization and repolarization. It is proposed that the different ECG leads magnify the ECG signal of different myocardial regions. Consequently, QT dispersion (QTd), the maximum variation in the QT interval in 12-lead ECG, reflects inhomogeneity of ventricular repolarization [2] and spatial dispersion of ventricular recovery time. QTd is a crude and approximate measure of a general abnormality of repolarization. [3] This measurement was an attempt to distinguish between myocardium that is homogeneous from myocardium that displays inhomogeneity, which is accompanied by increased dispersion of the ventricular recovery times and prolongation of repolarization.
An accurate assessment of QT dispersion requires all 12 leads of the ECG to be recorded simultaneously in order to avoid the effect of heart rate changes on QT dynamics. As a result, simultaneous 12-lead recordings have been proposed as the gold standard for the measurement of QT dispersion. [4] Since rate-related changes in the QT interval develop slowly, QT dispersion measurements based upon simultaneous recording of six or even only three QRS complexes during ectopic-free sinus rhythm is acceptable for practical purposes. [5]
QTd has been shown to correlate with increased arrhythmic vulnerability in various types of cardiac diseases, such as coronary artery disease, long QT syndrome, and congestive heart failure. It is also considered a predictor of ischemic cardiac events and sudden cardiac death. [6] In addition, QTd before percutaneous coronary intervention (PCI) has been associated with an increased risk of major adverse cardiac event (MACE) and mortality in acute ST-elevation myocardial infarction (STEMI).
A T-wave on surface ECG is a representative of voltage gradient between subendocardial and sub epicardial region [7,8]. In addition to QTd, some studies used T-wave peak to end (TPE) [9] to evaluate repolarization inhomogeneity, where the peak of the T-wave coincides with the end of epicardial repolarization while the end of the T-wave indicates the end of repolarization of the whole ventricular myocardium.
Thrombolytic therapy has been a major advance in the management of acute myocardial infarction. Thrombolytic therapy works by lysing infarct artery thrombi and achieving reperfusion, thereby reducing infarct size, preserving left ventricular function, and improving survival.
Ischemia can increase QT dispersion and TPE. Percutaneous Coronary Intervention (PCI) is widely used to manage ischemia in patients with coronary artery disease. However, there is lack of information on the influence of elective PCI on ECG parameters, especially QT parameters.
Aims and Objective:
To compare QTc, QTd, and TPe in thrombolytic versus percutaneous coronary intervention therapies in patients with acute STEMI.
To evaluate the effect of thrombolytic therapy and PCI on electrocardiographic QT interval, corrected QT interval, QT dispersion and TPe and the implications of such assessment for prediction of ventricular arrhythmias.
Material and Methods:
Study design: Hospital based observational comparative analysis. Setting: Department of cardiology, S.M.S. medical college and associated hospital.
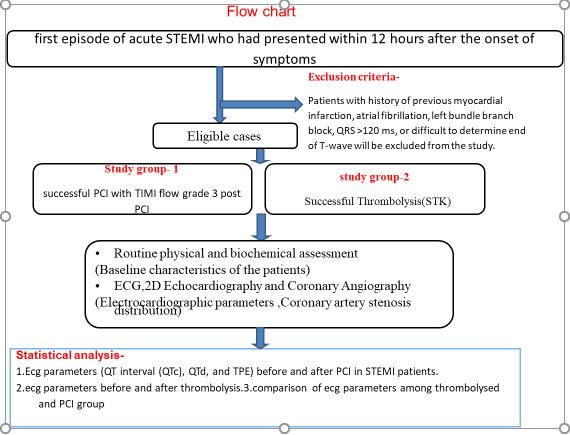
Study population: First episode of acute STEMI who had presented within 12 hours after the onset of symptoms.
Study period: 12 months.
Inclusion criteria: The patients enrolled were selected from those with clinical history and symptoms suggestive of a first episode of acute STEMI who had presented within 12 hours after the onset of symptoms (In all cases, acute STEMI was documented based on ECG).
Patients who underwent successful Thrombolysis defined on basis of symptom relief, ecg changes and reperfusion arrhythmia were included.
Patients who underwent successful PCI with TIMI flow grade 3 post PCI with a door-to-balloon time of <90 minutes were included.
Exclusion criteria: Patients excluded from the study for any of the following reasons:
Non ST Elevation Myocardial Infarction (NSTEMI), prior history of MI or surgical revascularization, atrial fibrillation or flutter, bundle branch block or any other intraventricular conduction abnormalities, pre-excitation on ECG, ventricular pacing rhythm, cardiogenic shock, need for urgent CABG or repeat PCI during a 24-hour period after the procedure, electrolyte disturbance, history of medications that may affect QT (anti-arrhythmic, anti-psychotic, and antidepressant drugs) and if QT interval could not be reliably measured in at least nine leads.
Sample size: - In the study 100 patients were enrolled with precision of 5% (α error =0.05) and power of study (β error) 80%.
Methods:
Acute STEMI is defined using the third universal definition of MI which signifies detection of rise and/or fall of cardiac biomarker values (preferably Troponin) with at least one value above the 99th percentile of the upper reference limit and with at least one of the following:
ECG localization of MI is assessed:
Anterior MI (include anterior, anteroseptal, anterolateral and extensive anterior) and inferior MI (include inferior, inferoposterior, and inferolateral).
Patients included in the study were divided into two groups depending on the reperfusion strategy. First group consists of patients reperfused by fibrinolytic therapy. Thrombolytic agent used was Streptokinase in dose 1.5 million units intravenous given over 30-60min. Coronary angiography was not done in patients who received thrombolytic therapy in the acute phase of MI. Second group consists of patients reperfused by primary PCI (aspiration device, PTCA and/or combined with stenting). Aspirin, clopidogrel, and intravenous heparin routinely given to study patients
Analysis of QT interval:
All standard 12-lead ECGs were recorded at 25 mm/s speed and 10 mm/mv gain.The QT data obtained at admission and 24 hours after Revascularization were manually measured with a ruler. QT interval was measured from the beginning of QRS to the end of the T-wave. The end of the T-wave is defined as the point of return to the isoelectric line.
In instances where the T-wave could not be reliably determined due to extremely low voltage (<.1 mv), measurement of QT interval is not established and consequently these leads were excluded from analysis. In order to exclude the effects of heart rate (HR) on the QT interval, the QT interval is corrected according to the Bazett formula (QTc = QT/square root of RR interval).
QTd is defined as the difference between the maximum and minimum QT intervals. TPe is measured with a ruler from the peak of the T-wave to its end. The criteria to determine the endpoint of the T-wave is similar to the aforementioned criteria considered for QT measurement.
All patients have a minimum of eight ECG leads that is measurable, at least four precordial leads required for inclusion of the patient. All of the ECGs taken in sinus rhythm.
Statistical analysis:
The data was coded and entered into Microsoft Excel spreadsheet. Analysis was done using SPSS version 20 (IBM SPSS Statistics Inc., Chicago, Illinois, USA) Windows software program. Descriptive statistics included computation of percentages, means and standard deviations. The independent t -test (for quantitative data within two groups) and paired t-test (for quantitative data to compare before and after observations) were used for quantitative data comparison of all clinical indicators. Chi-square test used for qualitative data whenever two or more than two groups were used to compare. Level of significance was set at P≤0.05.
Study protocol:
Results:
The population enrolled in this study composed of 100 CAD patients, 72 were males and 12 were females with age range between 24 and 74 years (mean age was 55.7±11.77 years in PCI group and 57.16±12.63 years in thrombolysed group), Mean age of male patient was 57.1+_8.3 years and female were 55.6+_4.6 years.
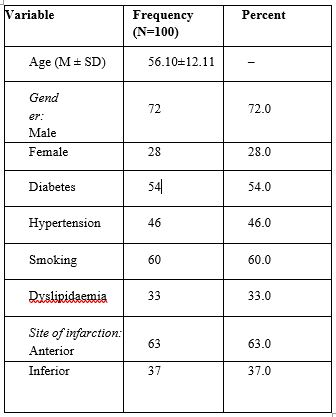
Table 1: Demographic and clinical characteristics of the studied patients.
Most of the studies patients were diabetic, hypertension and smoker. There were no significant differences between the two groups regarding demographic and clinical characteristics as studied.
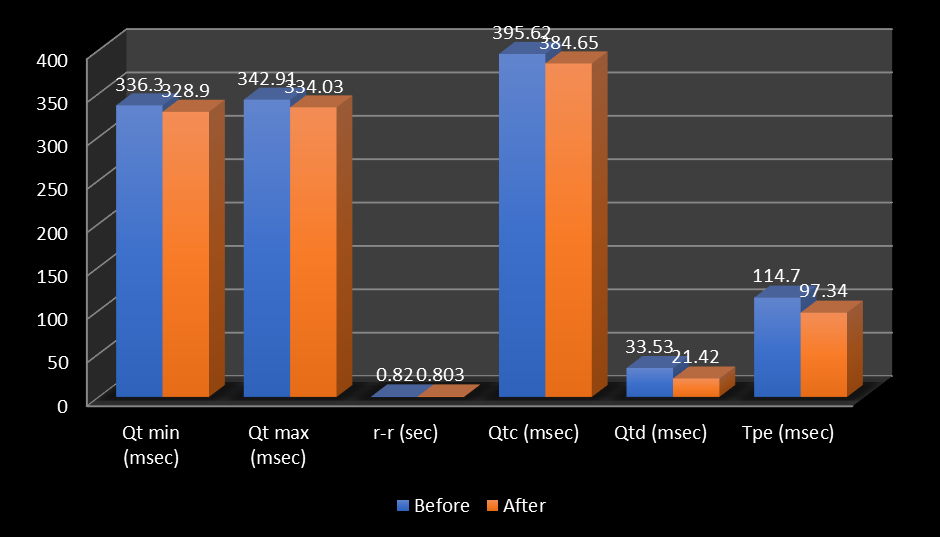
Figure 1: showing comparison of the HR and QT intervals of the studied patients before and after reperfusion therapy regardless of reperfusion strategy.
This figure demonstrates that there were no statistically significant differences noticed regarding HR, and QT minimum before and after reperfusion therapy (p=0.38 and 0.05, respectively). Whereas there was a significant reduction from admission to 24-hour ECGs in all studied patients treated with thrombolytic agent or primary PCI in QT dispersion, QTc maximum, QTc and TPe measurements.
|
variables |
Mean |
Std. Deviation |
Mean differences |
P value |
|
|
Qt min (msec) |
Before |
337.12 |
56.61 |
12.56 |
0.001 (S) |
|
After |
324.56 |
56.86 |
|||
|
Qt max (msec) |
Before |
376.1 |
51.91 |
14.72 |
0.03 (S) |
|
After |
361.38 |
40.34 |
|||
|
r-r (sec) |
Before |
0.83 |
0.17 |
0.01 |
0.701 |
|
After |
0.82 |
0.14 |
|||
|
Qtc (msec) |
Before |
372.4 |
65.08 |
10.96 |
0.13 |
|
After |
361.44 |
69.24 |
|||
|
Qtd (msec) |
Before |
26.96 |
14.14 |
2.6 |
0.24 |
|
After |
24.36 |
8.78 |
|||
|
Tpe (msec) |
Before |
117.00 |
18.801 |
15.21 |
0.001 (S) |
|
After |
101.88 |
17.409 |
|||
Table 2: Comparison of the HR and QT intervals of the studied patients before and after thrombolytic therapy.
Table (2) showed significant changes in the QT measurements from admission to 24 hour after thrombolytic therapy with significant decrease in QTmax, QTmin and TPe from baseline but no significant change in QTd.
|
variables |
Mean |
Std. Deviation |
Mean differences |
P value |
|
|
Qt min (msec) |
Before |
335.48 |
49.29 |
2.24 |
0.73 |
|
After |
333.24 |
39.27 |
|||
|
Qt max (msec) |
Before |
309.72 |
52.23 |
3.04 |
0.4 |
|
After |
306.68 |
53.605 |
|||
|
r-r (sec) |
Before |
0.81 |
0.203 |
0.02 |
0.39 |
|
After |
0.78 |
0.14 |
|||
|
Qtc (msec) |
Before |
418.84 |
33.24 |
10.98 |
0.02 (S) |
|
After |
407.86 |
25.24 |
|||
|
Qtd (msec) |
Before |
40.1 |
15.49 |
21.62 |
0.001 (S) |
|
After |
18.48 |
11.81 |
|||
|
Tpe (msec) |
Before |
112.4 |
20.95 |
19.6 |
0.001 (S) |
|
After |
92.8 |
16.04 |
|||
Table 3: Comparison of the HR and QT intervals of the studied patients before and after PCI therapies.
Table (3) showed significant changes in most arrhythmogenic variables like QTc, QTd and TPe measurements before and after primary PCI therapy, except HR, QT max and min.
|
variables |
Mean |
Std. Deviation |
Mean differences |
P value |
|
|
Qt min (msec) |
PCI |
333.24 |
39.27 |
8.68 |
0.37 |
|
Thrombolytic |
324.56 |
56.86 |
|||
|
Qt max (msec) |
PCI |
306.68 |
53.605 |
54.7 |
0.001 (S) |
|
Thrombolytic |
361.38 |
40.34 |
|||
|
r-r (sec) |
PCI |
0.78 |
0.14 |
0.03 |
0.29 |
|
Thrombolytic |
0.82 |
0.14 |
|||
|
Qtc (msec) |
PCI |
407.86 |
25.24 |
46.42 |
0.001 (S) |
|
Thrombolytic |
361.44 |
69.24 |
|||
|
Qtd (msec) |
PCI |
18.48 |
11.81 |
5.88 |
0.006 (S) |
|
Thrombolytic |
24.36 |
8.78 |
|||
|
TPe (msec) |
PCI |
92.8 |
16.04 |
9.08 |
0.008 (S) |
|
Thrombolytic |
101.8 |
17.409 |
|||
Table 4: Comparison of the HR and QT intervals of the studied patients after reperfusion according to reperfusion strategy
Table (4) showed significant reduction in QTmax, QTc, QTd, and TPe in patients treated with primary PCI therapy when compared with those treated with thrombolytic therapy (p=0.001, p=0.001, p=0.006 and p=0.008, respectively). However, QTmin and HR measurements did not significantly vary between both groups.

Figure 2: Comparison of some ECG data before reperfusion according to the site of the infarction regardless to reperfusion strategy.
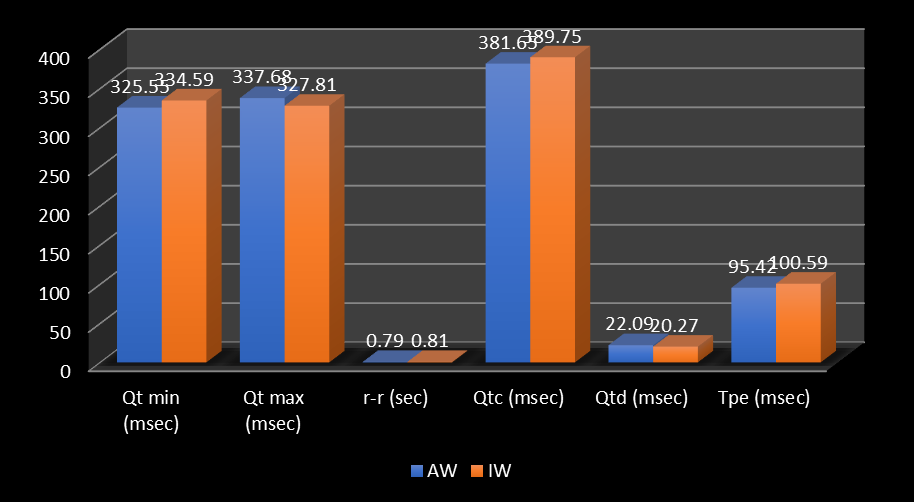
Figure 3: Comparison of some ECG data after reperfusion according to the site of the infarction regardless to reperfusion strategy
Fig. (2) and (3) showed that there were no significant differences between anterior and inferior MI regarding QT, QTc measurements and dispersions before and after reperfusion regardless to reperfusion strategy.
Discussion:
Increased QT dispersion reflects inhomogeneous ventricular repolarization, which may provide a background for significant ventricular arrhythmias [13]. Prolonged QT dispersion is associated with a higher risk of malignant ventricular arrhythmias in patients with the long QT syndrome, hypertrophic cardiomyopathy, and myocardial infarction [14]. Kosar et al. showed that effective management of acute MI or ventricular arrhythmias may reduce QT dispersion.
During acute MI increased QT dispersion is a well-known finding. Also, it was found that QT dispersion is significantly greater in patients with MI who had malignant ventricular arrhythmias than in those without arrhythmias [15]. Van de Loo et al. [16] reported that patients with acute MI who developed ventricular fibrillation within the first 24 hours after admission, QT dispersion was significantly longer (88±30msec) than in those without ventricular fibrillation (56±24msec). On the other hand, Tomassoni et al. [17] had reported that QT dispersion does not predict early ventricular fibrillation during acute MI. This discrepancy could be related to different mechanisms of arrhythmogenesis at each stage of MI and variations in QT measurements over time.
Endoh et al. [18] documented a significant reduction in QTc dispersion from the acute phase of MI (2nd day) to the recovery phase of MI (14th day) in patients with early coronary revascularization (TIMI flow >2 within 12 hours after the onset of symptoms) compared to patients without revascularization. On the other hand, other researchers noticed that in patients with reperfusion, QT interval was prolonged transiently within 12 hours and shortened later, whereas in patients without reperfusion QT interval became prolonged progressively on serial ECGs recorded within 72 hours after the onset of symptoms [19].
As regarding site of infarction, patients in our study with anterior MI were more than those presented with inferior MI (63.0% and 37.0%, respectively). These findings coincide with those reported by Cavusoglu et al. [20]; in which anterior and inferior MI were 57.14% and 42.86%, respectively.
Pan et al. [21] clarified that QTc dispersion change after primary PCI considered as independent predictor for the development of major cardiovascular events (which was defined as life threatening arrhythmias, nonfatal MI, heart failure hospitalization, and death) at one year follow-up.
In our study, there was no significant change in HR and QTmin before and after reperfusion, Whereas a significant change was noticed among the studied sample as regarding QT dispersion, QTc and TPe before and after reperfusion. These findings were consistent with data reported by Cavusoglu et al., Nikiforos et al. [22], Aydinlar et al., and Alasti et al. [23].
De Boer et al. [24] had documented that treatment of acute MI with thrombolytic agents or primary PTCA leads to reestablishment and maintenance of coronary patency, preserves myocardial function, and improves survival. Also, it's known that establishing sustained patency of the artery leading to reduction of the electrophysiological instability so reducing the QT dispersion [25].
In acute MI, early thrombolytic therapy is known to reduce mortality. Improvement in the left ventricular functions and reduction of late arrhythmias by enhancing electrical stability of the heart may decrease the rate of sudden deaths. Thus, thrombolytic therapy is expected to have a positive effect on late arrhythmic events after infarction [26].
We did not find a significant reduction in QT dispersion in our patients before and after thrombolytic therapy. Our findings are in agreement with other reports Anderson J et al. [13,27-30], but on the other hand, Cavusoglu et al. and Nikiforos et al. had concluded that patients treated with thrombolytic therapy were associated with a significant reduction in QT and QTc dispersions.
Choi et al. [31] demonstrated that QT dispersion decreased in coronary artery disease patients with no history of myocardial infarction at one month following a successful PCI. Another study per- formed by Aydinlar et al. revealed a reduction in QT dispersion immediately after percutaneous transluminal coronary angioplasty. According to our data, a successful full revascularization of patients with acute STEMI is associated with a significant reduction in QT dispersion.
We did not use corrected QTd by HR since another clinical and experimental study has failed to find correlation between HR and dispersion of ventricular recovery times measured with QTd. Furthermore, there were significant reduction in the QTd and QTc measurements before and 24 hours after PCI but not in the QT maximum and minimum interval measurements. These findings are in agreement with Cavusoglu et al., Alasti et al., and Alici et al. [32]. They found that these two measurements did not vary significantly between admission and 24 hours after PCI treatment.
Although there was a significant reduction in QT and QTc dispersions in both groups (those treated with thrombolytic therapy and those treated with primary PCI), we noticed that QTd and TPe were shorter in the primary PCI group than in the thrombolytic group. These findings can be related to the higher TIMI 3 flow patency rate obtained by primary PCI. This is important in the context of the fact that PCI is generally associated with better clinical outcomes when compared with thrombolytic therapy. Also, Cavusoglu et al. showed that PTCA is associated with a more significant decrease in QT and QT dispersions compared to thrombolysis.
Our study revealed that QT intervals, QTc and QTd are non-significant in anterior MI vis a vis inferior MI [33]. In many studies it has been found that no significant differences in QT measurements between patients presented with anterior MI and those presented with inferior MI before and after reperfusion regardless to reperfusion strategy, though it has been reported that QT and QTc dispersions are dependent on the infarct size, and the greater values of QT and QTc dispersions associated with anterior MI can be explained by larger infarction [34]. Cavusoglu et al. who observed a significant reduction of QT and QTc dispersions with reperfusion therapy in both sites of MI. In concordance with other studies, our results revealed that rapid and complete reperfusion with primary PCI reduces arrhythmic vulnerability based on analysis of QTd and TPE.
The major limitation of this study was small sample size, therefore conducting a larger study with more cases could be more informative. A limitation of QT interval assessment is that it is not always measurable in every lead or may be difficult to measure with precision in certain leads.
Conclusion: -
Primary PCI is associated with higher significant reduction in QT intervals, QTd and TPe than thrombolytic therapy. Our study showed that primary PCI was effective in reducing the degree of arrhythmogenic indices such as QTd and TPE and may be used as markers for successful reperfusion.


Open Access By Aditum Open Access Journals id licensed under Creative Commons Attribution 4.0 International License. Based On a Work at aditum.org