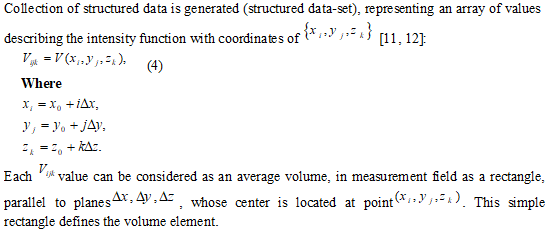
Neurosurgery and Neurology Research
OPEN ACCESS | Volume 7 - Issue 1 - 2025
ISSN No: 2836-2829 | Journal DOI: 10.61148/2836-2829/NNR


O. G. Avrunin 1, Husham Farouk Ismail Saied 2*
1Kharkov National University of Radio Electronics, Lenina14, Ukraine.
2INAYA Medical College, Saudi Arabia, Riyadh-P.O. Box 271880, 11352.
*Correspondence author: Husham Farouk Ismail Saied, 1Kharkov National University of Radio Electronics, Lenina14, Ukraine.
Received date: August 12, 2021
Accepted date: August 16, 2021
published date: August 20, 2021
Citation: O. G. Avrunin, Ismail Saied H F. “Planning Method for Safety Neurosurgical and Computed Tomography Contrast-Data Set Visualization”. J Neurosurgery and Neurology Research, 2(4); DOI: http;//doi.org/06.2021/1.1024.
Copyright: © 2021 Husham Farouk Ismail Saied. This is an open access article distributed under the Creative Commons Attribution License, which permits unrestricted use, distribution, and reproduction in any medium, provided the original work is properly cited.
Discussed the issues' associated with the development of a computed neurosurgery planning system. An important part is to determine the value of invasive surgical access. The study purpose is to design a methodology for finding the shortest distance between surgical target and peripheral point of the brain tissue with strict adherence considering the type of the brain anatomical structure existing in the path of surgical track (risk map), these two-condition used in companion to determine the risk value of the surgical access. The study method consists of two algorithms for calculating the shortest surgical access to the target and assuring the safety by avoiding high-density tissues identification method “internal map” describing the anatomy of the brain such as bones. An algorithm for automatic identification of brain vascular system also was designed. The structural diagram of the contrast data visualization system, using computed tomography data, was thoroughly discussed. Also trying to contribute in solving issues facing developers of modern medical imaging visualization systems to select the most appropriate method from the whole arsenal of algorithms and processing models concerning displaying brain surgical zone using image registration and optical tracking system. The visualization of the target zone is carried out according to an internal reference landmark points inside the center of the brain as well as an automatic algorithm for contour recognition was applied. Moreover, the optical tracking system was used to assess the navigation accuracy of determining the position of the surgical instrument outside the patient head. Algorithms necessary for operational planning also was included, and the proposed method was applied in a pilot study with simulation mode to human brain model, in order to target a specific surgical zone, and as a result, the system suggested (24) possible surgical track, among them, were selected the best and safest access. The total error of a surgical instrument targeting was less than 3 mm (in average 2.6 mm).
Introduction
The rapid development of medical technology, and in particular, eternal imaging graph equipment, modern neurosurgery leads to a qualitatively new level. Using current intelligent imaging techniques, in addition to identifying structural abnormalities (defects, injuries), and in some degree allow to determine the characteristics of anatomical of brain structure, and, as a consequence, take these parameters into account when choosing surgical access approaches.
Modern medical computer diagnostic system must provide clinical aid when carrying out a diagnosis to perform routine surgical operations and complex computational procedures, expanding the possibility of the investigation methods [1]. The improvement of data displaying methods in the field of medical imaging systems has a paramount importance that can significantly increase the efficiency of the diagnosis process [1, 2]. The last 30 years were characterized by a rapid revolution in the improvement of radiation-mapping tools, such as X-ray, CT scan, magnetic resonance and positron emission tomography, and the main purpose of the diagnostic task anyway is to obtain the maxim information with a minimal patient injury [3, 4].
Modern neurosurgical visualization systems clearly hold the principle of harmonization between hardware and software. It is important for the pre-planning of surgical intervention to select exactly methods (scanning modes control) that would be most informative and would allow obtaining the initial data with minimal instrumental errors. The software functions are assigned with the secondary data processing and resulting data visualization of the studied objects. The efficacy of the diagnosis method is associated with the possibilities of supporting algorithm and its software realization [5].
The Relevance of The Study
Computed planning systems used for modern neurosurgery intervention are widely used in medical practice. This is primarily due to the complexity of calculating a reliable targeting approach that would lead to the most positive outcome of the intervention. At the same time, the planning system can solve these complex calculations by taking on itself a significant part of these tasks.
This study is trying to contribute to solving issues facing developers of modern medical imaging visualization systems to select the most appropriate method from the whole arsenal of algorithms and processing models concerning displaying brain surgical zone. Also, the visualization of complex brain tissues was presented. An algorithm for automatic identification of brain vascular system was designed.
Analysis of the Research and Literature
The use of commercial computer systems for neurosurgery planning widely covered in different literature [6-9]. Practical tasks are implemented abroad [9-12].
The neurosurgical planning, especially when performing interventions in deep-seated intracerebral structures, requires knowing not only the spatial arrangement of target regions, but also localization of vascular system and sinuses. While visualizing the vascular system, average data from specialized anatomical brain atlases are utilized, that, unfortunately, couldn’t accurately investigate the vessels, owing to the high-individual variability of blood vessels [13,14]. The complex approach based on combining standard data from the angiographic and tomography examination usually leads to the reduction of accuracy of virtual visualization procedures, casing by the errors in reference orientation points determination.
At the current stage, the most preferred method for modeling of the human brain vascular system is the spiral CT of contrast data visualization [15-17]. The essence of this method is based on a high-speed spiral brain scan, with an injection of special intravenous vital stain, permitting more contrast of the vascular channel through establishing a gradient concentration, between the intravascular and the extracellular spaces. The resulting CT-picture of the brain is extremely intricate to analyze and to investigate even by an experienced specialist. Therefore, in advance, it is urgent to solve the problem with means of carrying out the virtual visualization of a vascular channel with the possibility of interactive selection of the options for real-time monitoring and the required measuring procedures. The methods of data-mapping with computed tomography contrast data are divided into two approaches; 2D and 3D. The design and exploitation issues, the convenient software and the methods of tomography data processing were discussed in many pieces of literature [18-20]. However, the unresolved issues are related to the automatic segmentation procedure of the vascular channel, designing "smart" rendering algorithms and the optimization of surgical approaches based on data describing the location of vessels, taking into account the anatomical variability. Hence, the actual modern tasks are aimed at developing computational methods and algorithms to achieve the maximum reality and visibility.
Statement of the Problem and The Purpose of The Study
Development of a computer system planning neurosurgery is a major challenge. With its development raises an important issue related to the definition of the risk of interference particular surgical approach. This is largely mediated planning system determines the quality and consequently determines the outcome of the operation, the rate of a minimal patient injury, etc. The aim of this work is to study the various methods and approaches to identify invasive neurosurgical approaches (the access toward the target) and from them chose the best one.
The stereotactic calculation is considered as a high-precision guidance of a surgical instrument to the stereotactic target. For this purpose, the following must be considered:
Methods
The Structure of a Computed Neurosurgery Planning System
The methods were designed to perform surgical simulation and planning techniques for best surgical procedures (case study). In order to upgrade the capabilities of computed tomography (CT) systems, the generalized diagram of the computer planning system for a neurosurgical access was designed (see Fig. 1). CT study data will be loaded to the system in volumetric format data set, this data reformed according to a specific technique (this technique will be presented ahead), these data used to build the 3D mathematical model and the common coordinate system. Based on this new model, the target zone will be identified and the surgical access track will be to construct according to two criteria. The neurosurgical planning, especially when performing interventions in deep-seated intracerebral structures, requires knowing not only the spatial arrangement of target regions but also localization of vascular system and neural tissue.
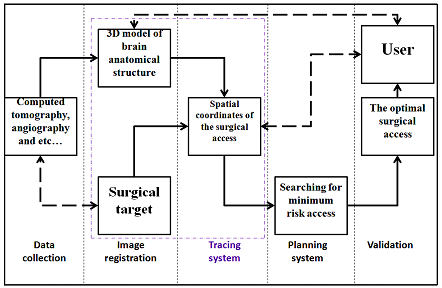
Figure 1: Generalized block diagram of a computer planning neurosurgical system
The ultimate goal of designing of this system is to choose the best track(s) to reach the surgical target zone during a surgical intervention, targeting access will be calculated and selected from among number of tracks proposed by the system itself (possible tracks for surgical access) [20-22]. In general, the main elements of the frameless stereotaxy navigation systems in this study include the flowing:
Image Registation and Tracking System:
The position detection subsystems in the surgical navigation method should provide of two main functional procedures:
The image registration based on image processing and transforming into a common coordinate system. The image registration is the main element of neuro-navigation procedures. To guide the frameless stereotactic navigation tool it's important to merge all data into a common model coordinate system, especially when multiple modalities and intraoperative imaging data are incorporated into the navigational plan.
In this study the detection of the surgical tool position inside of the patient head relies on technique based on spatial registration anatomic reference landmark, these landmarks is carried out according to an algorithm for finding a points inside the center of the human brain, the automatic algorithm based on contour recognition, that is applied to edge the contour of the reference landmark point. The visualization is chosen to identify the (III ventricle) at the central intra-cerebral, to be as our reference point, which is necessary to localize the center of our stereotactic coordinate system. Details of this process are described in our previous work [23].
The summary of the proposed method is as follows: The target zone structure which will be a subject of destruction or simulation, is characterized by metastasis state and in the operative environment to be an identical landmark (III ventricle, fig.2a,b ) in a 3D model. The contrast of this structure (target zone), usually is unclear and cannot be visualized on the CT slice by using standard method. In this case, we used an indirect method of visualization for a surgical zone by linking in a common coordinate system, the localization of the (target zone) to the reference landmark point (III ventricle) inside the center of the brain. The reference point is described determined in the central point of the line connecting the anterior/posterior points of the third ventricle at the ventricular system. Detection of the reference point is based on CT scanning at the orbit metal line of the skull plane, this line passes through the posterior edge and external auditory meatus parallels to the middle line of (A-P) by an angle of deviation less than 5° [11, 15].
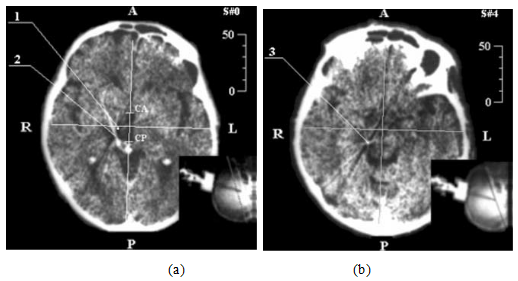
Figure 2: Demonstration of neurosurgery CT-stereotactic calculation, while targeting med-nucleus of colorless ball:
a). stereotactic CT-slice at zero-plane level,
b). CT- stereotactic calculation at the level of surgical zone:
1. The calculation of central point stereotactic-target zone,
2. Artifact of cannula movement,
3. Distal point of the cannula moving part.
Figure 2: Anterior portion of third ventricle
Detection of surgical tool position outside of patient head is based on the spatial coordinates of anatomic external landmarks and optical position determination technology and estimation the sources of errors, these system was implement and approved in our previous work [23]. The optical method of detecting surgical tool position can be summarized in the following: The tracking systems utilize on dual optical cameras that track the position of surgical tool relative to a fixed reference landmarks(m11,mi1,mmn1,m22mi2,mmn2). At first, consider the operation principle of the surgical instrument tracking and the patient’s head position by using the optical approach. The method based on registration of the spatial location of the marker position by two optical cameras(Fig. 3a),an example (Fig. 3b).
A simplified functional block diagram of the operation principle of the surgical instrument position calculation using two-camera system was considered [23]. Two identical videodetection devicesare used for a surgical zone (v) detection and instrument position. Tracking: In order to extract complex instrument movement and patient’s head position precisely, two cameras are used to capture the multi-view sequences. For each projectionare made a calculationsmarkers position (m11,mi1,mmn1,m22mi2,mmn2).The obtained data of matrix calculation are from the tool position transformation or patient head position as in refer to [24], these data describing the main stages of surgical instrument position in 3D coordinate system space. In the common positioning markers block, where made thecommon markers position determination in the space (Mmn,Mi,M1). According to the multi-viewdata projection+ the data coming from the matrix projection (C1, C2).Errors estimation and calibration: tracking of instrument movement can be achieved by virtue of the multi-view video sequences. The errors that occurred during tracking can be solved with the multi-view mode. Multiple views mean that the same video-view is captured with the same markers (m11,mi1,mmn1,m22mi2,mmn2) from different viewpoints, and the multiple corresponding image feature points are competent for reconstructing 3D coordinates of feature points accurately. Therefore, compared with monocular video sequence, 3D reconstruction is easier under multi-viewpoints. However, for each video-device were made a systematic calibration procedure, which were made to determinethe surgical tool position using the projection matrix. The number of detected markers are equal to (mn), this number should be in full extent useful for determining the surgical instrument position.Recognition: The information in the (model), describing the common positioning ofmarkers(m11,mi1,mmn1,m22mi2,mmn2) in the object coordinate system, and transmit to final block, in order for determine the transformation matrix of the tool position (Ti), which referto the position of surgical tool.

Figure 3A: Dual optical cameras used for surgical tool positiondetermination,
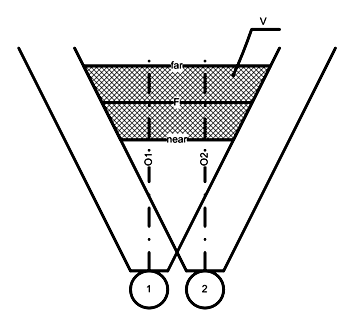
Figure 3B: An example of marker position registration method using two optical cameras
Computed Neurosurgery Planning System:
The study method consists of two algorithms:
Invasive Surgical Access
To assess the specific surgical approach is necessary to formalize the parameters determining the risk of such access. This allows you to set a specific surgical approach in the corresponding to numerical value that specify the invasiveness value and type, as a result choose the least traumatic neurosurgicalaccess.
Each element of thesurgical accesstrackn (x (n), y (n), z (n))determinedby the expression(1) based on thetarget coordinates(xT,yT,zT),and the intactcoordinates (xM,yM,zM),and the step(Δt).
(1)

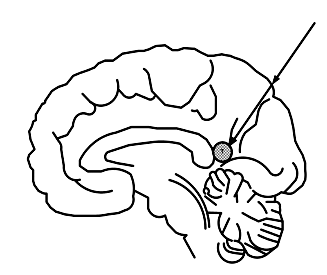
Figure 4: Illustration of neurosurgical access method
Computed Tomogravy Contrast Data Visualization System
For detailing of each anatomical structure through the surgical track, the high-density tissues such as bones and so on.... CT contrast data visualization method was implemented. Three subsystems (fig.5) were constructed in the main system of CT contrast data visualization, in order to solve the problem statement.
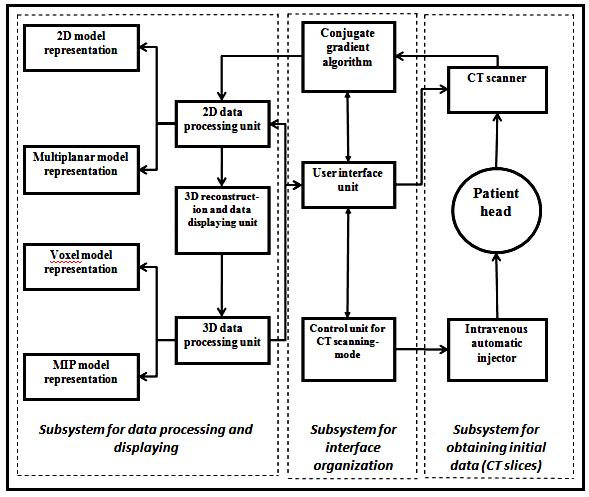
Figure 5: Proposed CT contrast-data visualization method
The initial data was collect to conduct the study, the dataset is axial CT- slices, obtained by install CT scanner (Somatom and Siemens).
The study implemented according to contrast scanning protocol (Injector Medrad Vistron CT) parallel to the base of the skull with a standard patient lying. The aim of this visualization protocol is to generate the best diagnostic data display and to illustrate the characteristic features that could aid in further CT image analysis. Scanning procedure was made with 1 mm step between the slices. The spatial characteristics of the investigated area, that is calculated by (N), and this number usually equal (N> 100 slices). CT-image intensity is represented by F(i,j) function, and specified in raster size (I´J), by mean (an image size should be 512´512 elements). The intensity image element calculate in pixel, and used for every CT slide with a coordinates of (i,j), that is relatively equivalent to the attenuated X-rays passed the tissue at the volume unit, projected on a specified point..
The first subsystem consists of spiral CT scanner and automatic injectionunit for intravital stain injection, which is used according to the pre-mentioned protocol (input data), that could be used for determination of the operation mode of the subsystem. CT imaging system starts scanning the study area after a short time interval of injectionprocess. CT resulting images contain a set of slices, preliminary processed in CT calculation unit.These slices are then transmittedto conjugate gradient algorithm wherethe data are processed in the 2D module.
The interface organization subsystem consists of: 1) conjugate gradient algorithm for data obtaining and processing, 2) CT scanning-mode control unit, for specifying the data flow and volume parameters, as well as the duration of intravital stain injection, and the delay time before starting scanning, 3) The user interface module for guarantying the interaction between the radiologist and imaging system (hard software) and linking the visualization software to the hardware.
The subsystem of data processing and visualization is based on a high speed-graphicstation. Itconsists of: 1) Data-processing software (2D and 3D), which is used for formation of 3D model and dataanimation,2)Datavisualization unit in 2D and 3D modes. The algorithms of2D data display carry out visualization of 2D and 2. 5Dmodels.Moreover, thissubsystemsresponsible forreconstruction ofthe multiplanar model. Volumetric data visualization is performed byVoxel visualization unit and the Maximum Intensity Projection (MIP) unit.
The Implementation Of 2d Data Processing and Algorithm For Data Visualization
2D data processing deals with some isolated slides located in individual multiplanar section. This type of processing is aimed at transformation of the initial data, in order to improve the visual monitoring of brain anatomical structure. Furthermore, image correction mode should be selected at this stage, allowing improvement of identificationof brainvascular system location, as well as, performing thedetection andidentification of possible brain anomalies. The main algorithm of image processing at current stage is the local operations, related to the initial data transformation for defining images radio density, using the scale of Hounsfield HU (-1000÷1000 unit of НU), in intensity gradient of256 intensity levels in the graphical data displaysystem. The methods of intensity correction histogram are used to increase the brightness and contrast of displayed image. The median filtering algorithms were used to eliminate the local interference thatcouldprevent imageblurring, the same as its analogue standard algorithms of averaging filtration. Selection of median filter mode is adaptively performed with respect to the noise geometrical dimensions and vessels, so as notto remove small formation of the vascular system. After elimination of the local noise, it is necessary to perform high-frequency filtration of resulting images for further improvement of the displayed vascular system.
The obtained data after filtration is transferred to the unit of 2D visualization for immediate display. During this stage, the 2D visualization unitprovides CTslices in the coordinate system and various measurement procedures for more diagnostic information.
Multiplanar model reconstruction unit displays the structures of the model, slices located not parallel to the scanning plane. It is used tomonitor vessels having a large branching degree and variability, as well as visually monitoring the orientation of the anatomical configuration.Algorithm ofreconstruction of the multiplanar model is based on reconstructingplane P by three points,andas in (fig.6). Two points areusually definedby a single plane of the CT slice; the third point defines the orientation of themodel atvertical plane. Moreover, the framework of the model is determined by upper and lower numbers of CT slice.
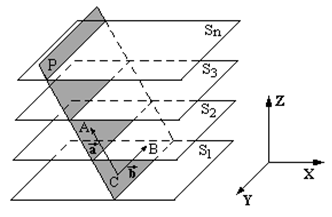
Figure 6: Illustration of the reconstruction of multiplanar model
In case of establishing themultiplanar model perpendicular to the scanning plane, the third point is automatically specified, and its coordinates of (x, y) match with the coordinates of one points previously selected-coordinate is determined by the maximum/minimum slice number(Sn), used in reconstruction procedure. Thus, the model plane (fig. 6) is parametrically determined by the equation:
, (2)

Where t and s is parameters:.
In coordinate form, the equation (1) was used for calculation of the plane:
 .
.
Elimination of polygons (tiled surface), associated withthe smallest spatialstructures inZ plane of the image, it is necessary to apply the procedure of low-frequency filtration which clearlyvisualize vessels perpendicular tothescanningplane (fig.7).
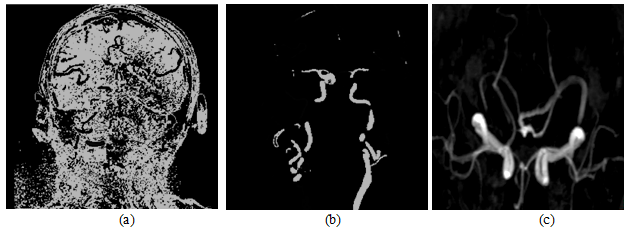
Figure 7: The construction of the multiplanar vessels model.
(a)Original CT image perpendicular to the scanning plane.
(b) Conduction of H characteristic function to the CT image.
(c)brain vascular 3D model
2.5Dimage contain detailedinformation about theanatomicalstructure. Therefore, special graphical buffers (G-buffers), containing additionalinformation about the image, are used to construct the 2.5D image. TheBasic components of 2.5D modelare: characteristicsbuffer (H buffer) and identification buffer (ID buffer) (Fig.5). The control unit of displayingmode determines thedatamonitoringmethodwhen combining data buffers. The OriginalImageof CT slices are stored in(OI-buffer). 2.5Dvisualizationmodeperformsselective isolation andpseudo coloringof differentanatomical objects (fig. 8).
CT contrast-data stored in H-buffer contains information about the characteristic function (binary images) of vessels.Thisinformation is gained according to data describing the density of blood vessels that is filled withintravital stain (contrast medium):
(3)
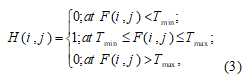

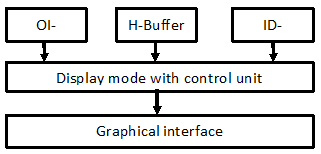
Figure 8: Subsystem structure of the graphical mode in 2.5D
The originalimage anditscorresponding contentare stored inH-buffer (Fig.9a, 9b) to increase the visibility ofimage mapping provided withan inverse characteristicfunction.
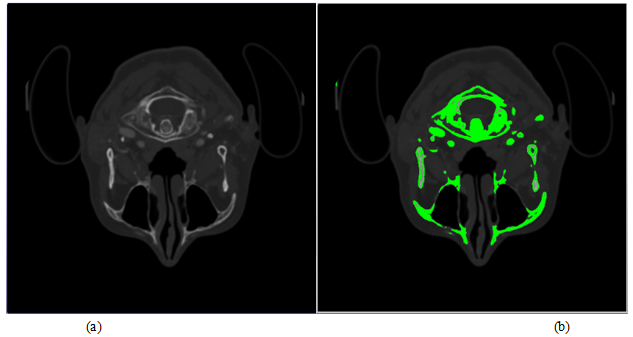
Figure 9: Original CT image and its corresponding content.
(a)Originalimage CT slice.
(b) Inverted CT image with H characteristic function,showing the contours of bone formation
Logical filteringof the characteristic function values was performed to eliminate thelocal noisesand false objectsinH-buffer (for example, image elements that located at the bone medulla boundary).
ІDbufferdata, containing the individual identifiers ofbrain anatomicalstructures, is based on the methods ofmulti-value image segmentation, using sequential segmentation algorithms [10]. Initially,this algorithmis based on density differences, followedby geometric characteristics (size, shape, location, etc.). At this stage, minimumdegree of automation is used, requiring further investigation.
Implemenation of 3d Processing Algorithm and Data Visualization
Three dimensional (3D) method of visualization CT-data is used for more accurate determination of localization and disease nature, as well as implementation of the surgical planning. The basic principle of CT-image formation of scan area is dividing the image into simple volumes, where each volume is characterized by a number of Hounsfield (Hu) and each of these volume parts is called volume element (voxel) as shown in (fig.7, a). Extraction efficiency of complex polygonal models requires for addition on processing system and module displaying tomographic data for polygons optimization. This optimization should include reducing the number of triangles, describing a display object by removing obviously invisible parts, combining several triangles lying in the same plane of one triangle. Thus, when preparation voxel model, advisable to carry out the removal as individual faces, that common to multiple voxels, as well as elimination of whole voxels invisible from the outside of the model. Combining adjacent faces of voxels in one face spills in a significant reduction the number of primitives of the model. Rearranging flow vertex indices of triangles based on organization transformation cache video card, allow to reduces the number of performed transformation matrix and significantly increase the number of displayed triangle model per moment of time. Described above optimization techniques allow in real-time to model visualization, to obtained triangulation tomographic large amounts of data (hundreds of millions of voxels). However, in order to perform visualization of volumetric network data, need to know exactly which voxels from belong investigated object and must be displayed when rendering, and which are contrary discarded. This procedure is carried out by the formation of binary mask, obtained after first segmentation data imaging. The operation of selection the first brightness for visible items tomographic cube should be in the manual mode and require for an interactive original data of mapping when changing visible brightness range rendered voxels. To Resolve this task, and to satisfy the mentioned requirements, by the method of discarding rays before first collision. It allows instantly to obtain highly voxel detailed projection studied objects. while dynamical changing first mapping. The results of applying this method to a sequence of tomography slices of the patient's head for different values of the first presentation in (Fig10, b).
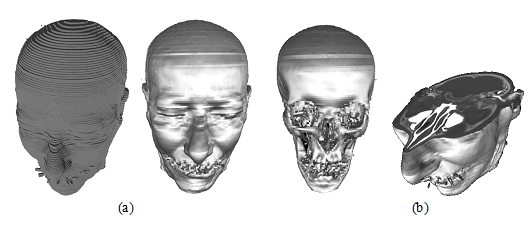
Figure10: The 3D dimensionalmodel of human head.
(a) Polygonal voxel model.
(b) Cross section view of rasterization model
3D visualization of CT contrast-data is implemented by 2 modes: 1) gray-scale voxel visualization method, and 2) display algorithm using maximum intensity projection (MIP).
In case of 3D voxel visualization, the object is represented as a set of voxels. The 3D model is performed using3D raster visualization. The additional characteristic of voxel is that it expresses the transparency degree. This visualization can be carried out using partial slices through alteration of the transparency degree of voxels for different objects, taking into account of the transparent voxel objects should be removed. Current visualization method could estimate the spatial relationships between the vessels and surrounding structures (Fig. 11a).
When utilizing the (MIP) algorithm method of visualization, display band of intensity levels is selected and construction of display list containing voxel with intensity in a given interval (Fig. 11b). The main difficulty of this mode is manifestation of structures having a similar intensity, but it could simultaneously represent anatomical objects of different nature (for example, intravital-stained vessels and fine bonestructures).
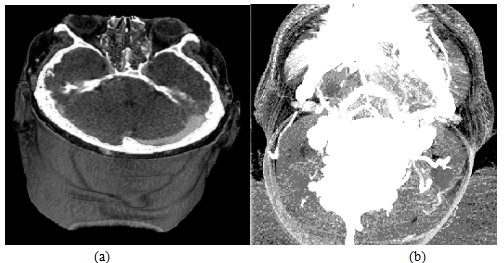
Figure 11: Snap shooting of CT-data representation in 3D mode.
(a) Mapping in grayscale voxel model.
(b) Mapping in MIP algorithm method
Results
It will be appreciatedthat thestereotacticaccessisdirect accessto the targetin three-dimensionalspace (fig.12). In thissame study, as illustrationswill use thetwo-dimensionalschemein order to increasethe visibilityof the materialand improveits perception.Accordingly, thesurgical accessin the one plane,sure it will show the targetand the access angle better.
Considera variety of methodsof determinations theinvasivenessof surgical approach.
The simplestmethod is “2” which describes the risk ofsurgical access(RE), which expressed by the distancefrom the endpoint of the trajectory(intact - T),towardthe stereotactictargetpoint(I).
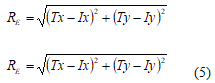
Fig. 12shows therisk evolution of the surgical procedure done by (5),24accesses, and the smaller the risk, thedarker it is represented in the geometric anatomical graph (Fig. 12a).
Normalized values ofriskare shown in Fig. 10b(square of the distance and thedistance). Thus, the method todeterminethe riskof surgeryvalues is not taking into the account of the anatomicalfeatures of the human brain, and thereforeit cannot beused in actualsystemsneuro-surgicalplanning.
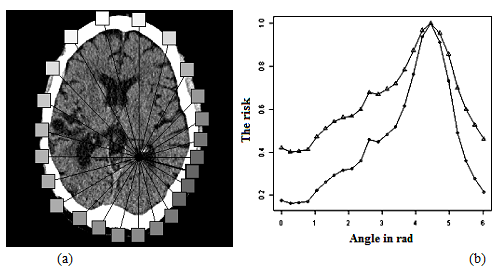
Figure 12: Risk neurosurgical access.
(a) geometric representation.
(b) graphical representation
It is therefore necessary to include personal volumetric map for the invasiveness track, which would take into account the physiological significance details of each anatomical structure through the track, as well as the value of the risk of the surgical access [20].
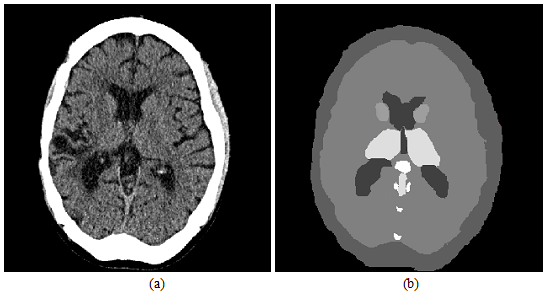
Figure 13: CT brain slice and map invasive.
(a) original image representation.
(b) graphical representation
Figure 13 shows an example of the CTsliceof the human brain and its corresponding graphical imageassigned theinvasiveness(the lighter structures in the slice, the higher risk duringthe surgery). It will be appreciated that will use of additional CT study as an giography,allows to expand and improve considerably invasiveness map. This is primarily due to the large value important that will give to the index contain blood vessels [25].
Using ofinvasiveness map, allows of the access risk (RA)evaluation,bythe sum ofthe index values (ID)which locatedalong theinvestigationalsurgicaltrack (6).
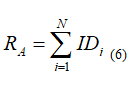
Fig. 5 shows an example of the calculation ofneurosurgicalaccessdone by (5) and (6)together. As can be seen from Fig.14b, in the approach referredto (6), there are additionalminimathat correspond to the optimaltrackin thisslice.With decreasing of the angle step thatspecifies thesurgical access, the accuracy will increase, and will founda new trackthat are locatednearhazardous anatomicalstructures (data for a high-risk surgical procedure).
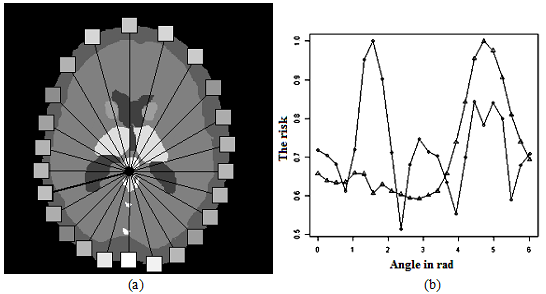
Figure 14: The risk ofneurosurgical access.
(a)geometric representation.
(b) graphical representation
Conclusion And Future Work
The study reached the following conclusions:
Conflict of Interest
O. G. Avrunin, Husham Farouk Ismail Saied, are declare that they have no conflict of interest.
Ethical standards
All procedures performed in studies involving human participants were in accordance with the ethical standards of the institutional and/or national research committee and with the 1964 Declaration of Helsinki and its later amendments or comparable ethical standards.
Informed consent
For a retrospective study of anonymized image data, informed consent is not required.
The authors extend their appreciation to the College of Applied Medical Sciences Research Center and the Deanship of Scientific Research Prince at Sattam Bin Abdulaziz Universityfor funding this research
Funding
The authors extend their appreciation to the College of Applied Medical Sciences Research Center and the Deanship of Scientific Research Prince at Sattam Bin Abdulaziz University for funding this researc

Open Access By Aditum Open Access Journals id licensed under Creative Commons Attribution 4.0 International License. Based On a Work at aditum.org