Journal of Clinical Oncology and Cancer Research
OPEN ACCESS | Volume 2 - Issue 1 - 2024
ISSN No: 3065-6729 | Journal DOI: 10.61148/3065-6729/JCOCR


U. Rilwan 1*, I. Yahaya 2, M. Musa 3 ,O.O. Galadima 4 , J. Waida 5 and M. M. Idris 6
1Department of physics, Nigerian Army University, Biu, Borno State, Nigeria
2Department of physics, Federal University of Technology, Owerri, Imo State, Nigeria
3Department of physics, Adama Moddibo University, Yola, Adamawa State, Nigeria
4Department of physics, Federal University, Gashuwa, Yobe State, Nigeria
5Department of physics, Borno State University, Maiduguri, Borno State, Nigeria.
6Department of physics, Nasarawa State University, Keffi, Nasarawa State, Nigeria.
*Corresponding author: U. Rilwan, Department of physics, Nigerian Army University, Biu, Borno State, Nigeria.
Received: April 25, 2023
Accepted: May 02, 2023
Published: May 14, 2023
Citation: U. Rilwan, I. Yahaya, M. Musa, O.G. Galadima,J. Waida and M. M. Idris . (2023) “Investigation of Radon-222 in Water from Loko Town in Nasarawa, Nasarawa State, Nigeria”, J Clinical Oncology and Cancer Research, 1(1); DOI: http;//doi.org/005.2023/1.1002.
Copyright: © 2023 U. Rilwan. This is an open access article distributed under the Creative Commons Attribution License, which permits unrestricted use, distribution, and reproduction in any medium, provided the original work is properly cited.
Water is the major constituent of the Earth’s streams, lakes and oceans and the fluid of most living organisms. It covers about 71% of the Earth surface. It is vital for all known forms of life especially man. Thus, this research tends to ascertain whether Radon from water sources in Loko of Nasarawa local government area of Nasarawa state possess a health risk to the populace or not using Liquid Scintillation Counter. The present study showed the radon concentration in the water samples from Loko have an average mean 222Rn concentration of 3.91 ± 0.76 Bq/l. The mean annual effective dose due to ingestion and inhalation was found to be 0.000051 mSv/y and 0.985 mSv/yr respectively. The mean excess lifetime cancer risk due to ingestion and inhalation was found to be 0.00018 x 10⁻³ mSv/y and 3.45 x 10⁻³ respectively. The results showed that, the samples from underground water (boreholes and well) are not safe for children consumption even though good for adults. It can be concluded that natural radionuclides pollution in Loko are an issue of health concern. It is therefore recommended that proper radiation monitoring exercise should be conducted regularly in the study area.
1. Introduction:
Water is the major constituent of the Earth’s streams, lakes and oceans and the fluid of most living organisms [1]. It covers about 71% of the Earth surface. It is vital for all known forms of life especially man. Man uses water for various reasons such as transportation, power generation, Agriculture and other domestic activities hence its availability and quality as regard radiological, microbiological, chemical and any other form of contamination are delicate and vital issues [2]. Unfortunately, access to potable drinking water in most developing countries such as Nigeria is a major challenge hence most people rely heavily on untreated surface and ground water sources for consumption [3].
The inhabitants of Loko village of Nasarawa local government area of Nasarawa state rely solely on untreated groundwater sources (well and borehole) as well as surface water source. This is because there are only few available pipe-born water sources and in most places where such sources are available, they are not operational. Radon-222 is soluble in water and is a naturally occurring radioactive inert gas with a half-life of 3.82 days which is a member of the Uranium decay series [4]. It contributes the largest proportion of the total radiation from natural sources. Studies have shown that Radon-222 (222Rn) and its progeny contribute about 50% of the total effective dose equivalent from natural sources [5]. The concentration of 222Rn in water is due to the decay of Radium-226 associated with the rock and soil [6]. The radon gas penetrates through soil and rocks and dissolves in water [7]. Normally, drinking water from groundwater sources has higher concentration of radon than surface water [8].
The exposure of a population to high concentration of radon and its daughters for a long period has significant health effects ranging from respiratory functional changes to cancer of the lungs [9]. Also, a very high level of radon in drinking water can lead to stomach and gastrointestinal tract cancer [10].
Access to potable source of water has remained one of the major challenges for most people as well as animals in Loko village of Nasarawa local government area of Nasarawa state, as such, majority rely on untreated surface and ground water sources for consumption. The geology of Loko village of Nasarawa local government area of Nasarawa state revealed that it is highly enriched in clay, loamy and sandy soil and studies have shown that, high activity concentration of radon-222 is always associated with areas rich in clay soil [11], as such, the level of radon in drinking water which in high concentration, can lead to a significant risk of stomach and gastrointestinal tract cancer [12], among others, need to be investigated. This is more so because our knowledge of its level of availability could be of great help in resource planning [13].
However, in Loko village of Nasarawa local government area of Nasarawa state there is no established information on Radon activity concentration from the survey of literature despite the fact that its geology revealed that it is highly rich in clay soil. Thus, this research tends to ascertain whether Radon from water sources in Loko village of Nasarawa local government area of Nasarawa state possess a health risk to the populace or not.
2. Materials and Methods:
2.1. Materials:
The following are some of the materials used for the radon measurement;
2.2. Method:
The international standards organization procedure (ISO13164) for the measurement of the concentration of radon in water was employed in this analysis. Water flow was adjusted to avoid turbulence and air bubbles at the outlet of the tap and in the sampling container. The sampling container was filled without air bubbles below the cap after closing the container.
2.2.1. Study Area:
Loko is a town in Nasarawa Local Government Area of Nasarawa State in the middle belt region or North central zone of Nigeria.It is found along the River Benue bank. The town is a mini-port, along the river benue, for the conveyance of export materials, to the eastern and western parts of Nigeria [14]. The main ethnic groups and the inhabitants of Loko town, are the Bassa, Agatu, Igbira, Afo. Others are Nupe, Hausa and Kanuri. The main activities engaged by the inhabitants of Loko town are farming and fishing. Loko is located at 7°59′51″N 7°49′52″E. The Map of Nigeria showing study area is shown in Figure 1.
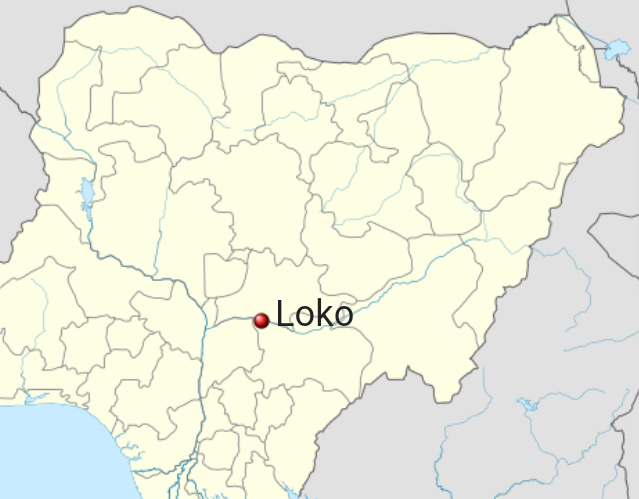
Figure 1: Map of Nigeria showing study area
2.2.2. Method of Sample Collection:
Stratified random sampling was adopted, which is a technique which attempts to restrict the possible samples to those which are ``less extreme'' by ensuring that all parts of the population are represented in the sample in order to increase the efficiency (that is to decrease the error in the estimation). A total number of twenty (30) water samples were collected across the Loko village of Nasarawa local government area of Nasarawa state from both boreholes and well water. Samples were collected in clean 1litre plastic containers with tight covers. The plastic bottles were first washed cleaned and rinsed with distilled water to avoid radon present in the samples from being contaminated or absorbed. The water samples were collected after the water was allowed to run for a few minutes. The samples were taken to the laboratory immediately after collection without allowing them to stay long (three days maximum) for analysis. This is done to achieve maximum accuracy and not to allow the composition of the sample to change.
2.2.3. Method of Sample Preparation:
10 ml each of the water samples were transferred into a 20 ml glass scintillation vial to which 10 ml of insta-gel scintillation cocktail is added. Having been sealed tightly, the vials were shaken for more than two minutes to extract radon-222 in water phase into the organic scintillate, and the sample so collected were then counted for 60 minutes in a liquid scintillation counter using energy discrimination for alpha particles.
2.2.4. Method of Sample Analysis and Counting:
The prepared samples are to be analysed using Liquid Scintillation Counter (Tri-Carb LSA 1000TR) model located at the centre for Energy Research and Training (CERT), Ahmadu Bello University, Zaria, Nigeria.
The counting was carried out immediately after the prepared samples were brought to the laboratory. The counting vial was placed in the liquid scintillation counter (LSC) and each vial was counted for 60 minutes. It was ensured that the vials were not shaken to avoid disturbing the state of equilibrium between 222Rn and its short-lived daughters in the organic scintillate. The time and date of counting were all noted.
The 222Rn concentration is to be calculated using the equation (1) according to [15].
Rn Bql-1= 1000mL (Cs- CB)10mL×1.0L (CF×D) 1
Where Rn is the Concentration of Radon, Cs is the Sample count, CB is the Background count, CF is the Calibration Factor and D is the Decay correction factor.
2.2.5. Population Sample:
As discussed in sample collection, a stratified random sampling [16] was used and in each of the 5 areas, two samples were collected with a distance of about 1/2 km between one sampling point and the other. A total of 10 samples were collected.
2.2.6. Method of Result Analysis:
2.2.6.1. Annual Effective Dose from Radon-222:
The annual effective dose is to be calculated using equation (2) according to [17].
E= Rn ×D ×L 2
Where E is the Annual effective dose by ingestion (mSv/yr), Rn is the Concentration of Radon, D is the Dose coefficient (10-5mSv/yr) and L is the Annual water consumption, 2 L/d (730L/yr).
2.2.6.2. Annual Effective Dose Due to the Ingestion of Radon-222:
Annual effective dose due to the ingestion of radon from the underground E(ing) was calculated using Equation (3), according to [18].
Eing= CRn Bql-1× Ding × Dw ×F ×T 3
where, CRn is the mean radon (222Rn) activity concentration in water, Dw is the daily water ingestion (2 L day− 1), Ding is the ingesting dose conversion factor of radon (10− 8 Sv Bq− 1), and T is equal to 365-day y−1
The Annual Effective Dose of Inhalation E(inh) of Radon-222:
The annual effective dose of inhalation E(inh) of radon from water is obtained from equation (4) according to [19]
Einh= CRn Bql-1× R × D ×F ×T 4
where, CRn is the mean radon (222Rn) activity concentration in water, R is the ratio of radon in air to radon in water (10− 4), D is the dose conversion factor of radon (9 nSvh− 1(Bq/m3))−1, F is the indoor equilibrium factor between radon and its progeny (0.4) and T is indoor time (7000 hy− 1), [20].
2.2.6.3. Excess Lifetime Cancer Risk (ELCR):
This is associated with the probability of developing cancer over a lifetime at a given exposure level. It is a value depicting the number of cancers expected in a given number of people on exposure to a carcinogen at a given dose. An increase in the ELCR causes a proportionate increase in the rate at which an individual can get cancer of the breast, prostate or even blood. Excess lifetime cancer risk (ELCR) for Ingestion and Inhalation are given according to [21] as
ELCR = AED (ing) × DL × RF (5)
And
ELCR = AED (inh) × DL × RF (6)
where, ED is the Effective Dose, DL is the average duration of life / life expectancy (estimated as 70years), and RF is the Risk Factor (Sv-1), i.e. fatal cancer risk per Sievert. For stochastic effects, International Commission on Radiological Protection (ICRP) uses RF as 0.05 Sv-1 for public [21] with the ELCR UNSCEAR standard being 0.29 x 10⁻³.
The data obtained from the laboratory for the concentration of 222Rn (Bq/l) is presented in Table 1. Table 1 presents results for Radon-222 Concentration (Rn (Bq/l)) in LK 1, LK 1, LK 2, LK 2, LK 3, LK 3, LK 4, LK 4, LK 5 and LK 5.
|
S/No. |
Sample ID |
Radon-222 Concentration (Rn (Bq/l)) |
|
1 |
LKB 1 |
4.16 ± 0.85 |
|
2 |
LKW 1 |
3.99 ± 0.85 |
|
3 |
LKB 2 |
3.71 ± 0.85 |
|
4 |
LKW 2 |
4.87 ± 0.85 |
|
5 |
LKB 3 |
2.33 ± 0.85 |
|
6 |
LKW 3 |
3.42 ± 0.85 |
|
7 |
LKB 4 |
4.03 ± 0.85 |
|
8 |
LKW 4 |
4.56 ± 0.01 |
|
9 |
LKB 5 |
4.50 ± 0.03 |
|
10 |
LKW 5 |
3.50 ± 1.61 |
|
11 |
Mean |
1.81 ± 0.76 |
Table 1: Radon-222 Concentration (Rn (Bq/l)) for LK 1, LK 1, LK 2, LK 2, LK 3, LK 3, LK 4, LK4, LK 5 and LK 5
Table 1 presents the activity concentration of radon-222 in ten (10) different water samples (borehole and well water samples for LKB 1, LKW 1, LKB 2, LKW 2, LKB 3, LKW 3, LKB 4, LKW 4, LKB 5 and LKW 5) with the mean concentration of 3.91 ± 0.76 Bq/l. The concentration varies in decreasing order as LKW 2 (4.87 ± 0.85) Bq/l > LKW 4 (4.56 ± 0.01) Bq/l > LKB 5 (4.50 ± 0.03) Bq/l > LKB 1 (4.16 ± 0.85) Bq/l > LKB 4 (4.03 ± 0.85) Bq/l > LKW 1 (3.99 ± 0.85) Bq/l > LKB 2 ( 3.71 ± 0.85) Bq/l > LKW 5 (3.50 ± 1.61) Bq/l > LKW 3 (3.42 ± 0.85) Bq/l > LKB 3 (2.33 ± 0.85) Bq/l.
4. Results Analysis:
The data presented in Table 1 are further evaluated for radiological hazard parameters such as annual effective dose by ingestion (mSv/yr), annual effective dose by inhalation (mSv/yr), excess lifetime cancer risk by ingestion and excess lifetime cancer risk by inhalation using equation (3), (4), (5) and (6) and the results are presented in Table 2.
|
S/No. |
Sample ID |
AED by Ingestion (mSv/y) |
AED by Inhalation (mSv/y) |
ELCR by Ingestion |
ELCR by Inhalation |
|
1 |
LKB 1 |
0.000055 |
1.048 |
0.00020 |
3.67 |
|
2 |
LKW 1 |
0.000052 |
1.005 |
0.00018 |
3.52 |
|
3 |
LKB 2 |
0.000049 |
0.935 |
0.00017 |
3.27 |
|
4 |
LKW 2 |
0.000064 |
1.227 |
0.00023 |
4.30 |
|
5 |
LKB 3 |
0.000031 |
0.587 |
0.00011 |
2.06 |
|
6 |
LKW 3 |
0.000043 |
0.862 |
0.00015 |
3.02 |
|
7 |
LKB 4 |
0.000053 |
1.016 |
0.00019 |
3.55 |
|
8 |
LKW 4 |
0.000059 |
1.149 |
0.00022 |
4.02 |
|
9 |
LKB 5 |
0.000057 |
1.134 |
0.00021 |
3.97 |
|
10 |
LKW 5 |
0.000045 |
0.882 |
0.00016 |
3.09 |
|
11 |
Mean |
0.000051 |
0.985 |
0.00018 |
3.45 |
Table 2: Annual Effective Dose by Ingestion, Annual Effective Dose by Inhalation, Excess Lifetime Cancer Risk by Ingestion and Excess Lifetime Cancer Risk by Inhalation for LKB 1, LKW 1, LKB 2, LKW 2, LKB 3, LKW 3, LKB 4, LKW 4, LKB 5 and LKW 5
Table 2 also presents the annual effective dose by ingestion of radon-222 in ten (10) different water samples (borehole and well water samples for LKB 1, LKW 1, LKB 2, LKW 2, LKB 3, LKW 3, LKB 4, LKW 4, LKB 5 and LKW 5) with the mean annual effective dose by ingestion of 0.000051 mSv/yr. The annual effective dose by ingestion varies in decreasing order as LKW 2 (0.000064) mSv/yr > LKW 4 (0.000059) mSv/yr > LKB 5 (0.000057) mSv/yr > LKB 1 (0.000055) mSv/yr > LKB 4 (0.000053) mSv/yr > LKW 1 (0.000052) mSv/yr > LKB 2 (0.000049) mSv/yr > LKW 5 (0.000045) mSv/yr > LKW 3 (0.000043) mSv/yr > LKB 3 (0.000031) mSv/yr.
Table 2 also presents the annual effective dose by inhalation of radon-222 in ten (10) different water samples (borehole and well water samples for LKB 1, LKW 1, LKB 2, LKW 2, LKB 3, LKW 3, LKB 4, LKW 4, LKB 5 and LKW 5) with the mean annual effective dose by inhalation of 0.985 mSv/yr. The annual effective dose by inhalation varies in decreasing order as LKW 2 (1.227) mSv/yr > LKW 4 (1.149) mSv/yr > LKB 5 (1.134) mSv/yr > LKB 1 (1.048) mSv/yr > LKB 4 (1.016) mSv/yr > LKW 1 (1.005) mSv/yr > LKB 2 (0.935) mSv/yr > LKW 5 (0.882) mSv/yr > LKW 3 (0.862) mSv/yr > LKB 3 (0.587) mSv/yr.
Table 2 also presents the excess lifetime cancer risk by ingestion of radon-222 in ten (10) different water samples (borehole and well water samples for LKB 1, LKW 1, LKB 2, LKW 2, LKB 3, LKW 3, LKB 4, LKW 4, LKB 5 and LKW 5) with the mean excess lifetime cancer risk by ingestion of 0.00018. The excess lifetime cancer risk by ingestion varies in decreasing order as LKW 2 (0.00023) > LKW 4 (0.00022) > LKB 5 (0.00021) > LKB 1 (0.00020) > LKB 4 (0.00019) > LKW 1 (0.00018) > LKB 2 (0.00017) > LKW 5 (0.00016) > LKW 3 (0.00015) > LKB 3 (0.00011).
Table 2 also presents the excess lifetime cancer risk by inhalation of radon-222 in ten (10) different water samples (borehole and well water samples for LKB 1, LKW 1, LKB 2, LKW 2, LKB 3, LKW 3, LKB 4, LKW 4, LKB 5 and LKW 5) with the mean excess lifetime cancer risk by inhalation of 3.45. The excess lifetime cancer risk by inhalation varies in decreasing order as LKW 2 (4.3) > LKW 4 (4.02) > LKB 5 (3.97) > LKB 1 (3.67) > LKB 4 (3.55) > LKW 1 (3.52) > LKB 2 (3.27) > LKW 5 (3.09) > LKW 3 (3.02) > LKB 3 (3.06).
4.1. Comparison of Results with World Health Organization:
In this section, the results in Table 1 and 2 are used to plot charts in order to compare the results of the present study with World Health Organization.
4.1.1. Comparison of Radon-222 Concentration for LKB 1, LKW 1, LKB 2, LKW 2, LKB 3, LKW 3, LKB 4, LKW 4, LKB 5 and LKW 5 with World Health Organization:
The data presented in Table 1 was used to plot a chart in order to compare the results with World Health Organization. This chart is presented in Figure 2.
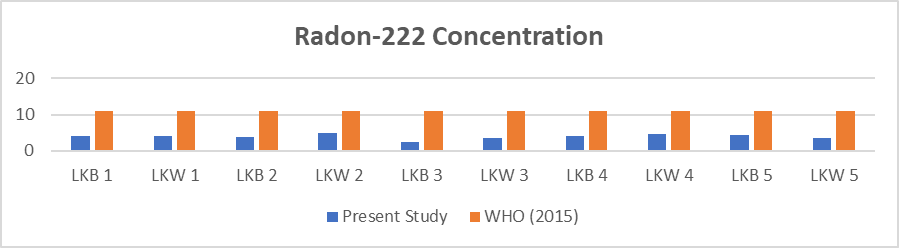
Figure 2: Comparison of Radon-222 Concentration for LKB 1, LKW 1, LKB 2, LKW 2, LKB 3, LKW 3, LKB 4, LKW 4, LKB 5 and LKW 5) with World Health Organization
From figure 2, it can be seen obviously that, values for the radon-222 concentration in all samples were found to be lower than the World Health Organization recommended limit of 11.1 Bq/l.
4.1.2. Comparison of Annual Effective Dose by Ingestion for LKB 1, LKW 1, LKB 2, LKW 2, LKB 3, LKW 3, LKB 4, LKW 4, LKB 5 and LKW 5 with World Health Organization:
The data presented in Table 2 was used to plot a chart in order to compare the results with World Health Organization. This chart is presented in Figure 3.
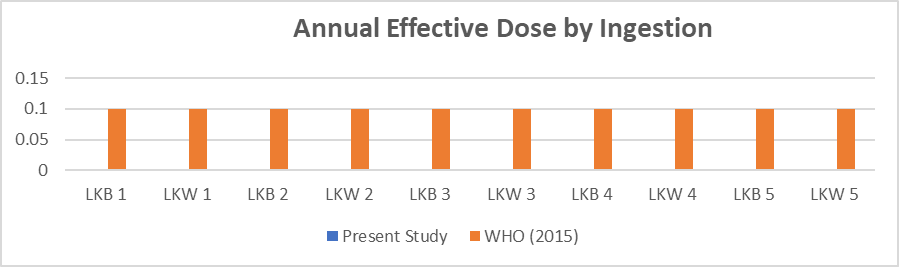
Figure 3: Comparison of Annual Effective Dose by Ingestion for LKB 1, LKW 1, LKB 2, LKW 2, LKB 3, LKW 3, LKB 4, LKW 4, LKB 5 and LKW 5 with World Health Organization
It can be seen from figure 2 that, all values for the annual effective dose due to ingestion in all locations were found to be lower than the World Health Organization recommended limit of 0.1 mSv/yr.
4.1.3. Comparison of Annual Effective Dose by Inhalation for LKB 1, LKW 1, LKB 2, LKW 2, LKB 3, LKW 3, LKB 4, LKW 4, LKB 5 and LKW 5 with World Health Organization:
The data presented in Table 2 was used to plot a chart in order to compare the results with World Health Organization. This chart is presented in Figure 4.
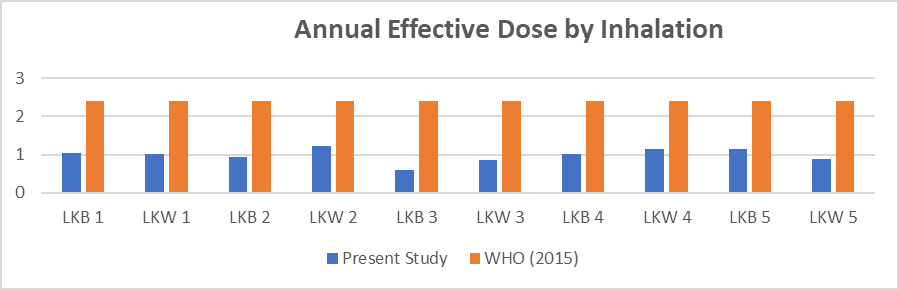
Figure 4: Comparison of Annual Effective Dose by Inhalation for LKB 1, LKW 1, LKB 2, LKW 2, LKB 3, LKW 3, LKB 4, LKW 4, LKB 5 and LKW 5 with World Health Organization
It can be seen clearly from figure 4.5 that, values for the Annual Effective Dose due to Inhalation in all sample locations were found to be lower than the World Health Organization recommended limit of 2.4 mSv/yr.
4.1.4. Comparison of Excess Lifetime Cancer Risk by Ingestion for LKB 1, LKW 1, LKB 2, LKW 2, LKB 3, LKW 3, LKB 4, LKW 4, LKB 5 and LKW 5 with World Health Organization:
The data presented in Table 2 was used to plot a chart in order to compare the results with World Health Organization. This chart is presented in Figure 5.
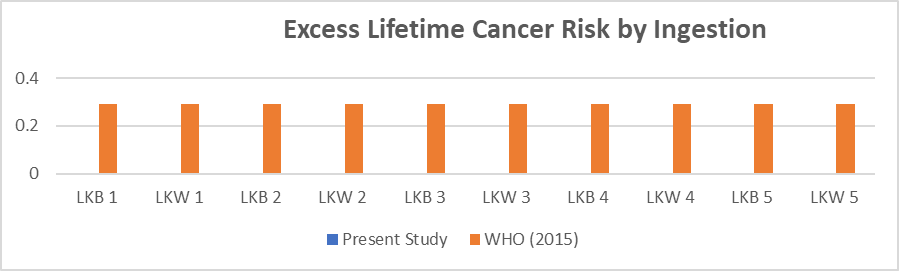
Figure 5: Comparison of Excess Lifetime Cancer Risk by Ingestion for LKB 1, LKW 1, LKB 2, LKW 2, LKB 3, LKW 3, LKB 4, LKW 4, LKB 5 and LKW 5 with World Health Organization
It can be seen from figure 4.6 that, all values for the Excess Lifetime Cancer Risk due to Ingestion in all locations were found to be lower than the World Health Organization recommended limit of 0.29 x 10⁻³.
4.1.5. Comparison of Excess Lifetime Cancer Risk by Inhalation for LKB 1, LKW 1, LKB 2, LKW 2, LKB 3, LKW 3, LKB 4, LKW 4, LKB 5 and LKW 5 with World Health Organization:
The data presented in Table 2 was used to plot a chart in order to compare the results with World Health Organization. This chart is presented in Figure 6.
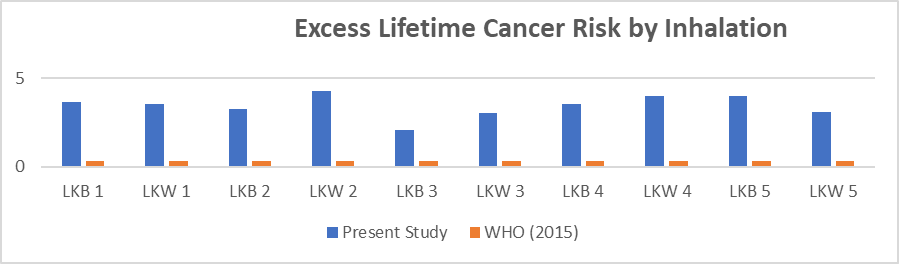
Figure 6: Comparison of Excess Lifetime Cancer Risk by Inhalation for LKB 1, LKW 1, LKB 2, LKW 2, LKB 3, LKW 3, LKB 4, LKW 4, LKB 5 and LKW 5 with World Health Organization
It can be seen from figure 6 that, all values for the Excess Lifetime Cancer Risk due to Inhalation in all locations were found to be higher than the World Health Organization recommended limit of 0.29 x 10⁻³.
4.2. Discussion:
The results of the Assessment of Radon-222 (222Rn) Concentration in Drinking Water Sources across Loko village of Nasarawa local government area of Nasarawa state, Nigeria using Liquid Scintillation Counter have been presented in Table 1 which were later used to evaluate the Annual Effective Dose by Ingestion, Annual Effective Dose by Inhalation, Excess Lifetime Cancer Risk by Ingestion and Excess Lifetime Cancer Risk by Inhalation presented in Table 2.
Table 1 presents the activity concentration of radon-222 in ten (10) different water samples (borehole and well water samples) in LKB 1, LKW 1, LKB 2, LKW 2, LKB 3, LKW 3, LKB 4, LKW 4, LKB 5 and LKW 5.
Table 2 presents the annual effective dose and excess lifetime cancer risk by ingestion and inhalation of radon-222 in ten (10) different water samples (borehole and well water samples) in LKB 1, LKW 1, LKB 2, LKW 2, LKB 3, LKW 3, LKB 4, LKW 4, LKB 5 and LKW 5.
Finding of this study have revealed that the mean concentration of radon-222 for Loko water samples is 3.91 ± 0.76 Bq/l. Which implies that the level of radon-222 concentration in those areas is lower than 11.1 Bq/l as agreed by Basic Safety Standard (BSS) and may not cause radiological hazard to the inhabitants.
On Annual Effective Dose by Ingestion, finding of this study has revealed that the mean Effective Dose by Ingestion for Loko water samples is 0.000051 mSv/yr. This implies that the level of Annual Effective Dose by Ingestion in those areas is extremely lower than 0.1 mSv/yr as agreed by Basic Safety Standard (BSS) and may not cause radiological hazard to the workers, though very dangerous when accumulated over years.
On Annual Effective Dose by Inhalation, finding of this study has revealed that the mean Effective Dose by Inhalation for Loko area is 0.985 mSv/yr. This implies that the level of Effective Dose by Inhalation in those areas is extremely lower than 2.4 mSv/yr as agreed by Basic Safety Standard (BSS) and may not cause radiological hazard to the inhabitants, though very dangerous when accumulated over years.
On Excess Lifetime Cancer Risk by Ingestion, finding of this study has revealed that the mean Excess Lifetime Cancer Risk by Ingestion for Loko area is 0.00018 x 10⁻³. Which implies that the level of Excess Lifetime Cancer Risk by Ingestion in those areas is significantly lower than 0.29 x 10⁻³ as agreed by Basic Safety Standard (BSS) and may not cause cancer to the inhabitants when ingested by adults on approaching their ages of 70.
On Excess Lifetime Cancer Risk by Inhalation, finding of this study has revealed that the mean Excess Lifetime Cancer Risk by Inhalation for Loko area is 3.45 x 10⁻³. Which implies that the level of Excess Lifetime Cancer Risk by Inhalation in those areas is significantly higher than 0.29 x 10⁻³ as agreed by Basic Safety Standard (BSS) and may cause cancer to the inhabitants when inhaled for the period of 70 years.
5. Conclusion:
The present study showed that the radon concentration in the water samples from Loko has been found to have an average mean 222Rn concentration of 3.91 ± 0.76 Bq/l which is lower than the maximum limit of 11.1 Bq/l set by WHO (2015). The mean annual effective dose due to ingestion and inhalation was found to be 0.000051 mSv/y and 0.985 mSv/yr respectively. The value is lower than the recommended limit of 0.1 mSv/y for ingestion and higher than the recommended limit of 2.4 mSv/y for inhalation. The mean excess lifetime cancer risk due to ingestion and inhalation was found to be 0.00018 x 10⁻³ mSv/y and 3.45 x 10⁻³ respectively. The value is lower than the recommended limit of 0.29 x 10⁻³ for ingestion and higher than the recommended limit of 0.29 x 10⁻³ for inhalation. The results showed the samples from underground water (boreholes and well) are not safe for children consumption even though good for adults. Hence, the data obtained in this study could be used for the study location, since this work pioneer the determination of radon in water sources in the study location. From the findings presented, it can be concluded that natural radionuclides pollution in Loko are an issue of health concern.
It is therefore recommended that proper radiation monitoring exercise should be conducted on the processing sites from time to time in order to safeguard the inhabitant from high radon-222 exposure due to direct inhalation and ingestion from water.

Open Access By Aditum Open Access Journals id licensed under Creative Commons Attribution 4.0 International License. Based On a Work at aditum.org