Clinical Case Reports and Clinical Study
OPEN ACCESS | Volume 13 - Issue 1 - 2026
ISSN No: 2766-8614 | Journal DOI: 10.61148/2766-8614/JCCRCS


Swastika Roy1, Jayita Roy Ghoshal2*, Jyoti Ratan Ghosh3
1Former Research Scholar, Department of Anthropology, Visva-Bharati, WB, India.
2Assistant Professor in Anthropology, Narasinha Dutt College, Howrah, WB, India.
3Assistant Professor, Department of Anthropology, Visva-Bharati University, Santiniketan-731235, West Bengal, India.
*Corresponding Author: Jayita Roy Ghoshal, Assistant Professor in Anthropology, Narasinha Dutt College, Howrah, WB, India.
Received: March 01, 2023
Accepted: March 06, 2023
Published: March 08, 2023
Citation: Swastika Roy, Jayita Roy Ghoshal, Jyoti Ratan Ghosh (2023) “A Study On socio demographic variables associated with Anthropometric Variables And Blood Pressure Levels In Santal Women”, Clinical Case Reports and Clinical Study, 2(9); DOI: http;//doi.org/03.2023/1.166.
Copyright: © 2023 Jayita Roy Ghoshal. This is an open access article distributed under the Creative Commons Attribution License, which permits unrestricted use, distribution, and reproduction in any medium, provided the original work is properly Cited.
Background: The global burden of diseases and associated risk factors in developing countries has altered radically over the past decades with a clear shift from communicable to non- communicable diseases. Hypertension is a major and probably increasing blood pressure as well as HT is the important risk factors of cardiovascular disease.
Objective: This Study was undertaken to study on socio-demographic variables association with anthropometric variables and blood pressure levels in Santhal Women.
Method: A cross-sectional study was carried out in 100 adult females aged above 18 years were incorporated. This study was undertaken in the Baganpara village of Bolpur, under the Birbhum District. Anthropometric measurements included height, weight, Mid upper arm circumference (MUAC), Minimum Waist circumference (MWC) and Maximum Hip circumference (MHC). Body mass index (BMI, kg/m2), Waist hip ratio (WHR) were calculated subsequently. Systolic blood pressure (SBP) and Diastolic blood pressure (DBP) were also taken. The correlation analysis was made to determine the relationship of anthropometric variables with blood pressure.
Results: However the result of the present study in adult Santhal females revealed that the mean age was 36.86(±15.6) yrs. However the mean height, weight, MUAC, MWC, MHC, BMI, WHR were 151.8 (± 4.63) cm, 43.2 (±6.07) kg, 23.6 (±2.14) cm, 70.7 (±7.46) cm, 84.34 (±7.39) cm, 18.7(±2.17) kg/m2 and 0.83 (±0.03) cm. Moreover the mean of SBP and DBP were 112(±13.0) mmHg and 76.2(±6.94) mmHg. There was no significant (P>0.05) association of socio-economic variables with blood pressure. Moreover, there was significant (P<0.05) positive correlation of MUAC, MWC, MHC with SBP. On the other hand, DBP was significantly (P<0.05) and positively correlated with MUAC, MWC & WHR.
Conclusion: The present study in Sathal Women of Birbhum district revealed that, the association of socio-demographic variables with blood pressure and there was no significant (p>0.05) association of alcohol consumption, tobacco consumption, food habit, residential status, educational status and occupational status with blood pressures in adult Santal women. It was also revealed that positive correlation of age and monthly household income with SBP and DBP.
Introduction
The global burden of diseases and associated risk factors in developing countries has altered radically over the past decades with a clear shift from communicable to non-communicable diseases (Abdulle et al., 2014). Hypertension is now accepted globally as a major public health problem (Wan et al., 2009) in terms of a well-known risk factor for non-communicable diseases (NCDs) like cardiovascular disease (CVD), type 2 diabetes mellitus and renal disease (Monyeki et al., 2006).
For decades, arterial hypertension was considered as a typical disease of adulthood, related with aging and accompanying with other clinically evident diseases like diabetes, ischemic heart disease and chronic kidney disease (Litwin and Kułaga, 2015). Interestingly, not only in adults, hypertension in children and adolescents are also becoming a growing heath problem (Riley and Bluhm, 2012) with increasing prevalence and rate of diagnosis (Luma and Spiotta, 2006). Moreover, the negative and potentially severe consequences of hypertension as observed in adults were also detected in children (Lande et al., 2006; Drukteinis et al., 2007; Lande et al., 2009).
Blood pressure refers to the force exerted by circulating blood on the walls of the arteries. Blood pressure is classified into two types, SBP and DBP. The SBP is defined as the peak pressure in the arteries (which occurs near the beginning of the cardiac cycle) and the DBP is the lowest pressure (at the resting phase of the cardiac cycle). Epidemiologic and clinical studies have disclosed that a number of anthropometrically measurable attributes of the human body can be related to the risk of developing metabolic disorders and various illnesses. The commonly reported statistical association between different anthropometric variables like Body Mass Index (BMI), Waist Circumference (WC), Waist Hip Ratio (WHR) and poor health may reflect a direct link among overweight, obesity, adipose tissue distribution and disease. Alternatively, obesity or abdominal obesity and adipose tissue distribution may indicate a cumulative exposure to environmental or lifestyle related behavioral factors. Such factors may directly influence the risk of disease among genetically susceptible individuals. Whether direct or indirect, the association seems to be real and provides opportunities for prevention through individuals and community interventions (Seidell et al., 2001). Number of studies focused on identifying the anthropometric characteristics as the most predictive of disease risk. Body size, frame, adipose tissue patterning, and body composition measures are the key aspects in this regard (Lohman et al., 1988), as these are easy and relatively inexpensive and non-invasive to measure and also easy to monitor over time (Seidell et al., 2001).
In India several studies on nutritional status have been done, however most of them use BMI as an anthropometric indicator for nutritional status. However, some studies also considered MUAC to understand the nutritional status. In a recent study by Chakraborty et al. (2009), among the adult Bengalee male slum dwellers of Kolkata, observed that the overall prevalence of thinness was 32.3%. (Chakrobarty, et al. 2009). In another recent study in the adult population of Raika Community in Jodhpur Singh et al. (2009) found the prevalence of thinness was 51.2 and 37.0 % in males and females respectively. In a cross-sectional study was by Bose et al. (2006) in adult Santal males in Keonjhar District of Orissa, found high prevalence of thinness with a frequency of 26.2%, 3.3%, 3.9% and 19.0% has grades ІІІ, ІІ & І & CED, respectively. According to MUAC cutoff points, the prevalence of undernutrition was 33.7%.
It was revealed that racial disparities observed in BP were determined by differences in education level (Non et.al., 2012). According to Holmes et.al in 2013 and Kaplan et.al in 2010, educational level and family income are socio-economic variables that have been well examined in relation with hypertension. ( Holmes et.al., 2013; Non et.al., 2012; Kaplan et.al., 2010).
Objectives
In view of the above, the present work was undertaken among the adult Santal women of Baganpara, Santiniketan, and West Bengal with the following objectives:
Material and Methods
The present study was conducted in adult Santal women. Santals speak Santali, which belongs to the Austro-Asiatic language family. The study was undertaken in the Baganpara village of Bolpur, under the Birbhum District. This study was cross-sectional; each individual was measures only once.
The Baganpara is a mono-ethnic population inhabited by the Santal. The total population of this Santal village is 356. They are endogamous. Of the 12 clans of Santals we get 7 clans. The clan Soren and Marandi exhibits the highest number of individuals and the clan Tudu exhibits the lowest number. Maximum people of this village are engaged in Daily labour. Of these 356 individuals, 184 are males and 172 are female. However, for the present work only adult females aged above 18 years were incorporated. Thus, the total sample was 100 adult female.
Socio-demographic variables
Socio-demographic variables include ethnicity, occupation, education, migration, monthly household income, tobacco, alcohol consumption and food habit. These were measured using pre-tested schedule. Age was ascertained by using questionnaire.
Anthropometric measurements namely height, weight and circumference measurements at mid upper arm, minimum waist and maximum hip were obtained following standard techniques (Weiner & Lourie, 1981). In brief, in order to measure height each subject was instructed to stand perfectly straight with his arms relaxed by sides and ankles or knee together. The subject’s head was positioned in the Frankfurt plane and the anthropometer was positioned behind the subject so that its lower ends stands between the heels and the beam passes vertically between the buttocks touching the back of the head. The subjects were asked to inhale deeply and maintain a fully erect position without altering the load on the heels. The movable rod was then brought onto the most superior point on the head with sufficient pressure to compress the hair. The body weight of lightly cloth subjects was recorded from the scale of the weighing machine. To measure mid upper arm circumference, the subjects arm hangs in relaxed condition just away from his/her side and the circumference is taken horizontally at the marked level.
Body mass index: Body mass index (BMI) was computed as weight in kg divided by height in meter squared (kg/m2).
BMI (Body mass index) = weight (kg)/height (m2)
Physiological variable
The term blood pressure usually refers to the pressure measured at a perosn’s upper arm. It is measured on the inside of an elbow at the brachial artery, which is the upper arm’s major blood vessel that carries blood away from the heart. A person’s blood pressure is usually expressed in terms of the systolic pressure and diastolic pressure. The systolic pressure is the maximum pressure in an artery at the moment when the heart is beating and pumping blood through the body. The diastolic pressure is the lowest pressure in an artery in the moments b/w hearts when the heart is resting. Left arm blood pressure was taken from participants with the help of a sphygmomanometer and stethoscope. To obtain blood pressure each participant was requested to set at least 5 minute in complete relaxed mood on a chair and was also requested not to change her posture during that relaxation period. After the completion of the relaxation period each subject was requested to place her left arm in front of her and which (table) was set at the level of the heart of the subject. The blood pressure measurements were taken in a quite room and at the room temperature.
Statistical Analysis
Descriptive statistics includes mean, standard deviation and frequency distribution. Inferential statistics include Pearson correlation coefficient.
Results
Table 1 – Shows the socio-demographic characteristics of the studied population, with regard to the occupational status, 27% are engaged in daily labor activity followed by agriculture 1%, sericulture 2%, rice mill labor 2% and 68% engaged in other occupational activities including house wife. However with regard to the educational status 67% adult females are illiterate, followed by 20% for primary, 10% and 3% females have passed secondary and higher secondary, respectively. With regards to the migration status 52% females are born and brought up in this village and 48% migrated from outside the village. In the studied population 98% females are non-vegetarian and only 2% females are vegetarian. Most of the adult females 74% are non smoker, however 10% used tobacco by chewing and 16% is smoker. Like tobacco consumption, most of the females are not addicted by alcohol. 56% females never drink alcohol. However 21% females drink alcohol occasionally and only 12% and 11% females drink alcohol daily and frequently, respectively.
Table 2 - shows the mean and standard deviation of age and anthropometric variables in the adult Santal female. The mean age was 36.86 (SD± 15.6) years. However the mean height, weight, MUAC, MWC MHC, BMI and WHR are 151.8 (± 4.63) cm, 43.2(± 6.07) kg, 23.6(± 2.14) cm, 70.7(± 7.46) cm, 84.34 (± 7.39) cm, 18.7 (± 2.17) kg/m² and 0.83 (± 0.03) cm, respectively.
Table 3 - shows the mean and standard deviation of physiological variables in terms of SBP and DBP, in the adult Santal female. The mean SBP and DBP are 112 (± 13.0) and 76.2 (± 6.94), respectively.
Table 4 - shows the comparison of blood pressure level by food habit in the adult santal Women. The mean SBP and DBP of Vegetarian and Non-Vegetarian are 95 (± 7.07), 70 mmHg and 112 (± 12.8), 76.3 (± 6.94) mmHg, respectively.
Table 5 - shows the comparison of blood pressure level between resident and immigrant adult Santal women. The mean SBP and DBP of resident and immigrant women are 109.6 (± 11.5), 112.9 (± 13.9) mmHg and 75.3 (± 5.76), 76.4 (± 7.57) mmHg, respectively.
Table 6- Shows mean and standard deviation of physiological variables in terms of SBP and DBP by educational status in the adult Santal women. The mean SBP and DBP of illiterate, primary and secondary including higher secondary are 112.2 (± 14.5), 111.5(± 10.8), 108.4 (± 6.88) mmHg and 76.4 (± 7.11), 75.5 (± 7.59) and 76.1 (± 5.06) mmHg, respectively.
Table 7 - Shows the comparison of blood pressure level in terms of SBP and DBP by the occupational status in the adult Santal women. The mean SBP and DBP of Labour and others are 112.2 (± 8.79), 111.02 (± 14.6) mmHg and 75.9 (± 6.14), 76.1(± 7.12) mmHg, respectively.
Correlation of age and monthly household income with SBP and DBP in adult Santal women are presented in table 8 . The results revealed positive correlation of age and monthly household income with SBP and DBP. However, none of these were significantly correlated with both SBP and DBP. Age explained 3.6% of variance SBP.
Relationship of anthropometric variables namely height, weight, MUAC. MWC, MHC, BMI, WHR with SBP and DBP in adult female are presented in table 9. The results revealed positive correlation of anthropometric variables with SBP and DBP. The results revealed significant (P<0.05) positive correlation of MUAC, MWC and MHC with SBP. However, there was no significant (P>0.05) correlation of height, weight, BMI and WHR with SBP. On the other hand, DBP was significantly (P<0.05) and positively correlated with MUAC, MWC and WHR. Results also revealed lack of significant (P>0.05) correlation between height, weight, MHC, BMI and DBP.
Moreover, the result also revealed that MUAC, MWC and MHC explained 9.6%, 6.2% and 6.4% variance of SBP respectively, while BMI, WHR, weight and height explained 0.5%, 1.3%, 1.6%, and 1.9% of variance of DBP, respectively. On the other hand, MUAC, MWC, WHR and height explained 6.6%, 4.9%, 4.2% and 4.0% of variance of DBP, respectively, while BMI, weight, MHC explained 0.5%, 2.4% and 3.1% of variance of DBP, respectively.
Table 1. Socio-demographic characteristics of the studied population.
|
Variables |
N |
% |
|
A :Occupation |
|
|
|
Daily labour |
27 |
27 |
|
Agricultural Labour |
1 |
1 |
|
Sericulture Labour |
2 |
2 |
|
Rice Mill |
2 |
2 |
|
Others |
68 |
68 |
|
B : Education |
|
|
|
Illiterate |
67 |
67 |
|
Primary |
20 |
20 |
|
Secondary |
10 |
10 |
|
Higher Secondary |
3 |
3 |
|
C : Migration |
|
|
|
Resident |
52 |
52 |
|
Immigrant |
48 |
48 |
|
D : Food Habit |
|
|
|
Veg |
2 |
2 |
|
Non-veg |
98 |
98 |
|
E : Tobacco Consumption |
|
|
|
Smoking |
16 |
16 |
|
Chewing |
10 |
10 |
|
Non-smoker |
74 |
74 |
|
F : Alcohol Consumption |
|
|
|
Daily |
12 |
12 |
|
Frequently |
11 |
11 |
|
Occasionally |
21 |
21 |
|
Never |
56 |
56 |
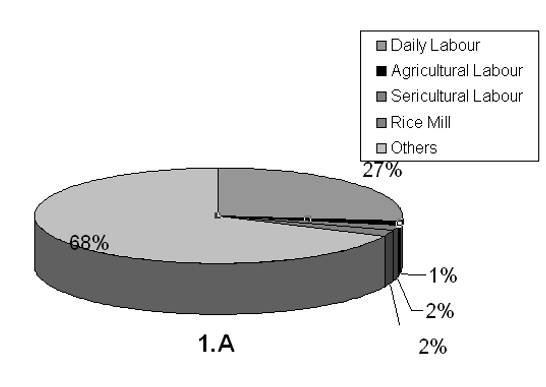
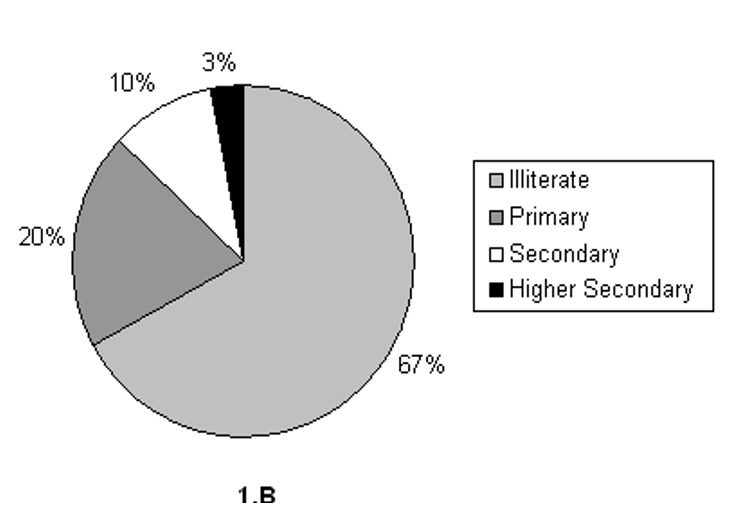
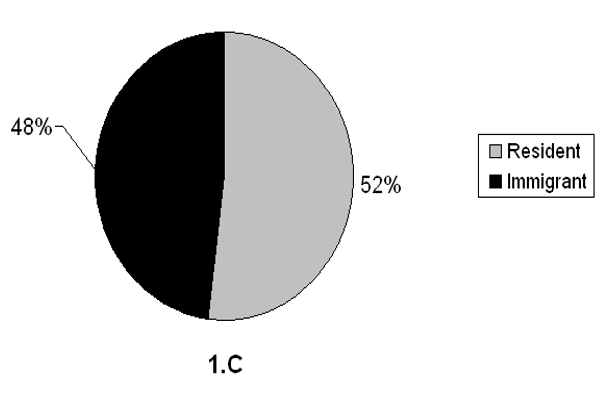
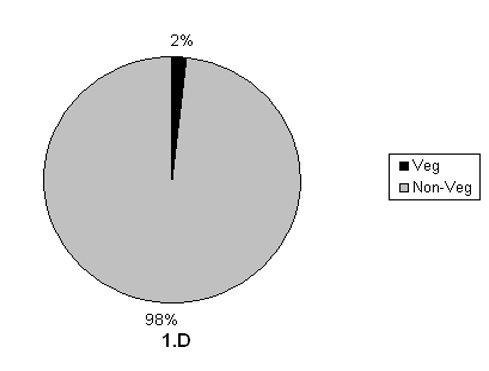
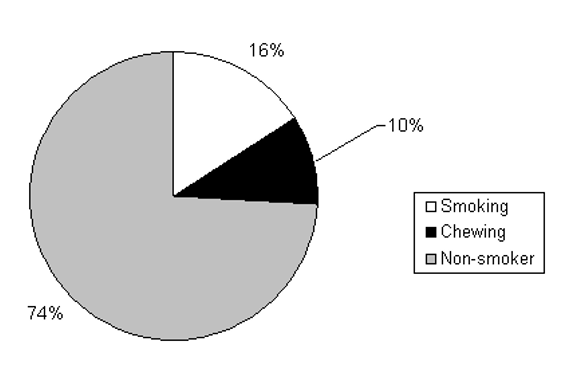
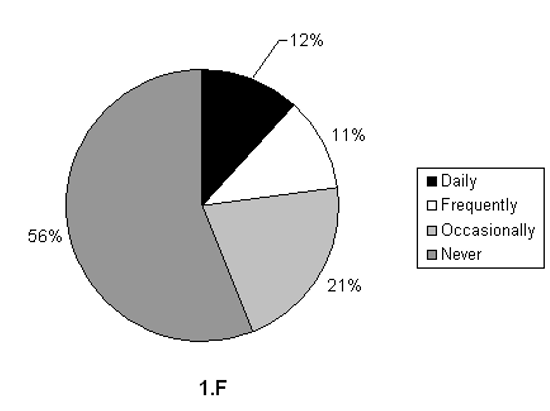
Figure 1. Socio-demographic characteristics of the studied population.
Table 2. Mean and SD of age and anthropometric variables in the studied population.
|
Variables |
Mean |
SD |
|
Age (Yrs) |
36.86 |
15.6 |
|
Height (cm) |
151.8 |
4.63 |
|
Weight (Kg.) |
43.2 |
6.07 |
|
MUAC (cm) |
23.6 |
2.14 |
|
|
|
|
|
MWC (cm) |
70.7 |
7.46 |
|
MHC (cm) |
84.34 |
7.39 |
|
BMI (Kg./m²) |
18.7 |
2.17 |
|
WHR |
0.83 |
0.03 |
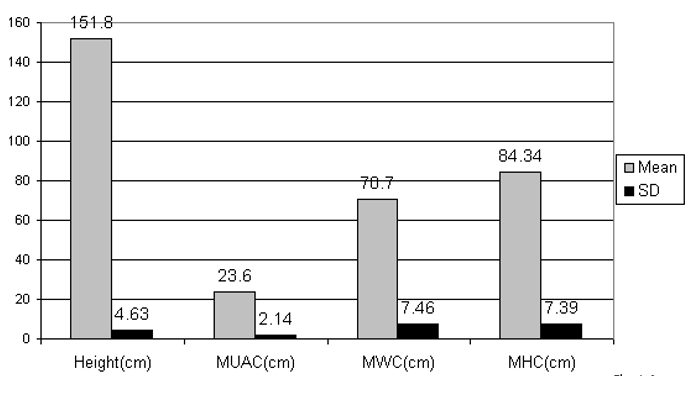
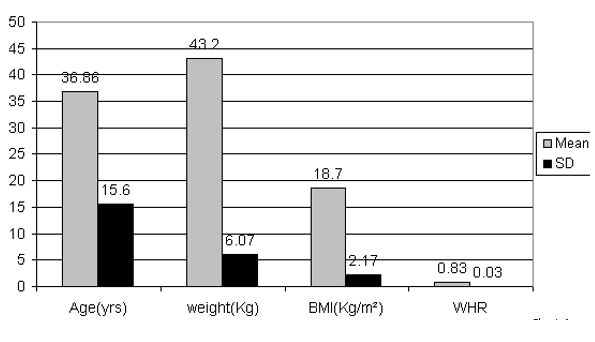
Figure 2. Mean and SD of age and anthropometric variables in the studied population.
Table 3. Mean and SD of systolic and diastolic blood pressure in the studied population.
|
Variable |
Mean |
SD
|
|
SBP(mm/Hg) |
112 |
13.0 |
|
DBP(mm/Hg) |
76.2 |
6.94 |
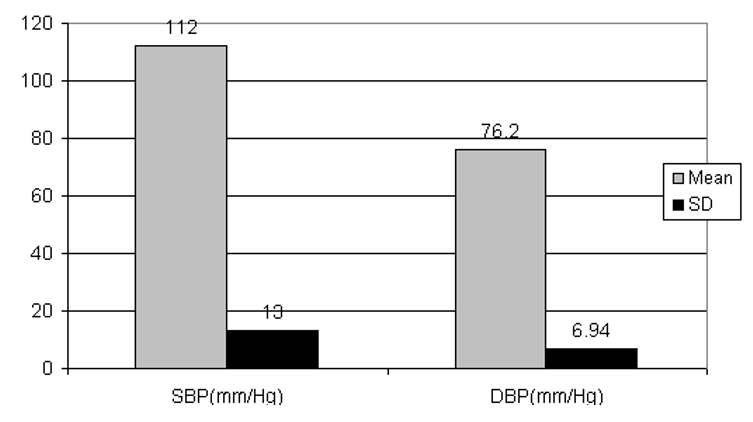
Figure 3. Mean and SD of systolic and diastolic blood pressure in the studied population.
Table 4. Food habit and blood pressure
|
Variable |
SBP |
DBP |
||
|
|
Mean |
SD |
Mean |
SD |
|
Vegetarian |
95 |
7.07 |
70 |
0 |
|
Non-Vegetarian |
112 |
12.8 |
76.3 |
6.94 |
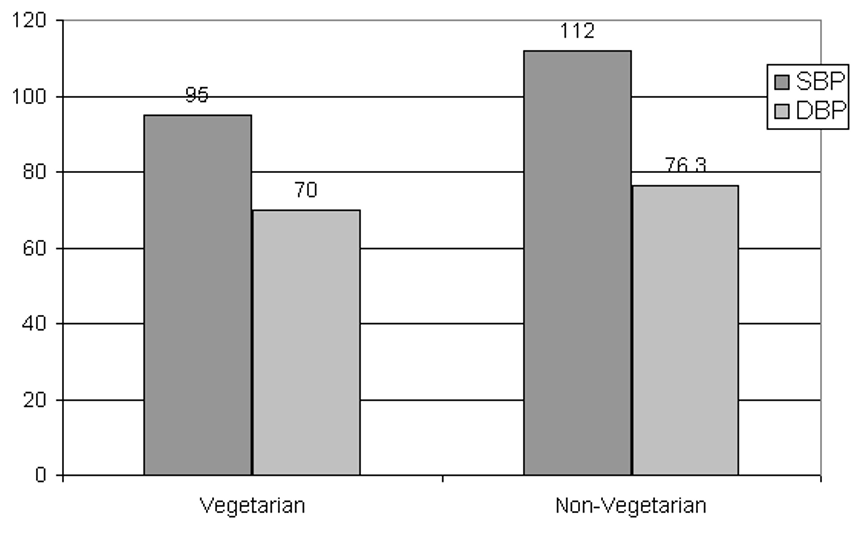
Figure 4. Food habit and blood pressure
Table –5. Migration & Blood pressure
|
Variable |
SBP |
DBP |
||
|
|
Mean |
SD |
Mean |
SD |
|
Resident |
109.6 |
11.5 |
75.3 |
5.76 |
|
Immigrant |
112.9 |
13.9 |
76.4 |
7.57 |
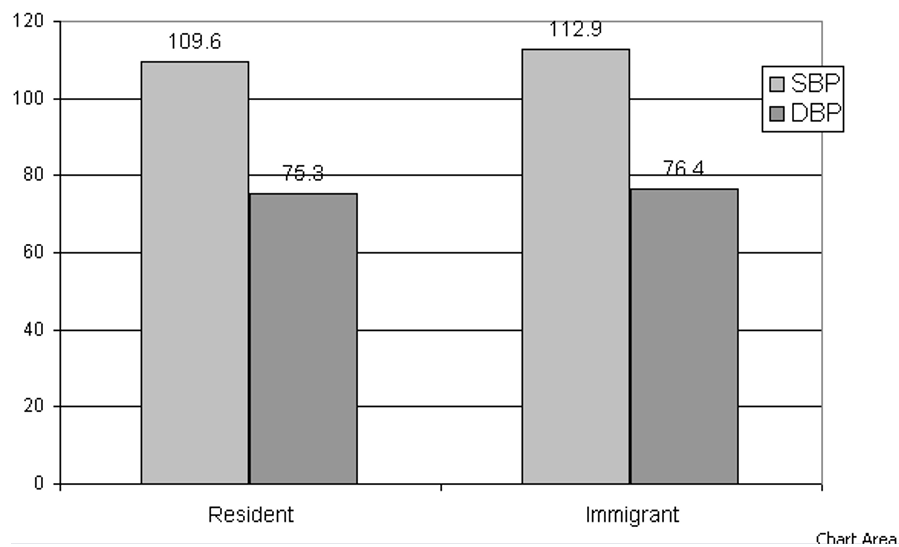
Table 6. Educational status and blood pressure
|
Variable |
SBP |
DBP |
||
|
|
Mean |
SD |
Mean |
SD |
|
Illiterate |
112.2 |
14.5 |
76.4 |
7.11 |
|
Primary |
111.5 |
10.8 |
75.5 |
7.59 |
|
Secondary and Higher Secondary |
108.4 |
6.88 |
76.1 |
5.06 |
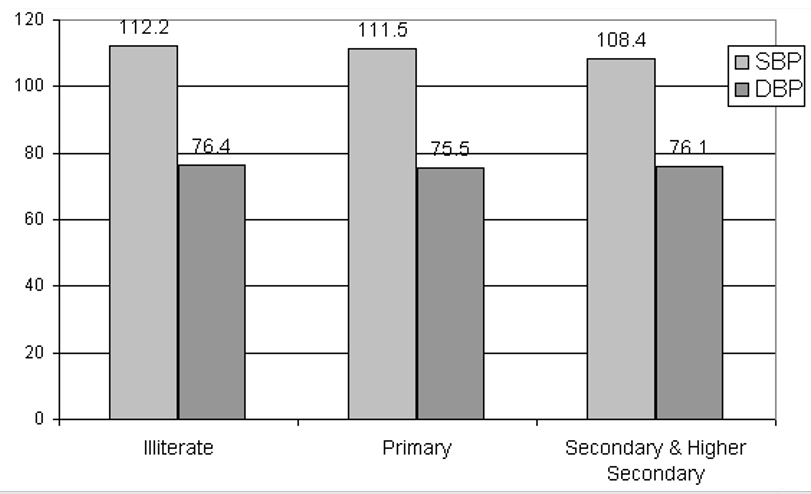
Figure 6. Educational status and blood pressure
Table 7. Occupational status and blood pressure
|
Variable |
SBP |
DBP |
||
|
|
Mean |
SD |
Mean |
SD |
|
Labor |
112.2 |
8.79 |
75.9 |
6.14 |
|
Others |
111.02 |
14.6 |
76.1 |
7.12 |
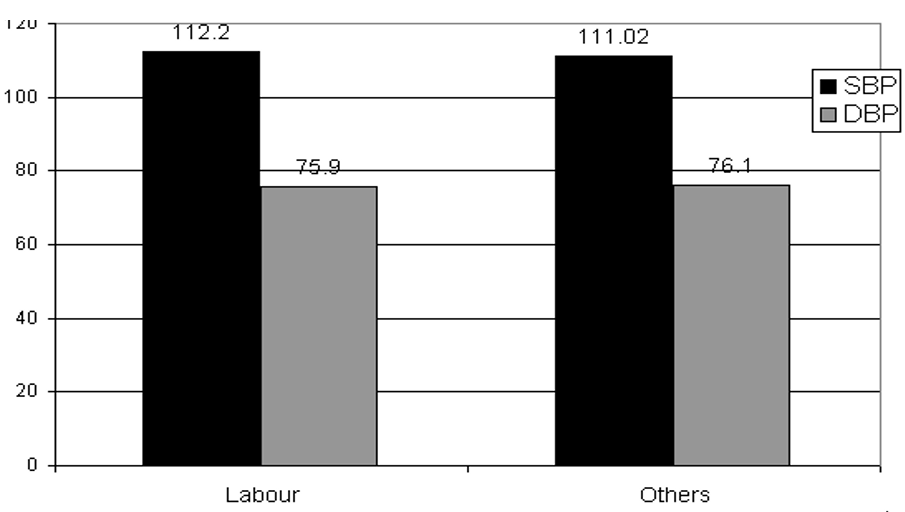
Table 8. Relationship of age and household income with systolic and diastolic blood pressures
|
Variable |
SBP |
DBP |
||||
|
|
r |
r² |
P |
r |
r² |
p |
|
Age |
0.190 |
0.036 |
>0.05 |
0.027 |
0.00072 |
>0.05 |
|
Monthly Household income |
0.007 |
0.000049 |
>0.05 |
0.089 |
0.0079 |
>0.05 |
Table 9. Relationship of anthropometric variables with systolic and diastolic blood pressures
|
Variables |
SBP |
DBP |
||||
|
|
r |
r² |
P |
r |
r² |
p |
|
Height |
0.140 |
0.019 |
>0.05 |
0.200 |
0.040 |
>0.05 |
|
Weight |
0.127 |
0.016 |
>0.05 |
0.155 |
0.024 |
>0.05 |
|
MUAC |
0.311 |
0.096 |
<0.05 |
0.258 |
0.066 |
<0.05 |
|
MWC |
0.250 |
0.062 |
<0.05 |
0.223 |
0.049 |
<0.05 |
|
MHC |
0.253 |
0.064 |
<0.05 |
0.177 |
0.031 |
>0.05 |
|
BMI |
0.072 |
0.005 |
>0.05 |
0.071 |
0.005 |
>0.05 |
|
WHR |
0.115 |
0.013 |
>0.05 |
0.207 |
0.042 |
<0.05 |
Discussion
Understanding nutritional as well as health status of the population has a vital role in overall socio economic development of the Country. In India a numbers of studies have been done to understand the nutritional status. Several recent studies in have utilized BMI to study the nutritional status of tribal population. Some studies also used MUAC to understand the nutritional status. Hypertension is a major and probably increasing cause of morbidity and mortality. Hypertension (HT), commonly referred to as ‘high blood pressure’, is a medical condition, in which the blood pressure is chronically elevated to 140(SBP)/90(DBP) mmHg or higher. Studies revealed that increasing blood pressure as well as HT is the important risk factors of cardio vascular disease.
In the present study an attempt has been made to study the association of socio-demographic and anthropometric variables with blood pressure.
However, the result of the present study in adult Santhal females revealed that the mean age was 36.86 (±15.6) years. However, the mean height, weight, MUAC, MWC, MHC, BMI, WHR were 151.8 (±4.63) cm., 43.2(±6.07) kg., 23.6(±2.14)cm., 70.7(±7.46)cm., 84.34(±7.39)cm., 18.7(±2.17)kg./m² and 0.83(±0.03). Moreover, the mean of SBP and DBP were 112(±13.0) mmHg and 76.2(±6.94) mmHg. Comparison of different anthropometric indicators with blood pressure level in rural Wardha revealed comparatively higher mean for height, weight, WHR and MWC in the adult Santhal females of the present study. The lower mean for BMI and SBP in the adult Santhal females of the present study, however the mean DBP was same in both the population. Comparison of different descriptive epidemiology of blood pressure in rural adult population in Northern Ghana revealed comparatively lower mean for BMI, MWC,SBP and higher mean for DBP in the adult Santhal females of the present study.
The result also revealed that 27% female are engaged in daily labour activity. However, with regards to the educational status, 67% adult females were illiterate. With regards migration status 52% females are resident of the village and 48% migrated from outside of the village. 74% female do not use tobacco, 16% and 10% female used tobacco by smoking or chewing. The majority of the female never drink alcohol.
In order to understand the association of age and monthly household income with SBP and DBP in adult Santal women, the results revealed positive correlation of age and monthly household income with SBP and DBP. However, none of these were significantly correlated with both SBP and DBP. Age explained 3.6% of variance SBP.
In order to understand the association of socio-demographic variables with blood pressure, the result revealed no significant (p>0.05) association of alcohol consumption, tobacco consumption, food habit, residential status, educational status and occupational status with blood pressures in adult Santal women.
Liew et.al, in 2019 established that the socio-demographic risk factor that is age and gender is added new evidence about the importance of ethnicity in relation to hypertension. It was also revealed from this paper that educational level rather than household income was an important socio economic indicator consistently associated with hypertension with in all ethnic groups. According to Alves and Faerstein in 2016 and Lee in 2017 observed that higher educational level had been found to be associated with lower prevalence of hypertension in earlier studies.
In order to understand the association of anthropometric variables with SBP and DBP in adult Santal women, the results revealed positive correlation of all anthropometric variables with SBP and DBP. Moreover, there was significant (P<0.05) positive correlation of MUAC, MWC and MHC with SBP. On the other hand, DBP was significantly (P<0.05) and positively correlated with MUAC, MWC and WHR. Furthermore, MUAC, MWC and MHC explained 9.6%, 6.2% and 6.4% variance of SBP respectively. On the other hand, MUAC, MWC and WHR explained 6.6%, 4.9% and 4.2% of variance of DBP, respectively.
Conclusion
In order to understand the association of age and monthly household income with SBP and DBP in adult Santal women, the results revealed positive correlation of age and monthly household income with SBP and DBP. However, none of these were significantly correlated with both SBP and DBP. It was also revealed from this study that the association of socio-demographic variables with blood pressure and there was no significant (p>0.05) association of alcohol consumption, tobacco consumption, food habit, residential status, educational status and occupational status with blood pressures in adult Santal women.
Acknowledgement
The authors are grateful to all participants. The authors are also grateful to the Department of Anthropology, Visva-Bharati for providing all the facilities for conducting this study.


Open Access By Aditum Open Access Journals id licensed under Creative Commons Attribution 4.0 International License. Based On a Work at aditum.org