Agricultural Research Pesticides and Biofertilizers
OPEN ACCESS | Volume 2 - Issue 1 - 2025
ISSN No: 2994-0109 | Journal DOI: 10.61148/2994-0109/ARPB


Asrat Mekonnen1*, Moses Thuita2 and Cargele Masso2
1Ethiopian Institute of Agricultural Research, Addis Ababa, Ethiopia
2 International Institutes of Tropical Agriculture, (IITA), Kenya
*Corresponding authors: Asrat Mekonnen, Institute of Agriculture and Animal Science (IAAS), Gokuleshwor College, Baitadi.
Received Date: May 26, 2022
Accepted Date: June 06, 2022
Published Date: June 23, 2022
Citation: Asrat Mekonnen, Moses Thuita and Cargele Masso. (2022) “Evaluation of Rhizobia isolates inoculation on effectiveness, N uptake and yield of field pea (Pisum sativum) at Kulumsa”, 4(1); DOI:http;//doi.org/06.2022/1.1078
Copyright: © 2022 Asrat Mekonnen. This is an open access article distributed under the Creative Commons Attribution License, which permits unrestricted use, distribution, and reproduction in any medium, provided the original work is properly cited.
Nitrogen fixation in legume-rhizobium symbiosis depends on the genotype of legume, rhizobium strain and the interactions of these with the bio-physical environment. Each legume species requires specific rhizobium strain for effective nodulation and nitrogen fixation. The objective of this study was to evaluate the effect of symbiotically effective Rhizobium leguminosarum isolates on effectiveness, nitrogen fixation, N uptake and yield of field pea. A total of 6 treatments were arranged using the three selected rhizobia, a standard reference commercial inoculant, and two (1 positive and 1 negative control groups) using field pea variety (tegegnech). The experiment was laid out in RCBD. Standard physiological and biochemical tests were conducted to characterize isolates against the local rhizobia in the soil. Data on nodulation shoot dry weight and root dry weight, plant height, number of pods plant-1, and number of seeds pod-1, thousand seeds weight, grain yield and above ground dry matter were collected and analyzed. The isolates were gram negative, with doubling time between 2 and 4 h, the colony diameter of all isolates were within the range of 2.5mm to 5.5mm and formed mucoid, convex and white colonies after 3-5 days incubation on YMA plates, and changed the YEMA-BTB medium into yellow. They did not absorb red color from CR-YEMA medium. Isolate FBR 11, FBR 15 and FBR 23 utilized different carbon source, amino acids, antibiotics and heavy metals. Inoculation of rhizobium significantly increased nodulation and yield of field pea under greenhouse and field conditions. The result of the experiment indicated that all inoculation treatments increased nodule number, nodule dry weight, grain yield, above ground dry matter N uptake over the control check. From the results of the correlation analysis showed that the nodule number was directly and highly significantly (p≤ 0.01) correlated with shoot dry weight (r=0.49), number of pod (r=0.59), number of seed (r=0.63), total grain yield (r=0.56) and N up take (r=0.80). Generally, inoculant FBR 15 and strain 1018 showed a significant increase on all parameters. Based on the study findings it is recommend that isolate FBR 15 as bio-fertilizer for better field pea production in the future.
rhizobium leguminosarum, N uptake, legume, tegegnech, field pea
1. Introduction:
Leguminous plants (pulses) are important as human food and animal feed they provide not only high-quality protein but also a variety of nutrients such as vitamins, minerals, and other nutrients. Most species of the Leguminosae form symbiotic associations with nitrogen-fixing root nodule forming bacteria known as rhizobia. They fulfill most of their N requirements through this process. Therefore, the legumes are an essential part of the terrestrial nitrogen cycle and used to sustain ecosystem functioning (Sprent, 2001).
Field pea (Pisum sativum) is one of the cool-season leguminous crops widely cultivated in Ethiopia at altitudes between 1800 and 3000 meters above sea level with annual average rainfall of 700-900 mm in the different regions of Oromia, Amhara, Tigray and Southern Ethiopia (EEPA, 2004). It is the second most important leguminous crops grown in the country after faba bean in terms of both area coverage and production. Field pea covers over 254,000 hectares with total production of 230,000 tons that accounts to 17% of the total grain legume production (IBC, 2008). It represents a useful complement to cereal-based diets as a relatively inexpensive source of high-quality protein. It contains 21-25% protein, 33-50% starch and amino acid (Lazanyi, 2002).
In Ethiopia, field Pea is an important pulse in the daily diet of the society in urban and rural areas. It is eaten whole, spilt or milled usually fresh, fried, boiled or mixed with other cereals to make various types of stews and soups (EEPA, 2004).
Field Pea like other legumes is capable of fixing and utilizing atmospheric nitrogen. Consequently, it is integrated in different crop systems as a sole crop or an intercrop in crop rotation for its capability to fix nitrogen in symbiotic association with root nodule bacteria known as Rhizobium leguminosarum biovar viciae. Rhizobium leguminosarum are effective in biological nitrogen fixation (BNF) with the capacity of converting nitrogen to the tune of 200-300 kg/ha/yr. Several studies have shown that field pea fulfills more than 80% of its nitrogen requirements through BNF and can subsequently transfers nitrogen to non-fixing plants in the agricultural system (Murat et al, 2008).
Nitrogen is major nutrient element for grain legumes. Although, nitrogen is abundant element in the atmosphere in gaseous form, plants cannot directly utilize it. Availability of nitrogen amount in soil is getting decreased by plant cultivation, increased oxidation in soil or it can also be easily washed away. Therefore, nitrogen becomes a limited factor in the plant cultivation. The main ways of the nitrogen application into soil are the mineral nitrogen fertilizer or Rhizobium inoculation of seeds or soil in order to obtain biological fixation of nitrogen.
For many years various studies have been carried out nation-wide to improve field pea cultivars, (Amare and Adamu, 1994).Many of these studies were restricted to soil plant nutrition and fertilizer trials in different agricultural research institutes (Tekalign and Asgelil, 1994).Recently few studies on taxonomic and symbiotic properties were undertaken on field pea rhizobia by collecting root nodules from different parts of Ethiopia (Fano Berhe, 2008; Aregu et al., 2012; Kassa, 2015).
Most of the studies were however restricted to laboratory and greenhouse-based experiments and hence, further research must need to be worked on selected rhzobial strains under field conditions
Green house screening of isolates is a preliminary work for symbiotic effectiveness of rhizobia. However, field trials are essential to assess their adaptive capability to field conditions and their competitiveness against the most recalcitrant, but often ineffective indigenous rhizobia in the soil (Theis et al., 2001; Evans et al., 1996).
In Bangladesh Rhizobium inoculation has been reported to supplement up to 80 kg N ha-1 and increase the average yield of pea plants over uninoculated plants (Ahmed et al., 2007). Rhizobium inoculation positively affects plant height, the number of branches, root and shoot dry weight, the number of nodules, seed and biomass yield, the number of pods, the crude protein concentration, and seed P content (Erman, 2009a). In India, inoculation of pea with Rhizobium leguminosarum at 20 g kg-1 seed increased nodulation and activated the nitrogenase enzyme in the root nodules to fix more atmospheric N. This necessitates a field trial in order to assess their field performance and select them for inoculant production to be used as biofertilizers.
Very recently, inorganic fertilizers are one of the expensive inputs in agriculture which not viable option for farmers because of most of them lack financial resource (Nyoki and Ndakidemi, 2016) and continued use of inorganic fertilizers also increased the acidity of the soils, reduces soil fertility and emission of greenhouse gasses (IFA, 2016). Thus, to reduce the amount of mineral fertilizers required there is a need to adopt organic fertilizers like biofertilizer, compost, vermicompost etc to build up soil conditions to enhance soil microbial activity, biological N fixation and field pea yields. And also, it is important to establish Rhizobium inoculation on nodulation, nutrient uptake, yield and growth in such legumes.
Therefore, the importance of this study was to evaluate the effect of symbiotically effective Rhizobium leguminosarum isolates on competitiveness, nitrogen fixation and yield of field pea under field conditions. Rhizobium isolates on the nodulation, agronomic and yield of field pea were evaluated as well as characterization and competitive abilities of inoculant isolates were also explored in the hope of selecting an effective and efficient rhizobium isolate for use of field pea. However, further screening under field condition and also their identity using molecular methods should be determined and produce biofertilizer for field pea in the future.
2. Material and Methods:
2.1. Description of Study Area:
The experiment was conducted at Kulumsa Agricultural Research Centre (KARC), which is located in Tiyo wereda of Arsi zone in the Oromiya national regional state Asela, Ethiopia during the main cropping season of June-November, 2016. The experimental site is located within latitude 8001’ 10”N and longitude 39009’11”E with altitude of 2200m above sea level. The site receive 832mm of rainfall with bimodal distribution (June to September and February-April) with average annual maximum temperatures of 220c and minimum temperatures of 100c. 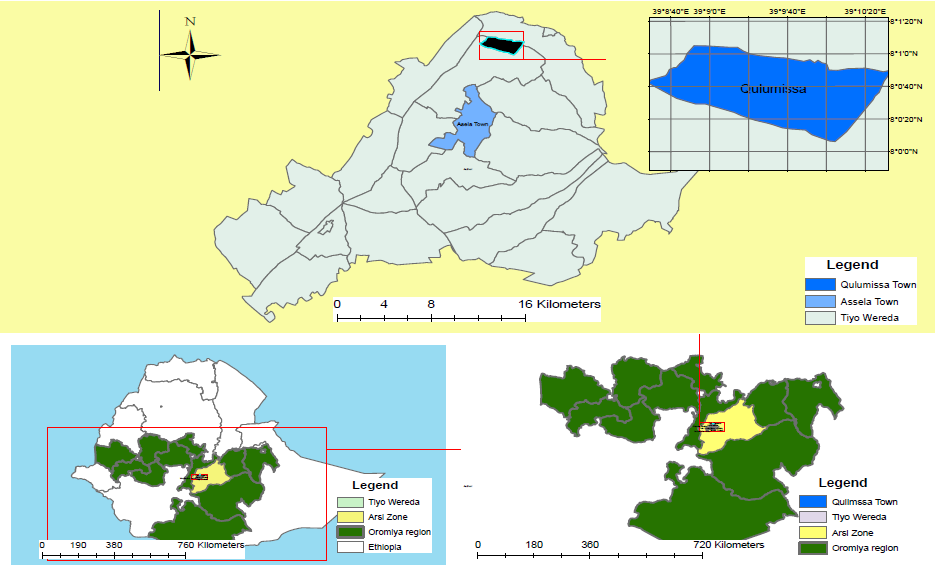 Figure 1: Location of the study area
2.2. Soil characteristics of the field site:
The physico chemical characteristic of the soil was tabulated on Table 1. The soil textural class of the experimental site was clay with average proportions of 49% clay, 23% silt and 28% sand according to Tekalign (1991). The pH value of the soil was slightly acidic (pH 6.2) and within the optimum range for crop production, total nitrogen content (TN) of the soil was classified as very medium (0.15-0.25%) (table1).The available phosphorus have content was medium (15-25 mg kg) - . As far as soil organic carbon (OC) is concerned, the value was 2.5%, which was within the range of low organic carbon content (Landon, 1991), and the cation exchange capacity (CEC) was medium (15-25 cmol kg1).
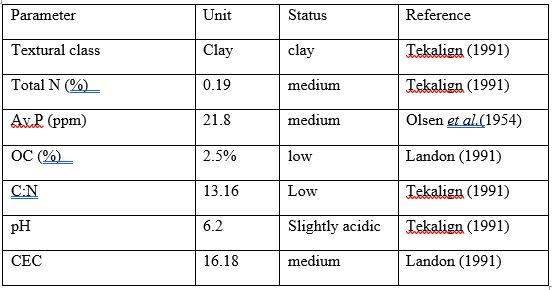
Table 1: Soil Physico‐chemical properties of experimental site
2.3. Enumeration of indigenous rhizobia in the soil:
The rhizobial population from the soil (collected from the selected field site) was estimated using Most Probable Number (MPN) by inoculating soil dilutions on the host grown in Leonard Jar under greenhouse conditions after 28 days of growth (Somasegaran and Hoben, 1994). The MPN was calculated from the most likely number (m) found in MPN tables. The most likely numbers (m) were located from the table as MPN per gram of soils:
X = m × d
V
Where X = rhizobia population per gram of soils, m = likely number from MPN table for the lowest dilution of series, d = lowest dilution (first unit used in tabulation) and V = volume of aliquot applied to plant.
2.4. Source of rhizobia, carrier, and Seed:
The selected rhizobia were FBR-23, FBE, 55, FPBR-15 obtained from culture collections of the Department of Microbial Cellular and Molecular Biology at Addis Ababa University. They were screened in previous studies (MSc and PhD thesis). They were selected based on their nutritional versatility and eco-physiological tolerance under laboratory test and symbiotic effectiveness on sand culture under greenhouse conditions.
The commercially released Rhizobium leguminasorium strain (strain 1018 (obtained from Ethiopian Institute of Agricultural Research (EIAR) was included as reference strain. Peat was used as inoculants carrier. The seed of field pea improved varieties (tegegnech) was obtained from Kulumsa Agricultural Research Centre (KARC), EIAR.
2.5. Treatments and experimental design:
A total of 6 treatments were arranged using the three selected rhizobia, a standard reference commercial inoculant, and two (1 positive and 1 negative control groups) using field pea variety (tegegnech). A non-nitrogen fixing reference crop (Barely variety, Direbe), released from KARC was also included to estimate the nitrogen derived from the atmosphere (Ndfa) using the N difference technique. The experiment was laid out in RCBD with factorial arrangement in three replications on one location. The plot size was 4m by 3.6m with a plot to plot spacing of 0.4m and block to block spacing of 1m.
2.6. Agronomic practices:
2.6.1. Land preparation and sowing:
Prior to sowing, the experimental plots were prepared three months before planting. A starter dose of P and N fertilizers with recommended rate 46 kg P2O5 and 20 kg urea ha-1 was used according to standard methods (Taye and Asfaw, 2010). One seed was planted per hill at a spacing of 20 cm between rows and 10cm between plants. All plots were isolated with ridges to minimize the movement of bacteria from one plot to another.
2.6.2. Seed inoculation and weeding:
The seeds were surface sterilized with sodium hypochlorite and latter washed repeatedly with sterile distilled water (Somasegaren and Hoben, 1994). Inoculation was made using lignite-based inoculants prepared from cool and clean water and sugar mixed with rhizobial isolates (108 ml-1 viable bacterial cell) applied at the rate of 7 ml kg-1 seeds. All inoculants were applied just before planting under shade to maintain the viability of cells (Taye and Asfaw, 2010). The experimental field was weeded following prior recommendation.
2.6.3. Field pea harvest:
All field pea plans were harvested at physiological maturity (120-150 days). The tops of the plants were cut and put in the cloth bag and sack, then sun dried up to attain constant weight then threshed manually to separate seed from straw.
2.7. Re isolation of root nodule bacteria from field pea nodules:
Re isolation was used to differentiate introduced rhizobia from indigenous (soil) rhizobia using standard methods. The nodules (collected from inoculated host Pea) were surface sterilized with 95% ethanol for 10 seconds, and transferred to 3% (v/v) solution of sodium hypo chlorate for 2-minutes (Lupwayi and Haque, 1994).The surface sterilized nodules were then rinsed with sterile distilled water six times to completely remove the sterilizing chemicals. The nodules were crushed with sterile glass rods in1 drop of sterilized 0.85% NaCl. The crushed nodules were then transferred to YEMA medium (DIFCO). They were then incubated at 28oc and periodically checked for colony formation.
|
Chemicals |
Amount (gm/l)
|
|
MgSO4.7H2O |
0.2gm
|
|
KH2PO4 |
0.5gm
|
|
NaCl |
0.2gm
|
|
Yeast extract |
0.5gm
|
|
D-manitol |
10gm
|
|
Agar |
15gm
|
|
Distil water |
1000ml
|
Table 2: YEMA Composition
2.8. Purification and preservation:
Colonies were picked with sterile inoculating loop and streaked repeatedly on sterile YEMA plates and incubated at 280C. The purity and uniformity of colonies was carefully examined and well isolated single colonies were picked and preserved on YEMA slant tubes containing 0.3% (W/V) CaCO3 at 40c (Somesagaran and Hoben, 1994).
2.9. Preliminary screening of rhizobia from nodules (presumptive test):
2.9.1. Gram staining test:
Gram staining was carried out to confirm that all isolates were gram negative and do not contain any gram positive bacteria or contaminants (Lupwayi and Haque 1994).
2.9.2. Congo red absorption:
Colonies were tested for congo red absorption on Congo-Red (CR-YEMA) (Somasegaran and Hoben, 1994). Stock solution of Congo Red (CR) prepared by dissolving 0.25gm of CR in 100ml sterile distilled water from which, 10ml was added to one liter of YEMA. Culture suspensions were inoculated into YEMA-CR medium, and the plates were wrapped with aluminum foil and incubated at 28±2 0C.
2.9.3. Acid and alkaline production on BTB:
Isolates were tested for the production of acid or alkaline by incorporating (0.5%) bromothymol blue (BTB) as reaction indicator on yeast extract manitol agar (YEMA) according to Somassegaran and Hoben, (1994). After 48 hours of growth, a loop full of Rhizobium culture (105cells/ml) was streaked on YEMA-BTB plate, and incubated at 28±2 0C for 3-5 days.
YEMA------------------------------------------1 liter
BTB-(0.5 % w/v in 95% ethanol) -----------5ml
pH------------------------------------------------6.8
2.9.4 Growth on peptone glucose agar (PGA) medium:
Isolates were inoculated on PGA containing bromocresol purple dye (10μ g/ml) in order to check a change in pH of the medium associated with the presence of contaminants (Somasegaran and Hoben, 1994). The PGA composition was glucose 5gm, peptone 10gm, agar 15gm and BCP 10ml then adjusted pH at 6.8.
The BCP (Bromo cresol purple) was prepared as stock solution by dissolving 1gm/100ml of ethanol. The pH was adjusted to 6.8 by 1N NaOH and HCl. The bacterial culture suspension was inoculated on the medium and incubated at 28±2oc; to detect the presence/absence of bacterial colonies.
2.9.5. Authentication:
Isolates were authenticated as root nodule bacteria according to Somasegaran and Hoben, (1994). Healthy seeds of field pea (Tegegnech) were surface sterilized as before and transferred into 0.75% water agar plates and incubated at 25oC. Five seedlings were then transferred into surface sterilized 3kg capacity plastic pots filled with river sand soaked in H2SO4 for 24 hours and extensively washed with tap water several times. After 3-5 day, each seedling was inoculated with 1ml actively grown rhizobial culture (109cells/ml), and later were thinned down to three per pot.
The experiment was set up in randomized complete design in a greenhouse with a 12/12 light/ dark hours cycle and an average25/18oC day/night temperature. All experiments were done in triplicates by including positive control pots fertilized with nitrogen 0.05% KNO3 (W/V once a week) but without inoculation) and negative control pots neither fertilized nor inoculated). All treatments were fertilized with full strength N-free nutrient at a rate of 100ml/pot once a week (Broughton and Dilworth, 1970) (Table 3), and washed with tap water every 2 days to control salt accumulation in pots.
|
Stock solution |
Chemical |
Concentration g/l |
|
Calcium chloride |
CaCl2.2H2O |
294.0 |
|
Potassium phosphate |
KH2PO4 |
136.1 |
|
Ferric citrate |
Fe C6H5O7. 3H2O |
6.700 |
|
MgSO4. 7H2O |
123.3
|
|
|
K2SO4. H2O |
87.00
|
|
|
MnSO4. H2O |
0.338
|
|
|
Trace elements |
H3BO3 |
0.247 |
|
ZnSO4. 7H2O |
0.228
|
|
|
CuSO4. 5H2O |
0.100 |
|
|
CoSO4. 7H2O |
0.056
|
|
|
Na2MoO2. 2H2O |
0.048
|
Table 3: Nitrogen free solution (after Broughton and Dilworth (1970)
After 6 weeks of planting, the whole plants were uprooted to count the number of nodules, and measure of nodule dry weight and shoot dry weight after drying at 70 oC for 48hrs until constant weight. Effectiveness of isolates in accumulating plant shoot dry weight was calculated according to the equation.
SE= Inoculated plant DM X 100 %
N-fertilized plant DM
DM=dry matter, SE=symbiotic effectiveness
Nitrogen fixing effectiveness classified as ineffective, <35%; lowly-effective, 35-50%; effective, 50-80%; and highly effective, >80%.
2.10. Cultural and growth characteristics of authenticated rhizobial isolates:
2.10.1 Cultural conditions:
All experiments were done in triplicates by growing the isolate for 48 hours and adjusted to inoculum size of 106 /ml. They were inoculated on YEMA medium, incubated for 3-5 days at 30oC unless stated otherwise.
2.10.2. Mean growth time:
Each isolate was inoculated in to 10ml of YEMB test tube and shaken on orbital shaker at 120 rpm (revolution per minute) for 48hrs at room temperature. One ml of each culture was transferred into 250ml Erlenmeyer flasks containing 100ml of YEMB and placed on rotary shaker at 120 rpm (revolution per minute). After calibrating spectrophotometer to zero with sterile uninoculated YEMB (3.5 ml blank), 3.5ml of culture samples were was transferred into cuvette to read optical density (UV-7804C-Ultraviolat-Visible spectrophotometer) at 540 nm beginning from time of inoculation (0hr) and at every 6hrs interval for 72hours. The generation time (g) was calculated from the logarithmic phase according to White (1995).
|
The formula; g = log2 (t) logX-logXo, |
|
Generation time (g) =t/n
|
Where: g = generation time, t = time elapsed, XO = First OD, X = second OD reading, OD=optical density, n=number of generations
2.10.3. Colony morphology:
The cultural characteristics of the isolates were performed after having grown them for 3-5 days on YEMA medium according to (Lupwayi and Haque, 1994). Each single colonies of each isolate was characterized based on colony appearance (texture), diameter, color, shape and extra cellular polysaccharide production.
2.11. Nutritional characteristics:
2.11.1. Carbohydrate Utilization:
Isolates were checked for their ability to utilize different carbohydrate sources i.e. glucose, D-fructose, maltose, D-galactose, glycerol, L-arbinose and Gluconate. The test was carried out according to Somasegaran and Hoben, (1994). Each carbohydrate (w/v but v/v for glycerol) was prepared (10%) and mixed with basal medium containingMgSO4.7H2O (0.2gm), KH2PO4 (0.5gm), NaCl (0.2gm), manitol (10gm), yeast extract (0.5gm) and agar (15gm). Heat stable carbohydrates (glucose and D-fructose) were autoclaved together with the medium, but heat labile carbohydrates (D-arabinose, D-galactose, maltose, gluconate and glycerol) were filter sterilized using disposable membrane filter of 0.22μm and added to the basal medium (YEMA). After sterilization when the medium temperature was reduced to 50 OC. Finally, a loop full of 72 hours old YEM broth culture was separately streaked on the plates and incubated at 28 OC for 3 to 5 days and growth was recorded as (+) for positive growth and (-) for no growth in relation to the positive control YEMA plates.
2.11.2. Amino Acid Utilization:
The isolates were streaked on different nitrogen source including: Glutamine, DL-β-Phenylalanine, Peptone, L-Arginine, Glycine, NH4Cl and Alanine in order to determine their ability to utilize them.Each nitrogen source was added to a basal medium at concentration of 0.5gm /l (Somasegran and Hoben, 1994). Finally, 72hr old rhizobial culture was inoculated in to these medium and incubated at 28±2 C for 3-5 days.
Table.4 Basal Medium Composition
|
Chemicals |
Amount (gm/l)
|
|
MgSO4.7H2O |
0.2gm
|
|
KH2PO4 |
0.5gm
|
|
NaCl |
0.2gm
|
|
Yeast extract |
0.5gm
|
|
D-manitol |
10gm
|
|
Agar |
15gm
|
|
Distil water |
1000ml
|
2.11.3. Phosphate solublizing ability:
The ability of all isolates to utilize inorganic phosphate was tested on Pikovskaya agar medium (PKVA) containing: Glucose (10gm/l), Tricalcium phosphate Ca3(PO4)2 (5gm/l), Ammonium phosphate (NH4)2SO4 (0.5gm/l), Yeast extract (0.5gm/l), Magnesium sulfate heptahydrate MgSO4.7H2O (0.1g/l), Sodium chloride NaCl (0.2g/l), Potassium chloride KCl (0.2gm/l), Manganese sulfate MnSO4.H2O (0.002gm/l), Ferrous sulfate FeSO4.7H2O (0.002gm/l) and Agar (15gm/l). The pH of the medium was adjusted to 7.00. Colonies were checked for the presence of clear halo zone around them (Ronald, 2010).
2.12. Eco-physiological characteristics:
2.12.1. PH tolerance:
The ability of isolates to grow at different pH was tested on YEMA adjusted to pH levels 4.0, 4.5, 5.0, 5.5, 8.0, 8.5, 9.0 and 9.5 with sterile 0.1N HCl and 1N NaOH (Bernal and Graham, 2001). The results were recorded qualitatively as + for presence or – for absence of growth after 3-5 days of incubation at 28 + 2⁰C.
2.12.2. Temperature tolerance:
The ability of all isolates to grow at varying temperatures was assessed on YEMA plates incubated at the temperatures of, 4,10, 15, 35 and 40⁰C (Lupiwayi and Haque,1994).Growth was qualitatively recorded as (+) for growth and (-) for no growth .
2.12.3. Salt tolerance:
Tolerance of all isolates to sodium chloride (NaCl) evaluated through determining growth on YEMA solid medium supplemented with 0.1, 1.0, 2, 3, 4, 5 and 6 % (w/v), Nacl concentration. Growth was evaluated qualitatively as (+) for growth and (-) for no growth after 3-5 days (Lupiwayi and Haque, 1994).
2.12.4. Heavy metal resistance:
The resistance of isolates to heavy metals was tested by streaking them on solid YEMA medium containing different concentrations of heavy metals as described in Lupiwayi and Haque (1994). The heavy metals ZnCl2 25; HgCl2 5; CuCl2 100; CrCl2 100; CdCl2 20; Ni Cl2 60 and Pb (CH3CO) 2 100 and 500 were filter sterilized using sterile 0.2µm pore size membrane filter (µg ml-1) and added to the media (YEMA) after autoclaving and cooling to approximately 50 oC and mixed thoroughly (Lupiwayi and Haque 1994). The isolates were streaked on the plates and incubated at 28 + 2⁰C for 3-5 days. The result was recorded qualitatively either as +/- for growth and no growth, respectively.
2.12.5. Intrinsic antibiotic resistance (IAR):
The resistance of isolates to antibiotics was tested by streaking them on solid YEMA medium containing freshly prepared filter sterilized antibiotics using 0.22 μm sized membrane filters: Tetracyclin, Erythromycin, Stryptomycin, Penicillin, Chloroamphenicol, Neomycin, Ampicillin and Nalidixic acid and five concentrations (5, 10, 20, 30 and 50). The stock solution of each antibiotic was first prepared by dissolving 2gm of each antibiotic in 100ml of water as described in Lupiwayi and Haque, (1994). Erythromycin was dissolved in ethanol and Nalidixic acid was dissolved in 1M NaOH, whereas the other was dissolved in sterilized distilled water. Each filter sterilized antibiotic solution was added to sterile YEMA cooled to 50⁰C and mixed thoroughly. The isolates were then streaked on the plates and incubated at 28 + 2⁰C for 3-5 days. The result was recorded qualitatively either as +/- for growth and no growth, respectively.
2.13. Nodule occupancy of rhizobia inoculants from nodules in the field:
The nodule occupancy of the inoculants was tested after 30 days of planting in the field in order to compare their competitiveness in occupying nodules compared to the indigenous rhizobia in the soil. 4-5 representative nodules from each of 10 randomly picked individual plants were randomly collected to re-isolate those using standard methods (Somesegaran and Hoben, 1994). Nodule occupancy of the three inoculants was determined by growing on antibiotic agar plates after the nodules had been crushed and transferred to YEMA medium containing erythromycin (10µg/ml), streptomycin (10µg/ml) and the mixture of erythromycin (10µg/ml) and streptomycin (10µg/ml) to determine the presence or absence of the inoculants strain .They were compared with biochemical markers of the inoculants recorded before (Genet G/Yohannes, unpublished document).
2.14. Performance of the selected inoculants on growth and yield of field pea
under field conditions:
2.14.1. Yield related parameters and Sample collection:
Plant height, number pod of plant, number of seeds per pod, thousand grains weight, total biomass yield per hectare and grain yield per hectare were considered as parameters to study the effect of inoculation on growth and yield components of field pea.
At 60 days of growth five plants uprooted from each plot to determine nodule number, nodule dry weight, shoot dry weight and N content and also at physiological maturity (harvesting) five plants from each plot including the reference crop (barley) were harvested and separated into straw and grain. These samples were used to determine seed and straw N content, N uptake, N derived from the atmosphere (Ndfa), and seed protein content. Soil sampling was taken from all plots and reference crop after harvesting to determine N derived from the atmosphere (Ndfa).
2.14.2. Determination of Grain and straw yield, total nitrogen content and N uptake:
Total N in grain and straw sub samples was quantitatively determined by Kjeldhal procedure (Page et al., 1982). N up take in the grain and straw was determined after multiplying their N contents with their respective yields (Taye and Asfaw, 2010).
2.14.3. Estimation of Biological nitrogen fixation (nitrogen derived from fixation) of pea plants using a reference crop:
N- Difference Method:
Field estimation of N2 fixation (nitrogen derived from fixation) was determined by measuring the total amount of N in the legume crop and nitrogen content in a non- fixing reference crop (barely, Direbe) (Beck et al., 1993). The amount of N2 fixed was calculated by subtracting the N yield of the reference crop from the N yield of legume as follows. The quantity (Q) of N derived from N2 fixation was calculated as:
Q = Total nitrogen of legume – total nitrogen of reference crop x 100
Total nitrogen of legume
2.14.4. Determination of Seed protein:
In order to determine crude protein in seeds representative seed samples were taken from each treatment to determine total nitrogen in the seed through kjeldahl Method (Page et al., 1982). Then the percentage of protein in seeds was calculated by multiplying the factor 6.25 (Morrison, 1956).
2.15. Plant and Seed Analysis:
At physiological maturity five plants from within each plot including the reference crop were harvested and separated into straw and grain. These samples were used to determine seed and straw N, total N, N derived from the atmosphere (Ndfa), and seed protein content. The sample materials were oven dried at 70 oC to a constant weight and ground to pass through a 2 mm sieve. Plant tissue N was determined using Kjeldhal method.
2.16. Data Collection and analysis:
Data on plant height, number of nodules, nodule dry weights and shoot dry weight was recorded after two months after planting. After having excavated selected plants from central rows, nodulation was scored as positive with at least one nodule, and counted as mean value of nodules plant-1. At physiological maturity, five plants from central rows of each plot were randomly harvested to measure plant height, number of pods plant-1, and number of seeds pod-1 (Birhanu and Pant, 2012). Thousand seeds weight, grain yield and above ground dry matter (biological yield) were recorded on net harvestable plot. Grain yields were adjusted to 10 % moisture content and the yield per plot was converted to kg hectare-1 for statistical analysis. The green house and field data were analyzed using SAS analytical software. Effects were considered significant if P values are < 0.05 and means were separated using Duncan multiple range test (DMRT). Correlation analysis was carried out to study the nature and degree of relationship between numbers of nodule and selected parameters using the same software.
3. Results and discussion:
3.1. Estimation of Indigenous Rhizobia (MPN) in the soil at the experimental site:
The MPN count of rhizobia in the soil at the experimental site was 1.5 x 10⁴ indicating that the soil contained sufficient number of indigenous rhizobia which is a prerequisite for prolific nodulation and the potential gain of nitrogen from the system (Zahran, 2001). Soils have rhizobia but not effective. From the result of the control plot all required parameters were low in value including forming effective nitrogen fixing nodules. The amount of nitrogen fixed through bacteria depends upon the presence of effective nodules on the host roots.
3.2. Resolution of rhizobia from nodules to estimate nodule occupancy of the inoculants
Presumptive test, cultural and growth characteristics of isolates:
Inoculated bacteria were re-isolated from nodules of the inoculated field pea plant to estimate the nodule occupancy (%) of the three rhizobial inoculants (FBR11, FBR15 and FBR23) using different ecophysiological markers. The isolates were gram negative, with doubling time between 2 and 4 h, the colony diameter of all isolates were within the range of 2.5mm to 5.5mm and formed mucoid, convex and white colonies after 3-5 days incubation on YMA plates, and changed the YEMA-BTB medium into yellow. They did not absorb red color from CR-YEMA medium this result similar to the findings of Kassa et al. (2015) and failed to grow on peptone glucose agar (PGA) medium. All these indicated that the isolates were fast growing rhizobia.
All isolates utilized maltose and glucose as the sole source of carbon, and almost all isolates grow on YEMA medium containing D-galactose (90%), D-fructose (88.9%), L-arbinose (98.9%), glycerol (98.9%) and glucanate (77.8%) (table 5). All isolates were able to metabolize alanine, glycine and NH4Cl, and also the majority of the isolates utilized L-arginine (83.3%), glutamine (77.8%), peptone (63.3%), DL-B-phenylalanine (57.8%) and 82% of the isolates were able to utilize all amino acid tested this result greater than the findings of Fano Berhe (2010) where 48% of the isolates were utilized all amino acids sources.
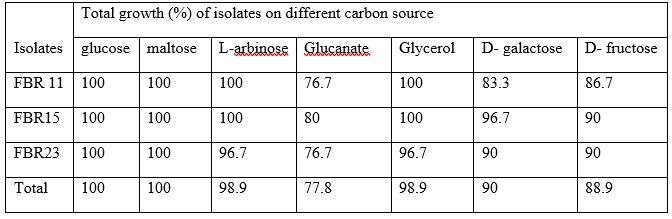
Table 5: Carbon source test of Isolates from strain FBR 11, FBR15 and FBR23
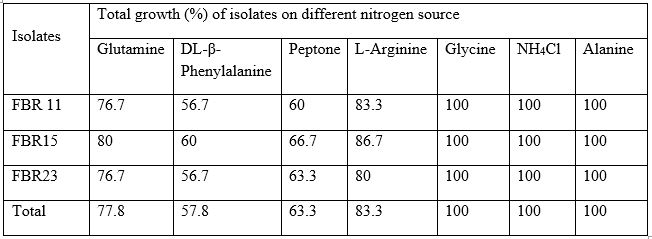
Table 6: Nitrogen source test of Isolates from strain FBR 11, FBR15 and FBR23
The different isolates displayed a large spectrum of antibiotic resistance on the different types and concentration of antibiotics (Table 7a, b, c and d). The data on inherent antibiotic resistance of isolates showed that they were tolerant to erythromycin, streptomycin and ampicillin at concentration of 5 to 20μg/ml. This pattern of resistance is similar to the report of Turco and Berdcek, (1987) which showed pea rhizobia from soils of eastern Washington grow well on the same type and concentration. Assefa Kenenie et al., (2010) also reported on resistant faba bean rhizobia, from Wollo, Northern Ethiopia. The antibiotic resistance pattern also showed that the isolates were sensitive to penicillin and chloroamphenicol at concentration increase from 20 μg/ml to 30 μg/ml.
A report on intrinsic antibiotic resistance test pattern on field pea Rhizobium leguminosarum biovarviciae from different parts of Ethiopia also showed that the isolates tolerate to chloramphenicol and grow 90% and 88% at concentration of 5 and 10μg/ml respectively (Aregu Amsalu, 2007).
|
isolates |
Ampicillin |
Nalidixic acid |
||||||||
|
5 |
10 |
20 |
30 |
50 |
5 |
10 |
20 |
30 |
50 |
|
|
FBR11 |
100 |
100 |
100 |
73.3 |
43.3 |
100 |
100 |
83.3 |
53.3 |
26.7 |
|
FBR15 |
100 |
100 |
100 |
83.3 |
0 |
100 |
100 |
100 |
60 |
10 |
|
FBR23 |
100 |
100 |
100 |
76.7 |
0 |
100 |
100 |
36.7 |
0 |
0 |
|
Total |
100 |
100 |
100 |
77.8 |
14.4 |
100 |
100 |
73.3 |
37.8 |
12.2 |
Table 7a: Intrinsic antibiotics resistance of isolates from strain FBR 11, FBR15 and FBR23
|
isolates |
Penicillin |
Chloroamphenicol |
||||||||
|
5 |
10 |
20 |
30 |
50 |
5 |
10 |
20 |
30 |
50 |
|
|
FBR11 |
100 |
83.3 |
43.3 |
16.6 |
0 |
100 |
100 |
100 |
86.7 |
50 |
|
FBR15 |
100 |
100 |
60 |
0 |
0 |
100 |
86.7 |
73.3 |
60 |
20 |
|
FBR123 |
100 |
100 |
66.7 |
13.3 |
0 |
100 |
83.3 |
40 |
0 |
0 |
|
Total |
100 |
94.3 |
56.7 |
10 |
0 |
100 |
90 |
71.1 |
48.9 |
23.3 |
Table 7b: Intrinsic Antibiotics resistance of isolates from strain FBR 11, FBR15 and FBR23
Isolates were found to be diverse in tolerance to different types and concentrations of antibiotics. Generally, most isolates were not tolerant to50 μg/ml. Generally, all isolates solubilize tri calcium phosphate.
|
isolates |
Tetracycline |
Erythromycin |
||||||||
|
5 |
10 |
20 |
30 |
50 |
5 |
10 |
20 |
30 |
50 |
|
|
FBR11 |
100 |
100 |
83.33 |
40 |
0 |
100 |
100 |
100 |
66.6 |
30 |
|
FBR15 |
100 |
100 |
100 |
73.3 |
16.7 |
100 |
100 |
90 |
43.3 |
0 |
|
FBR23 |
100 |
100 |
83.3 |
15 |
0 |
100 |
100 |
90 |
53.3 |
0 |
|
Total |
100 |
100 |
88.9 |
42.8 |
22.2 |
100 |
100 |
93.3 |
54.4 |
10 |
Table 7c: Intrinsic Antibiotics resistance of isolates from strain FBR 11, FBR15 and FBR23
|
isolates |
Neomycin |
Streptomycin |
||||||||
|
5 |
10 |
20 |
30 |
50 |
5 |
10 |
20 |
30 |
50 |
|
|
FBR11 |
100 |
100 |
100 |
73.3 |
33.3 |
100 |
100 |
100 |
60 |
0 |
|
FBR15 |
100 |
100 |
100 |
90 |
23.3 |
100 |
100 |
56.7 |
0 |
0 |
|
FBR23 |
100 |
100 |
90 |
30 |
13.3 |
100 |
100 |
90 |
13.3 |
0 |
|
Total |
100 |
100 |
96.7 |
64.4 |
23.3 |
100 |
100 |
82.2 |
24.4 |
0 |
Table 7d: Intrinsic Antibiotics resistance of isolates from strain FBR 11, FBR15 and FBR23
Ecophysiological characteristics of isolates:
Most of the three rhizobial isolates could tolerate temperatures 35°C (95.5%) with optimum growth at 30°C (100%), but some of them were also able to grow at 15°C (22.2%). There were no isolates tolerate 4°C ,10°C and 40°C (table 8). The results of this test are in related with previous studies (Zahran, 1994) which showed that Rhizobium bacteria are mesophiles, and can grow at temperatures between 10 and 37°C with an optimum temperature for growth of most isolates at 28°C but different to the finding of Aregu (2007) documented 50% and 64% of isolates were tolerate to 5 and 10°C respectively.
Almost all of the isolates were tolerant to pH 5.5, 8 and 8.5(100%) and some of the isolates were grown at pH 4.5 (11.1%), pH 5 (60%) and pH 9 (48.9%) however no growth was observed at pH 4 and 9.5 this result was similar to the result of kassa et al., (2015) that the tested isolates did not grow at pH 4.
|
Isolates |
Growth (%) of isolates at different PH level |
growth (%) of isolates at different temperature level |
|||||||||||
|
4 |
4.5 |
5 |
5.5 |
8 |
8.5 |
9 |
9.5 |
4 oc |
10oc |
15 oc |
35 oc |
40 oc |
|
|
FBR 11 |
0 |
10 |
60 |
100 |
100 |
96.7 |
50 |
0 |
0 |
0 |
23.3 |
90 |
0 |
|
FBR15 |
0 |
13.3 |
63.3 |
100 |
100 |
100 |
46.7 |
0 |
0 |
0 |
23.3 |
96.7 |
0 |
|
FBR23 |
0 |
10 |
56.7 |
100 |
100 |
100 |
50 |
0 |
0 |
0 |
20 |
100 |
0 |
|
Total |
0 |
11.1 |
60 |
100 |
100 |
98.9 |
48.9 |
0 |
0 |
0 |
22.2 |
95.6 |
0 |
Table 8: PH and temperature level resistance of isolates from strain FBR 11, FBR15 & FBR23
The salt tolerance of the tested rhizobia isolates also showed that, all isolates growth at 0.1% to 2% NaCl concentration of the growth medium (table 9). However, some isolates were grow at 3 % (85.6%), 4 % (72.2%), 5 % (50%) and 6 % (25.6%). Rhizobium isolates capable of growing at NaCl concentrations up to 6% have been isolated from field pea plant by Aregu (2007).
|
Isolates |
growth of isolates at different salt concentration |
||||||
|
0.1% |
1% |
2% |
3% |
4% |
5% |
6% |
|
|
FBR 11 |
100 |
96.7 |
96.7 |
86.7 |
66.6 |
46.7 |
23.3 |
|
FBR15 |
100 |
100 |
100 |
86.7 |
76.7 |
50 |
26.7 |
|
FBR23 |
100 |
100 |
96.7 |
83.3 |
73.3 |
53.3 |
26.7 |
|
Total |
100 |
98.9 |
97.8 |
85.6 |
72.2 |
50 |
25.6 |
Table 9: Different salt concentration resistance of isolates from strain FBR 11, FBR15 & FBR23
Evaluation of the intrinsic resistance to heavy metals showed that all tested isolates shown that high resistance to ZnCl2, Pb (CH3CO) 2, CrCl2 and CuCl2 at concentrations of 25, 100, 100 and 100 µg ml-1, respectively and most of the isolates exhibited an intrinsic resistance to CoCl2 100 µg ml-1 (77.8%), ZnCl2 50 µgml-1 (74.4%), NiCl2 60 µgml-1 (74.4%) and Pb (CH3CO) 2 500 µgml-1 (54.3%). However, all isolates were sensitive to HgCl2 10 µgml-1 (table 10) but some of the isolates were tolerate HgCl2 5 µgml-1 (44.3%) this result was different with the finding of Aregu (2007) who reported 54% tolerant field pea rhizobia isolates to HgCl2 10 µgml-1.
|
isolates |
Zn |
Pb |
Cu |
Hg |
Co |
Ni |
Cr |
|||
|
25 |
50 |
100 |
500 |
100 |
5 |
10 |
100 |
60 |
100 |
|
|
FBR11 |
96.7 |
73.3 |
100 |
53.3 |
93.3 |
43.3 |
0 |
76.7 |
76.7 |
93.3 |
|
FBR15 |
100 |
76.7 |
100 |
56.7 |
100 |
46.7 |
0 |
80 |
73.3 |
100 |
|
FBR23 |
100 |
73.3 |
100 |
53.3 |
96.7 |
43.3 |
0 |
76.7 |
73.3 |
93.3 |
|
Total |
98.9 |
74.4 |
100 |
54.3 |
96.7 |
44.3 |
0 |
77.8 |
74.4 |
95.5 |
Table 10: Different heavy metals resistance of isolates from strain FBR 11, FBR15 and FBR23
3.3. Authentication and symbiotic effectiveness test of re-isolated rhizobial isolates on sand culture:
All the three rhizobial isolates (FBR11, FBR15 and FBR23) and commercially released strain (strain 1018) nodulated pea plants on sand culture under greenhouse conditions (Table 11). Accordingly, they showed prolific nodulation (196-229 N/plant); with nodule dry weight of 104-121mg/plant, and shoot dry weight (2.3-2.9gm/plant) showing that the inoculants did not lose their nodulation capacity. Although the inoculants showed statistically significant variations in nodule number, nodule fresh weight, shoot dry weight (except in shoot nitrogen content (1.7-2.0%) and N at p< 0.05 (Table. 11) compared to the un-inoculated field pea controls [un-inoculated pea without N and un-inoculated field pea with N used as negative (N-), they also showed variations among one another (Table 11).
Thus, the data showed that isolate FBR 15 and the standard strain 1018 showed higher values in all parameters (except N content) than the other two isolates; FBR 11 and FBR 23. They also displayed highe effectiveness (HE) measured by percentage shoot dry matter accumulation (80-100%) in relation to the shoot dry weight obtained from the Nitrogen-fertilized control plants (Table 11) (Date et a.l, 1993 in Purcino et al., 2000).
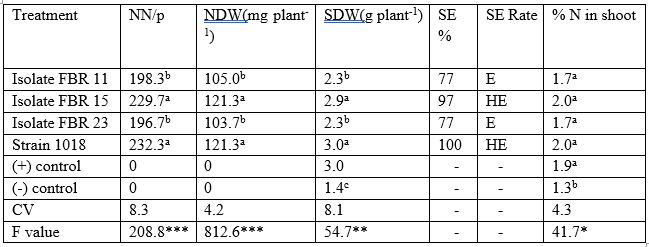
Table 11: The effect of rhizobia inoculants on degree of nodulation, shoot dry weight (symbiotic effectiveness), and N content of field pea on sand culture grown for 45 days under greenhouse conditions
Means in the same column followed by the same letter are not significantly different at the 5% Probability level by Duncan test. ***, ** and * = significant at P= 0.001, 0.01 and 0.05 respectively; CV = coefficient of variation, HE = highly effective; E= effective; NN= nodule number; NDW=nodule dry weight and SDW= shoot dry weight
Field pea plants inoculated with isolate FBR 15 and strain 1018 produced the maximum nodule number of (232.3 and 229.7 per plant), nodule dry weight (21mg/plant) that were significantly different from plants treated with isolates FBR 11 and FBR 23. The average nodule number counted from the inoculants was 151.2 nodules per plant that was significantly higher than108 nodules per plant recorded from pea plants (Aregu et al., 2012). The pattern of nodule dry weight was similar in that the plants displayed the higher nodule number also showed higher nodule dry weight (of 121.3mg/plant). Similarly, the inoculated plants with the most effective inoculants (FBR 15 and strain 1018) accumulated the highest shoot dry weight of 2.9/3.0g plant-1 equivalent to N-fertilized plants that was statistically different from plants inoculated with the other inoculants (Table 11). Based on dry matter accumulation of inoculated plants with nitrogen fertilized (N+) control plants, FBR 15 and strain 1018 were rated as highly effective; the others were effective. The fact the inoculated plants did not show significant variation in % N content, indicated that shoot dry matter is a good indicator of relative effectiveness of isolates (Somasegaran and Hoben, 1994). Our result was Similar to Talukder et al., (2008) revealed that the highest N content with the strain PR3 was recorded as 1.8% in pea shoot.
3.4. Nodule occupancy of rhizobial isolates:
Competitiveness of rhizobia isolates (FBR 11, FBR 15 & FBR 23), strain 1018 and indigenous soil rhizobia were shown that highly difference between them. According to the % of occupancy, strain 1018 and isolate FBR15 competitiveness was higher (100% and 93.3%) than FBR 11 and FBR 23 (83%).On the other hand, competitiveness of indigenous soil rhizobia was very low(33.3%). Strain 1018 and isolate FBR 15 was able to occupy all root nodules and fully exert its N2 fixation ability. High nitrogen fixation high competitiveness is a precondition of successful inoculation of a plant seed by rhizobium. This is the way how to add selected rhizobia isolate or strains to legume seeds effectively and consequently prevent the formation of nodules by low effective indigenous soil rhizobia (Denton et al., 2002).
|
Treatment |
No of Tested nodule |
Growth on YEMA +Strp |
Growth on YEMA +Eryth |
Growth on YEMA +Strp & Eryth |
% occopancy |
|
FBR11 |
30 |
26 |
25 |
25 |
83 |
|
FBR15 |
30 |
30 |
28 |
28 |
93.3 |
|
FBR23 |
30 |
26 |
24 |
25 |
83 |
|
Strain 1018 |
30 |
30 |
30 |
30 |
100 |
|
Indigenous |
15 |
6 |
5 |
5 |
33.3 |
Table 12: Nodule occupancy by antibiotic resistant method of isolates
3.5. Effects of rhizobial isolates on nodulation shoot dry weight and plant height of field pea under field conditions:
Number of nodules plant-1 :
The field pea plants showed significant variation in nodulation and phenotypic characters (P < 0.001) among the different treatments under field conditions (Table 13). Accordingly, the FBR 15 isolate induced the highest number of nodules plant-1 (107nn/plant) comparable to the commercial strain-1018 (112nn/plant) which was significantly higher than the other isolates (84/86nn/plant) and treatments. On the contrary, the lowest number of nodules plant-1 (13.67 and 10.67) was counted from N-fertilized pea plants and uninoculated and non-fertilized plants (Table 13). Number of nodule was higher in inoculated plants compared to the non-inoculated ones by the range of 20.3% -27.1%. Thus, this finding is similar with those of Murat et al., (2009) who reported similar result on number of nodule by the range of 19.4% - 25% inoculated higher than non-inoculated.
Nodule dry weight plant-1:
The field pea plants also displayed differences in nodule dry weight ranging from 8.7mg/plant (uninoculated negative control) 94.3mg/plant recorded from plants inoculated with Strain 1018). The nodule dry weight of plants induced by the standard strain and the indigenous isolate FBR15 (94.3mg/plant) was significantly higher than the other treatments with Isolates FBR 11 and FBR 23 (73.7/77mg/plant). This result Similar with the result of Murat et al., (2008) stated that inoculation with Rhizobium increased nodule dry weight and the highest nodule dry weight obtained from inoculated field pea plant 57% over non-inoculated.
Shoot dry weight:
The inoculation of field pea with Strain 1018 and the indigenous isolate FBR15 significantly (P<.001) enhanced shoot dry weight of field pea comparable to the N-fertilized plants (28gm/plant) (Table 13). Poor nodule number and dry weight displayed by the uninoculated (negative control) also yielded (13.7gm/plant) which was less than 50% of the shoot dry weight accumulated by the most effective isolates and the N-fertilized plants. This indicates inoculation by the most effective inoculants could increase shoot dry matter significantly. This finding similar to the finding of Murat et al., (2008) who reported the highest shoot dry weight from inoculated field pea plant was greater than 48% of non-inoculated field pea plant shoot dry weight.
Plant height:
The different treatments showed a significant difference in plant height ranging from 169.3 cm (negative control) to that of 202.3 cm reached inoculation with the standard strain-1018 (Table 13). The variation in plant height did not show significant difference amongst all treatments, except the uninoculated and non-fertilized treatments. The inoculated plant height was increased 22% over on non-inoculated control. This result also obtained by Murat et al., (2008) which documented 156.5cm from non-inoculated and 194cm from inoculated field pea plant.
|
Treatment |
No of nodule /plant |
Nodule DW(mg) |
Shoot DW(gm) |
Plant height(cm) |
|
Control |
10.7c |
8.7c |
13.7c |
169.3b |
|
Recommended N |
13.7c |
10.7c |
28a |
200a |
|
FBR 15 |
107a |
94.3a |
28.3a |
200a |
|
FBR 11 |
84b |
77b |
25b |
198.5a |
|
FBR 23 |
86b |
73.7b |
23.3b |
198a |
|
Strian 1018 |
112a |
93.7a |
28.7a |
202.3a |
|
F Value |
*** |
*** |
*** |
*** |
|
CV |
7.6 |
7.8 |
3.6 |
0.7 |
Table 13: Effect of inoculation of rhizobial on nodulation and growth parameters of field pea under greenhouse conditions
Means in the same column followed by the same letter are not significantly different at the 5% probability level by Duncan test. *** = significant at P= 0.001; CV = coefficient of variation
3.6. Effect of inoculation rhizobia inoculants on yield and yield components of field pea
Number of pods Plant-1:
The different inoculation treatments showed variations on the number of pods plant-1 ranging from 7.7 pods/plant (negative control) up to 14.7/plant (inoculated plants with FBR15 and the standard strain 1018) which was similar to plants fertilized with nitrogen fertilizer. They showed significant difference up to 50% increase with uninoculated treatments and produced 13% more pods than the other rhizobial treatments FBR 11 and FBR23 (Table 14). Seed inoculation might have increased nitrogen supply to crop plants, which ultimately resulted in more number of pods plant-1. This result was similar with the findings of Ahmed et al., (2007) who conducted experiment with field pea and reported that Rhizobium inoculant significantly increased number of pods compared to inoculated (14.45pods/plant) and uninoculated control (9.25pods/plant).
Number of seeds pod-1 :
Inoculation of different rhizobial strains showed significant difference in number of seeds pod-1. The maximum number of seeds pod-1 was 6.3 and 6.0 obtained from the plant inoculated with strain-1018 and isolate FBR 15 respectively, showing significance difference from other treatments. Accordingly, these effective inoculants produced twice as much number of seeds per pod over the negative control (3.3 seed/pod) and more than 20% of number of pods produced with other treatments (table 4.4). Similar results also obtained by Ahmed et al., (2007) in pea the highest number of seeds pod -1 (6.5) was found in rhizobial inoculation. Solaiman and Rabbani (2005) observed that rhizobium inoculunt alone produced 6.3 seeds per pod of pea than the uninoculated control (3 seeds pod -1).
Total biomass or biological yield (BY) production (kg ha‐1):
Analysis of variance indicated that total biomass (biological yield) (3491-3584kg/ha) compared to the 2656kg/ha obtained from uninoculated negative control plants indicating a 25% increase between the inoculation treatments and the negative control (Table 14) of field pea was significantly (P<.001) improved due to different treatments. Similar results also obtained by Clayton et al., (2004) in pea the highest biomass yield 3620kg/ha was found in rhizobial inoculation and 2731kg/ha from non-inoculated.
1000 seed weight (gm):
The response of inoculation to rhizobial inoculants was significant on weight of 1000 seeds of field pea (P=0.001) compared with the control. The maximum mean weight of 492 for 1000 seeds was recorded from plants inoculated with the isolate FBR 15, strain 1018 and the plants fertilized with Nitrogen (Table14). The treatments with the most effective inoculants significantly increased up to 20% and 50% of 1000seed weight/gm of the other inoculants (FBR11, 23) and the negative control plants, respectively. This finding has difference with the result of Ahmed et al., (2007)) who obtained the highest 1000-seed weight of pea with the rhizobial inoculation treatment 289g and non-inoculated 243g. Rabbani et al., (2005) obtained similar result in pea crop. Maximum 1000 seed weight of 488 g obtained when plants were inoculated with Rhizobium strains and 47.2 % increases over uninoculated control.
|
Treatment |
No of pod/plant |
No of seed /pod |
BY (kg ha-1) |
1000seed wt(gm) |
TGY (kg ha-1) |
|
Control |
7.7c |
3.3c |
2656b |
257c |
1879.4c |
|
Recommended N |
14a |
5.3b |
3584.3a |
492a |
2544.9a |
|
FBR 15 |
14.7a |
6a |
3577a |
491.7a |
2539.5a |
|
FBR 11 |
12b |
5b |
3491a |
407.5b |
2432.3b |
|
FBR 23 |
12.7b |
5.3b |
3498a |
388.7b |
2389.8b |
|
Strian 1018 |
14.7a |
6.3a |
3583a |
492.3a |
2537.7a |
|
F value |
*** |
** |
* |
*** |
*** |
|
CV |
4.1 |
10.2 |
1.3 |
3.3 |
0.4 |
Table 14: Effect of rhizobial inoculation on yield parameters of field pea under field conditions
Means in the same column followed by the same letter are not significantly different at the 5% Probability level by Duncan test. *, ** and *** = significant at P= 0.05, 0.01 and 0.001 respectively; CV = coefficient of variation
Total Grain Yield (kg ha-1):
The different treatments also significantly affected grain yield of field pea (P=0.01) (2389.8-2544.9kg/ha compared to the negative control (1879.4) (Table 15). Except the negative control, the different treatments did not show significant difference amongst one another. The increase in yield may be due to effective nodulation and nitrogen fixation of different rhizobial isolate inoculation on total grain yield of field pea. These results have similarity with those of Carr et al., (2000) they found no difference in total grain yield when different rhizobial inoculant were used which is found the highest grain yield (2678.6kg/ha) was recorded in inoculated and (2047kg/ha) uninoculated control.
3.7. Effect of rhizobia isolates inoculation on total N and N up take from grain and straw
Grain total N and N up take:
The field pea plants inoculated with the most effective rhizobial inoculants; strain-1018 and isolate FBR15 significantly increased total N content and N uptake of grain up to 4% and 102 kg ha-1 , respectively.( (P=0.001) which was more than 32% and 46% of the total N content and N uptake recorded from the uninoculated negative control plants (Table 15). The data also showed that these inoculants were more effective (12-14% increases) in accumulation of grain nitrogen content and grain N uptake than the other inoculants (FBR 11 and FBR 23). Similar results have also been reported by Shabir et al., (2010) that bacterial inoculation increased total N content (3.8%) significantly compared to control (2.6%) in field pea.
Straw total N and N uptake:
The highest straw N (3.3%) and N uptake (108.6 kg ha-1) of the field pea plants was recorded from plants inoculated with strain-1018 and isolate FBR 15 (Table 15). This was significantly different in N content (33%) and N uptake (45%) compared to the uninoculated plants (negative control plants and 12 % more than the other inoculated plants (with FBR 11 and FBR 23) in both parameters. The lowest straw N (2.2%) and N uptake (61.6 kg ha-1) was recorded from the non-inoculated control plant. This result similar to the finding of Shabir et al., (2010) recorded straw N content (30-35%) and N uptake (47%) compared to the uninoculated field pea plants.
|
Treatment |
Grain N |
Straw N |
Seed protein |
%Ndfa |
||
|
Total N (%) |
Uptake (Kg ha-1) |
Total N (%) |
Uptake (Kg ha-1) |
% |
% |
|
|
Control |
2.9c |
55.1c |
2.2c |
61.6c |
18.3c |
64.8c |
|
Recommended N |
3.4b |
88.4b |
2.8b |
100.4a |
21.7b |
70.2b |
|
FBR 15 |
4.0a |
100.4a |
3.3a |
108.4a |
25a |
74.3a |
|
FBR 11 |
3.5b |
85.7b |
2.7b |
92b |
22b |
71b |
|
FBR 23 |
3.5b |
84.4b |
2.7b |
92.5b |
22.1b |
70.8b |
|
Strian 1018 |
4.1a |
102.1a |
3.3a |
108.6a |
25.1a |
74.4a |
|
CV |
3.4 |
3.5 |
3.7 |
4.1 |
3.3 |
6.6 |
|
F value |
32.4*** |
96.7*** |
19.6*** |
61.9*** |
34.3*** |
21.5* |
Table 15: Effects of rhizobial inoculation on Ndfa (BNF), N contents of grain and straw andseed protein of field pea under field conditions
*and *** = significant at P= 0.05 and 0.001 respectively; CV = coefficient of variation
The result obtained in this study (table 16) also indicated that positive correlations were observed with respect to the number of nodule and shoot dry weight (r = 0.49, p<0.05), number of nodule and number of pod (r = 0.59, p<0.01), number of nodules and total grain yield (r = 0.56, p<0.05), and shoot dry weight and N content (r = 0.73, p<0.001). This result also Similar to the finding of Khondaker et al., (2003) obtained strong positive correlation between nodule dry weight and N content (r=0.563, p<0.01) for pea plant.
|
TGY NS NP SDW NN SN |
|
|
|
TGY 1.00000 |
|
|
|
|
|
NS 0.81960 1.00000 |
|
<.0001 |
|
|
|
NP 0.95485 0.82734 1.00000 |
|
<.0001 <.0001 |
|
|
|
SDW 0.87015 0.74527 0.89715 1.00000 |
|
<.0001 0.0004 <.0001 |
|
|
|
NN 0.56521 0.63180 0.59617 0.49362 1.00000 |
|
0.0145 0.0049 0.0090 0.0374 |
|
|
|
SN 0.80791 0.89454 0.85961 0.73468 0.80466 1.00000 |
|
<.0001 <.0001 <.0001 0.0005 <.0001 |
Table 16: Pearson Correlation coefficient of same parameters
3.8. Seed protein:
The inoculated field pea plants with the effective inoculants (FBR 15 and standard reference strain) showed the highest seed protein content (25%) and the lowest seed protein content 18.3% in negative control, this indicating a significant difference (p < 0.001) among treatments. In general, the most effective rhizobia increased seed protein by 28% and 12% compared to the uninoculated control and other rhizobial inoculated plants, respectively (Table 15). This result similarly to the finding of Solaiman and Rabbani (2005) found that the highest seed protein content (24.6%) in inoculated and 17.4% in non-inoculated.
3.9. Nitrogen Derived from Fixation (Biological nitrogen fixation):
Rhizobium inoculation of field pea showed significance variation (p < 0.05) in %Ndfa (Table 15). The highest Ndfa (74.4%) was recorded in plants inoculated with strain 1018 followed by plants inoculated with isolate FBR 15, whereas non inoculants resulted in the lowest Ndfa (64.8%). Seed inoculation significantly influenced the amount of N fixed, which increased and significantly difference between inoculated and the control. The best criteria for a rhizobium used as bio-fertilizer is that it must be highly effective in nitrogen fixing ability forming symbiotic association with the host plants (O’ Hara et al., 2002). This result similar to the result of Clayton et al., (2004) documented that the highest nitrogen fixation 76.2% from rhizobial inoculation and the lowest nitrogen fixation 59% from the control field pea plant.
4. Conclusion and recommendation:
The result of this experiment indicated that inoculation of selected rhizobial isolate FBR 11, FBR 15 and FBR 23 improved number of nodule, nodule dry weight, shoot dry weight, number of pod plant-1, number of seed pod-1, grain yield, N content, seed protein and nitrogen fixation as compared to one commercially released rhizobial strain, recommended N and the control Also from the results of the correlation analysis showed that the nodule number was directly and highly significantly (p≤ 0.01) correlated with shoot dry weight (r=0.49), number of pod (r=0.59), number of seed (r=0.63), total grain yield (r=0.56) and N up take (r=0.80). The result indicated that there was no significant difference between rhizobial isolate FBR15 and commercial rhizobial strain 1018 but there was significant difference with rhizobial isolate FBR 11 and FBR 23. Also selected rhizobial isolates was shown that highly effective and competitive. Based on the findings of this study, inoculation with selected rhizobial isolates improved nitrogen uptake and symbiotic nitrogen fixation efficiencies in field pea.
From the result of this study selected rhizobial isolate FBR 15 can be recommended as bio-fertilizer for better field pea production in the future.
5. Data Availability:
The data used to support the findings of this study are available from the corresponding author upon request.
6. Conflict of Interest:
The authors declare that they have no conflicts of interest.
7. Acknowledgement:
The authors express gratitude to Ethiopian Institute of Agriculture Research, Addis Ababa University and IITA (International Institute of Tropical Agriculture)

Open Access By Aditum Open Access Journals id licensed under Creative Commons Attribution 4.0 International License. Based On a Work at aditum.org