Agricultural Research Pesticides and Biofertilizers
OPEN ACCESS | Volume 6 - Issue 1 - 2026
ISSN No: 2994-0109 | Journal DOI: 10.61148/2994-0109/ARPB


Onuwa G.C1*, Obasi P.C2 and Eze C.C2
1Department of Agricultural Extension and Management, Federal College of Forestry, Jos, Plateau state, Nigeria.
2Department of Agricultural Economics, Federal University of Technology, Owerri, Imo state, Nigeria.
*Corresponding authors: Onuwa G.C, Department of Agricultural Extension and Management, Federal College of Forestry, Jos, Plateau state, Nigeria.
Received: December 16, 2021
Accepted: December 30, 2021
Published: January 12, 2022
Citation: Onuwa G.C, Obasi P.C and Eze C.C. (2022) “Determinants of Market Margins among Okra Traders.”, Journal of Agricultural Research Pesticides and Biofertilizers, 3(2); DOI:http;//doi.org/01.2022/1.1057
Copyright: © 2022 Onuwa G.C. This is an open access article distributed under the Creative Commons Attribution License, which permits unrestricted use, distribution, and reproduction in any medium, provided the original work is properly cited.
In the tropics, Okra is an important vegetable crop and its production is a viable livelihood activity; however, several factors affect its marketing and margins derivable thereof. This study therefore analysed the determinants of market margins among okra traders in Owerri, Imo State, Nigeria. Multistage sampling technique was employed for this. Descriptive statistics, market performance analysis and regression analysis, were the analytical techniques adopted for this study. The most important marketing channel was Channel 5 with a sales volume of 90%. The estimated market margin was ₦1900/bag (100kg). Also, the estimated market efficiency index was 0.34, implying that the marketing of okra in the study area was inefficient. The estimated coefficient of multiple determination (R2) was 0.717, which implies that 72% of the variation in the market margin of okra was accounted for by the independent variables in the regression model. They identified constraints of okra marketing were very critical among respondents in the study area. Based on the findings of this study, effective transportation, improved credit supply, market infrastructure and commodity price information dissemination are strongly recommended.
Introduction:
Okra (Abelmoschus esculentus L. Moench) is an important vegetable crop. It features prominently in vegetable markets in the South-eastern Nigeria (Schippers, 2000). The economic importance of Okra cannot be overemphasized. It contains carbohydrate, proteins and vitamin C in large quantities and plays a vital role in the human diet (Kennedy et al., 2011). Worldwide production of Okra as fruit vegetable is estimated at 6 million tonnes per year. In West Africa, it is estimated at 500,000 to 600,000 tonnes per year (Bamire and Oke, 2003). Proper marketing is necessary to mitigate wastage (Farinde, et al., 2007). Marketing efficiency becomes an important determinant factor to the performance of the industry. Poorly developed marketing systems lead to production gains being wasted due to postharvest losses (Adesope et al., 2009). Marketing systems in most developing countries are characterized by operational inefficiencies as a result of poor postharvest handling and socioeconomic constraints reducing marketing margins and efficiency (Obasi, 2008). A market could be defined as a set of conditions and activities that facilitate a transaction whether or not the parties physically meet (Agba, 2006). Marketing is a function that assesses consumer needs and then satisfies them by creating an effective demand for, and providing the commodities and services required by consumers (Ariyo, et al., 2013). Market denotes the interaction of the forces of demand and supply, irrespective of the physical location of buyers and sellers. Agricultural marketing involves numerous lines of activities, which, if well developed, can sustain livelihood (Alufohal, 2002). Agricultural marketing engages about 60% of the Nigerian population, majority of who are small scale traders (Anuebunwa, 2006). Without markets, agricultural production remains stagnant. Markets dictate how often producers will increase and/or produce their output (Oluwatayo et al., 2003). In market analysis, determination of marketing margin is important. Marketing margin for a particular commodity is the difference between the price the consumer pays for the final product and the amount the producer receives (Arene, 2003; Toure and Wang, 2013). It is an important tool in analyzing market performance and efficiency (Achike and Anzaku, 2010). Market performance is an assessment of how well the marketing process is carried out and how successfully its aims are accomplished (Eronmwon et al., 2014). Market structure refers to characteristics of the market believed to influence the nature of competition and the process of price formation. Agricultural commodities produced by farmers must be assembled, stored, transported, processed and delivered in the form needed, at the time and to the places desired by consumers (Anuebunwa, 2006). The importance of agricultural marketing cannot be over emphasized. Marketing of okra is not without challenges and is characterized by the problem of perishability. The performances of commodity marketing have indicated very low marketing margins (Iheke, 2010). Often marketers are compelled to sell their product at a very low price to avoid waste or total loss, and this reduces marketing margins and efficiency. In addition, little information exists concerning okra market structure, performance and its determinants; this study fills this knowledge. Understanding market channel provides relevant information concerning operational mechanism of markets and thus a basis of reducing marketing inefficiencies along the market chain.
Research Objective:
This study investigates the determinants of market margins among okra traders in Owerri, Imo state; while the specific objectives were to;
Methodology:
Study area:
The study was conducted in Owerri the capital of Imo State, Nigeria; set in the rain forest heartland of the south eastern region and is approximately 40 square miles (100km2) in area. It comprises; owerri municipal council, Owerri- west and Owerri-north. The state lies within latitudes 4045’N and 70 15N, and longitude 6050’E and 7025’E and it is divided into twenty-seven (27) local governments areas (LGAs) namely; Owerri North, Owerri West, Owerri Municipal, Aboh-mbaise, Ahiazu-mbaise, Ehime Mbano, Ezinihitte, Ideato North, Ideato South, Ihitte/Uboma, Ikeduru, Isiala Mbano, Isu, Mbaitoli, Ngor Okpala, Njaba, Nwangele, Nkwerre, Obowo, Oguta, Ohaji/Egbema, Okigwe, Onuimo, Orlu, Orsu, Oru East, Oru West (http://www.imostate.com/imo-LGA’Shtml, 2006). The population density varies from 230-1400 people per square kilometre. The population of Imo state is predominantly rural (http://www.imostate.com/2006).The climate of Imo state is typically humid. Rainfall distribution is bimodal, with peaks in July and September and breaks in August. Annual rainfall varies from 1,990mm to 2,200mm; with mean annual temperature above 200C. Imo state has an average annual relative humidity of 75%, which is highest during the rainy season, when it rises to about 90%. The major agriculture zones in Imo state are Owerri, Orlu and Okigwe (FAOSTAT, 2009).
Method of Data Collection:
Primary data for the study were collected using well-structured questionnaires.
Sampling Techniques:
Multi-stage sampling technique was employed for this study. The first stage involved the purposive selection of Owerri comprising; Owerri municipal, Owerri west LGA and Owerri north LGA out of the 27 LGAs in the State, given the predominance of trading activities in the area. The second stage involved a purposive selection of six (6) major commodity markets in the study area, namely Owerri main market, relief market, new market, Nkwo-Ukwu Ihiagwa market, Ezi-Obodo market and Obinze market, based on the concentration of vegetable marketing activities and their market size, while in the third stage 90 okra traders from the commodity markets were randomly selected as respondents for this study.
Analytical Techniques:
The following analytical tools were used for this study; descriptive statistics (frequency counts and percentages) was used to analyze objectives i and iv; Market performance analysis (marketing margin and efficiency) was used to analyze objective ii; and Ordinary Least Square (OLS) regression model was used to analyze objective iii.
Model Specification:
Market Performance:
An efficient marketing system minimizes the cost of a marketing process; ensures greater returns to producers while at the same time provide final consumers with quality products and at a reasonable price. In measuring market performance, marketing margin and marketing efficiency analysis were employed.
Market Margin Analysis:
The marketing performance of okra was assessed by the computation of marketing margins. Market margins are the difference between prices at different market levels in the marketing system. Marketing margin measure the share of the final selling price that is captured by a particular class of trader in the marketing chain. However, the term also refers to the difference between producer and consumer prices of an equivalent quantity and quality of a commodity or it may also be described as price differences between two points in the marketing chain. Market margin (Profit) is an important measure in trade transactions, as it gives the trader a measure of how much profit it’s making on merchandise sales, the size of a marketing margin indicates the amount of value (profit) added by marketing system. The total marketing margin may be subdivided into different components; all the costs of marketing services and profit margins or net returns. An analysis of marketing costs would estimate how much expenses were incurred for each marketing activity. It would also compare marketing costs incurred by different actors in the path of distribution. The analysis of marketing margin was computed by comparing the difference between okra selling and cost prices at different trade levels. The computation employed the following formula presented in equation (1):
MM = P2- P1 ……………………………………………………………………… (1)
Where;
MM = market margin between level 1 and 2 in (₦/kg);
P1 = price at market level 1(farm gate/cost price and marketing costs), in (₦/kg);
P2 = price at market level 2 (selling price) in (₦/kg).
Marketing Efficiency:
A marketing efficiency is a ratio of marketing margin to marketing costs (Sreenivasa et al., 2007). Marketing efficiency is the maximization of ratio of output to input. Marketing efficiency is the most frequently used measure of market performance. Improved marketing efficiency is a common objective of farmers, wholesalers, retailers, commodity traders. The following marketing efficiency notation was adopted in this study and presented in equation (2).
M. E. = Marketing margin (profit)/ Cost of marketing………………………………….. (2)
Note;
If M.E. = 1, marketing is efficient
If M.E. < 1, marketing is inefficient
If M.E. >1, marketing is highly efficient
Ordinary Least Square (OLS) Regression Model:
The Ordinary Least Square (OLS) regression was used to determine the factors affecting marketing margin of okra. The Ordinary Least Square (OLS) regression model gave the best fit and was chosen as the lead equation on the basis of the number of significant variables, magnitude of the coefficients, statistical and econometric criteria. The OLS regression was used to establish the effects of socio-economic characteristics of the respondents on marketing margin of okra (Wissmann, et al., 2007; Greene, 2002). The implicit form of the model is expressed in equation (3);
yi = ßo + ßixi +ei ………………………………………(3)
Where:
yi = Marketing margin (₦/kg)
xi = vector of the predictors (independent variables)
ßi = vector of the estimated parameters.
ßo = Intercept term
ei= error term
In its explicit form, the model is expressed as follows in equation (4);
Y = β0 + β1X1 +β2X2+β3X3+ β4X4 + β5X5 + β6X6 + εi……………..… (4)
Where;
Y = Marketing margin (₦/100kg bag)
β0 = intercept
β1 – β6 = Coefficient of parameters to be investigated
X1 = Gender (yes=1; no=0)
X2 = Marital status (married=1; single=0)
X3 = Marketing experience (years)
X4 = Marketing information access (yes=1; no=0)
X5 = Quantity supplied (kg)
X6 = Marketing cost (₦)
εi = Error term.
Results and Discussion:
Marketing channels for Okra:
Figure1: Flowchart of the marketing channels for Okra:
Channel 1: Producers à Consumers = 30%
Channel 2: Producersà Retailersà Consumers = 60%
Channel 3: Producersà Wholesalersà Consumers = 55%
Channel 4: Producersà Wholesalersà Retailerà Consumers = 80%
Channel 5: Producersà Commission agentsà Wholesalersà Retailersà Consumers = 90%
Channel 6: Producersà Commission agentsà Retailersà Consumers = 75%
Channel 7: Producersà Commission agentsà Wholesalersà Consumer = 65%
Channel 8: Producersà Commission agentsà Consumers = 50%
Eight marketing channels were identified for Okra. Channel comparison for Okra was done based on the percentage (%) of commodities that passed through each marketing channel. Figure 1 therefore indicated that the marketing channel with the highest percentage of commodities flowing through it was channel 5 with a sales volume of 90%, followed by channel 4 (80%), and channel 6 (75%). This result corroborates with Ojo et al., 2014; Horna and Gruere, 2006 who also identified similar market channels.
Market Performance:
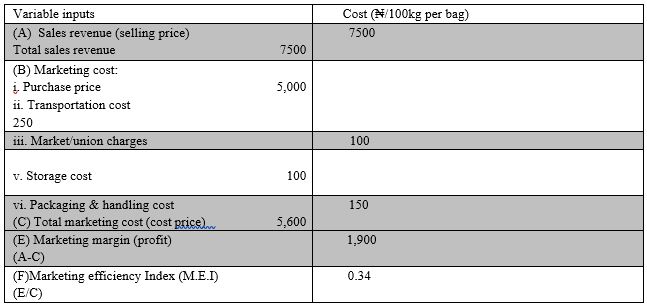
Table 1: Marketing Margin and Efficiency of Okra
Source: Field Survey, 2015
Table 1 revealed the results of Market performance (marketing Margin and efficiency). The estimated market margin was ₦1900 per 100kg bag; this is an indication that okra marketing is relatively profitable business venture in the study area. Also, the estimated market efficiency index was 0.34, implying that the marketing of okra in the study area was inefficient. This result corroborates with Iheke (2010) who reported similar market margins and efficiency index for agricultural crops.
Factors Affecting Market Margins:
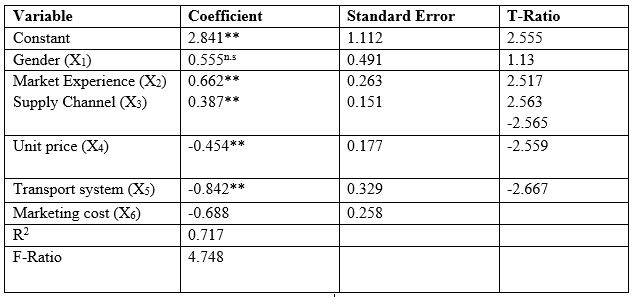
Table 2: Determinants of Market Margins of Okra
Source: Field Survey 2015; **= Significant at 5% (P<0.05) Level; N.S = Not Significant
Table 2 presents the Ordinary Least Square (OLS) regression analysis. The OLS regression was used to establish the effects and determine the factors affecting market margins of okra in the study area. The estimated coefficient of multiple determination (R2) was 0.717, which implies that 72% of the variation in the market margin of okra was accounted for by the independent variables in the regression model. The F-ratio (4.748) is significant at P < 0.05 (5%) level, implying that the variables (xi) in the regression model accurately predicts the outcome variable (yi). Therefore, the regression model is well fitted to the data set, suggesting a linear relationship among the variables.
Marketing Experience (x2):
The coefficient of marketing experience (0.662) was positive and statistically significant at 5% level. Hence, the number of years a respondent spends in performing any marketing function directly influences their marketing experience and thus improved efficiency in commodity marketing over a time period.
Supply Channel (x3):
The coefficient of supply channel (0.387) was positive and significant at 5% level, suggesting that market linkages among the various marketing channels were efficient in the study area. This result corroborates with the works of Ugwumba (2009) on agricultural commodity marketing.
Unit price (x4):
The coefficient of unit price per bag (-0.454) was negative and significant at 5% level, implying that as commodity prices increase quantity demanded will decrease and hence quantity sold also decreases. This result corroborates with the works of Ugwumba (2009) on agricultural commodity marketing.
Transportation System (x5):
The coefficient of transportation system (-0.842) was negative and significant at 5% level, implying that as inefficiency in transportation system increases there will be a decline in quantity supplied and hence the quantity of bags sold. This result corroborates with the works of Ugwumba (2009) on agricultural commodity marketing.
Marketing Cost (x6):
The coefficient of marketing cost (-0.688) was negative but statistically significant at 5% level, implying that increase in marketing costs affects the quantity of bags sold, hence this also increases unit cost per bag. Marketing cost is high due to varied market functions; this variable represents an inverse relationship with the quantity of bags sold by the okra traders. Policies aimed at reducing the marketing costs are necessary in order to increase the level of supply by the traders. A similar finding of an inverse relationship between marketing costs and the quantity supplied was noted with participants in agro commodity markets (Ayoola and Zever, 2010).
Constraints of Okra Marketing:
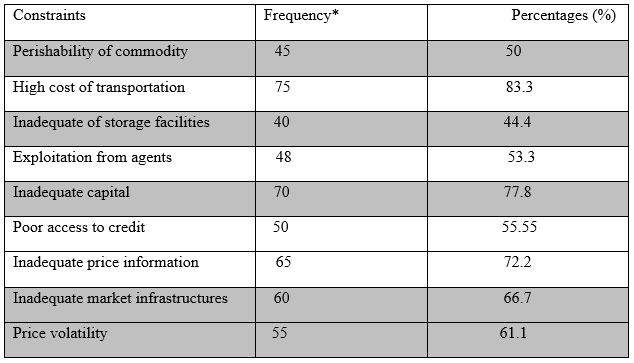
Table 3: Distribution based on the constraints of Okra Marketing
Source: Field survey, 2015; *Multiple responses were allowed
Table 3 revealed that the critical constraints that affect okra marketing in the study area. They identified constraints include; high cost of transportation (83.3%), inadequate capital (77.8%), inadequate price information (72.2%) and inadequate market infrastructures (66.7%). Others include; price volatility (61.1%), poor access to credit (55.55%), exploitation from agents (53.3%), perishability of commodity (50%) and inadequate storage facilities (44.4%). This result corroborates with Asa, et al. (2012) who also reported similar constraints in agricultural marketing.
Conclusion:
This study analyzed the determinants of market margins among okra traders in Owerri, Imo state, Nigeria. The results revealed several marketing channels in the study area. Also, okra marketing is a relatively profitable business venture; however low levels of market efficiency persists among the respondents. In addition, the variation in the market margin of okra was accounted for by the independent variables in the regression model. Furthermore, they identified constraints of okra marketing were very critical among the respondent. Based on the findings of this study, effective transportation system; improved credit supply; market infrastructure provision and effective commodity price information dissemination are strongly recommended to improve the market performance (margins and efficiency) as well as mitigate the identified constraints of okra marketing among the respondents in the study area.

Open Access By Aditum Open Access Journals id licensed under Creative Commons Attribution 4.0 International License. Based On a Work at aditum.org