Agricultural Research Pesticides and Biofertilizers
OPEN ACCESS | Volume 6 - Issue 1 - 2026
ISSN No: 2994-0109 | Journal DOI: 10.61148/2994-0109/ARPB


Md Ehsanul Haque1, Most Shanaj Parvin2*
1University of North Dakota, Grand Forks 58203, USA
2Bangladesh Agricultural Research Institute, Joydebpur, Gazipur-1701, Bangladesh
*Corresponding Author: Most Shanaj Parvin, Bangladesh Agricultural Research Institute, Joydebpur, Gazipur-1701, Bangladesh.
Received: July 05, 2021
Accepted: July 10, 2021
Published: July 20, 2021
Citation: Md Ehsanul Haque and Most Shanaj Parvin. (2021) “Proteomics Study of Pathogen-Induced Programmed Cell Death in Model Legume Medicago truncatula.”, Journal of Agricultural Research Pesticides and Biofertilizers, 2(1); DOI:http;//doi.org/07.2021/1.1030.
Copyright: © 2021 Most Shanaj Parvin. This is an open access article distributed under the Creative Commons Attribution License, which permits unrestricted use, distribution, and reproduction in any medium, provided the original work is properly cited.
Plants have elaborated efficient mechanisms to survive in the changing environmental conditions, particularly during pathogen infection. The early plant response to the microbial pathogens is often accompanied by the induction of reactive oxygen species (ROS) and an oxidative burst which leads to rapid cell death in and around the initial infection site, a reaction known as the hypersensitive response (HR). Besides, the induction of a programmed cell death (PCD) in plants is assumed to be a common response to many different types of biotic stress. There is now compelling evidence that the mitochondrion integrates diverse cellular stress signals and initiates the death execution pathway in animals; on the flip-side a similar involvement for mitochondria in regulating PCD in plants has so far received very little attention. In this research study, we focused on the cellular responses in M. truncatula inoculated with zoospores from the oomycete A. euteiches, which is a severe root pathogen for legume crop plants. Using the model legume as a platform and A. euteiches to induce HR, mechanisms taking place in the plant cells as a response to pathogen infection particularly in the mitochondria, were studied via proteomic tools. The most crucial part of establishing an in vitro inoculation system was to ensure contact between cells and zoospores. It has been noticed under microscopic studies that zoospores are in contact with plant cells even under in vitro conditions. As expected, inoculated cells showed a clear reduction of viability and a reduction in mass as compared to the mock control. Notably, at 10 hpi & at 20 hpi cell viability went down to 72% and 39% respectively, while in the mock control cell viability only dropped to 88% and 70%. H2O2 oxidative burst measurement assays with A. euteiches zoospores at 0 h, 10 h, and 20 h induced moderate oxidative burst reactions. Maximal average values were 3.0 μM (0 h), 2.4 μM (10 h) and 1.8 μM (20 h) H2O2 production. Interestingly, double inoculation (at ‘0 h &10 h’ and at ‘0 h & 20 h’) with zoospores showed less than 1.0 μM H2O2 production. At 24 hpi, purification of mitochondria by density gradient centrifugation revealed an additional sub-fraction was positioned just below 40% of Percoll (the mitochondrial are normally are of 23-40% Percoll). Notably, super complex I+III2 was observed absent while complex II, cyt c 1-1 & cyt c 1-2, dimeric complex III2, complex IV, and porin protein complexes were less abundant in BN gels of the mitochondrial sub-fraction as compared to the gels of expected fractions. As expected, porin complexes (VDAC), complex II, complex III, cytochrome c 1, prohibitin complex V were highly abundant in the expected mitochondrial fraction in contrast to mock. In IEF gels, 13 protein subunits were of increased abundance at 20 hpi, 24 hpi, and 40 hpi, for example complex I, complex II, complex III, and proteins involved in amino acid degradation, and protein folding. In gel free analyses, 13 and 11 proteins were of increased abundance in the inoculated mitochondrial fraction at 24 h and at 40 h, respectively. There was similar pattern in protein abundance as observed in the BN gels and in the IEF gels.
1. Introduction:
Legumes (Fabaceae or Leguminosae) are mostly grown agriculturally as a food grain seed (e.g. generally pulse, beans and lentils), for livestock forage and silage. They realize very specific interactions with endosymbiotic nitrogen-fixing rhizobial bacteria in special structures called nodules that persuade the host plant to produce high protein content. There are more than sixteen thousand legume species described belonging to 650 genera (Colditz and Braun 2010). Most of them exhibit large genome sizes and polyploidy which both limits their suitability for genomic research (Young et al., 2011).
In the early 1990s, Medicago truncatula was considered as a model plant for studying legume biology (Bell et al., 2001). It is an autogamous legume, which exhibits short regeneration time, is diploid (2n = 16) and has a comparatively small genome size of about ~550 million base pairs (Mbp) (Blondon et al., 1994; Bell et al., 2001; Young et al., 2011). It is closely related to many economically important legumes and its genome sequence is known (Cannon et al., 2009; Young et al., 2011). Considering the vital role of legumes in sustainable food production worldwide and the susceptibility of Medicago to important legume pathogens, its investigation in respect to programmed cell death and host energy metabolism is of high relevance for agriculture.
Among the soil-borne pathogens, the virulent oomycete Aphanomyces euteiches causes a severe root rot in legumes and is regarded as an important yield reducing factor, particularly in temperate and humid climates (Gaulin et al., 2007). M. truncatula is not only susceptible to plant pathogens but also represents a suitable model system for studying plant pathogen interactions in temperate regions. Belonging to the galegoid clade, it is of close phylogenetic proximity to other legumes of economic importance like Pisum, Vicia, Lens and Trifolium species. In accordance with these species, Medicago is infected with severe root rot causing oomycete pathogens, primarily from the genera Phytophthora, Pythium and Aphanomyces. While the physiological aspects of many pathogeneses are well established, often little is known about the molecular mechanisms of these associations and most significantly the cellular response of the host plant.
Furthermore, it is now well accepted that reactive oxygen species (ROS), especially hydrogen peroxide (H2O2), play a pivotal role during the establishment of these associations and also act as a modulator of plant programmed cell death (PCD). The plasma membrane associated NADPH oxidases known as respiratory burst oxidase homologues (RBOHs) are shown also to function in ROS production during plant-pathogen interactions (Andrio et al., 2011; Kiirika et al., 2012).
Plant PCD differs genetically and morphologically from the mechanisms taking place in fungi and animals. For instance, classical PCD typically features mitochondrial morphology transition (MMT), condensation of the cytoplasm and its shrinking, detachment of the plasma membrane from the cell wall (in case of fungi) and nuclear condensation (Logan and Scott 2008).
There is now compelling evidence that mitochondria integrate diverse cellular stress signals and initiate the death execution pathway in animals. On the flip-side involvement of mitochondria in regulating PCD in plants has so far received very little attention.
This research study focuses on the cellular responses in the model legume (M. truncatula) inoculated by the oomycetes root pathogen Aphanomyces euteiches. In first instance, M. truncatula cell suspension cultures were established as a suitable host cell inoculation system for inoculation with A. euteiches zoospores to induce infection-like situations in accordance to Trapphoff et al., 2009. Successive defense mechanisms initiated in the plant cells as a response to the inoculation similar to hypersensitive response (HR) reactions and induced programmed cell death (PCD) known from the planta infections were monitored.
It was our aim to illustrate the cellular alterations of Medicago truncatula cells during inoculation pressure using a cell viability assay (via fluorescein diacetate FDA) and an oxidative burst assay or ROS [as of hydrogen peroxide (H2O2)] measurements, and subsequently mitochondria proteome was studied via gel-based and gel-free shotgun approaches.
2. Materials and Methods:
2.1. Plant material and inoculation with A. euteiches:
M. truncatula (‘Jemalong A17’) root-derived cell suspension cultures were used as the source material for this study. For inoculation with A. euteiches Drechs (ATCC 201684), mycelium was grown on 1.7% (w/v) corn meal agar (CMA; Sigma-Aldrich) by routine sub-culturing in the dark at 20°C for 2 weeks. Five to seven disks of 1 cm2 mycelia segments were excised by sterilized scalpel and cultured in 20 ml of maltose peptone broth (MPB) for 10 days at room temperature in the dark. Whitish, mycelial cottony structures were observed, and then washed with autoclaved lake water. This procedure was performed three times followed by an alternative two hours interval in each wash, and after 3rd wash the Petri-plates were incubated in the dark for 20 h to initiate zoospores production. Thereafter, the numbers of zoospores were counted under microscope using a Fuchs-Rosenthal chamber and the zoospores concentration was then adjusted to concentration of 1000000 zoospores per ml for the inoculation of the cell suspension cultures (Colditz et al., 2003). To investigate the pathogenic interaction between M. truncatula and the oomycete root pathogen A. euteiches, liquid suspension cell culture was exposed independently to two different treatments: i) cell cultures inoculated with lake water containing A. euteiches zoospores (treatment). ii) cell cultures were treated with autoclaved lake water that does not contain zoospores serving as mock control (control). For each treatment, 3 to 4 ml of the zoospores containing lake water (inoculums; treatment) and same volume of autoclaved lake water (control) were added to the 100ml of Medicago cell suspension culture flask on 7 days after sub-culturing. After treatment, flasks were wrapped with aluminum foil, and transferred to the shaker for 5 min shaking followed by 1st h of rest, another 5 min of shaking and an additional 2nd h of rest, Subsequently, cultures were shaken for 10 min followed by 3rd h of rest, a process which was repeated once by 2 h of resting and was then followed by continuous shaking after 6 h (Table 1).
|
Resting period (hour) |
Shaking period (min) |
|
1st |
5 |
|
2nd |
5 |
|
3rd |
10 |
|
4 to 5th |
10 |
|
6th |
Continuous shaking |
Table 1: Strategy of in vitro inoculation system/pathosystem of M. truncatula cell cultures and A. euteiches zoospores with alternative resting and shaking period
The following respective time points: 2 h, 4 h, 6 h, 8 h, 10 h, 12 h, 14 h, 16 h, 18 h, 20 h, 24 h and 40 h were considered just after inculcation for the host cells and zoospores interactions, for instance; each time point was repeated three times.
2.2. Cell viability (Vb) assay by fluorescein diacetate (FDA) hydrolysis:
Cell viability (Vb) assay was performed on cells of the treatment and control groups by using the non-fluorescent FDA which enters cells and undergoes hydrolyzation by an active esterase in living cells to yield the green fluorescent compound fluorescein (Winkelman et al., 1998). Three flasks were inoculated with A. euteiches zoospores and three flasks were treated with lake water used as a biological replication for each time point. One hundred micro liter of cell suspension cultures were mixed with 5 ul of FDA transferred onto a microscope slide and immediately covered with a slip before being placed on the stage of the fluorescence microscope (Axio Scope. A1. Dusseldorf, Germany). Seven to nine snapshot pictures for each of the prepared slide were taken and this process was repeated. Initially, total numbers of cells were counted visually from each of the picture and from there numbers of living cells were counted subsequently, percentages of living cells were figured out and later on mean values calculated (For each replication 7 pictures were evaluated and average value calculated). Three independent replications were considered for each of the time points: 2 h, 4 h, 6 h, 8 h, 10 h, 12 h, 14 h, 16 h, 18 h, 20 h, and 24 h (Appendix I).
2.3. Microscopic analyses of A. euteiches inoculation in M. truncatula cell cultures:
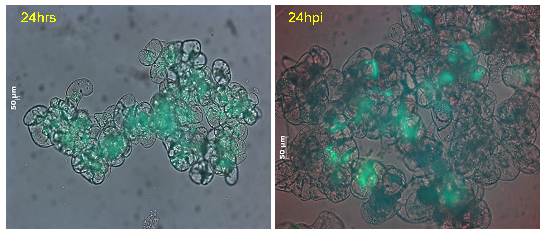
In order to evaluate germination and growth of A. euteiches in the M. truncatula inoculated cell-suspension cultures as well as any association established between both organisms, microscopic studies of the cell cultures at different time points: 2 hpi, 4 hpi, 6 hpi, 8 hpi, 10 hpi, 12 hpi, 14 hpi, 16 hpi, 18 hpi, 20 hpi, and 24 hpi after inoculation with the zoospores were performed side by side in the cell viability assay. Microscopic studies were carried out with a fluorescence microscope (Axio Scope A1, Düsseldorf, Germany) combined with a Nikon Digital-Sight DS-2MV camera.
2.4. Measurement of ROS concentrations:
For measuring the induction of reactive oxygen species during biotic stress an oxidative burst assay was performed to verify the responsiveness of M. truncatula cell cultures to Invertase (Mt_Invertase 50 μg ml-1), A. euteiches zoospores at 0 hours (Mt_Ae spores [0 h]), heat-treated A. euteiches zoospores at 0 hours (Mt_Ae spores [0 h, heat treated]), A. euteiches zoospores inoculation after 10 h, and 20 h (Mt_Ae spores [10 h], Mt_Ae spores [20 h]), double inoculation by A. euteiches zoospores after 0 h & at 10 h, and 0 h & at 20 h (Mt_Ae spores [0 &10h], Mt_Ae spores [0 & 20 h]), elicitor of A. euteiches (Mt_Ae elicitors), and mock controls (Mt_Ae controls [lake water]). These fractions were added independently to distinct different flasks and a luminol-based chemiluminescence assay was used to determine the production of hydrogen peroxide (H2O2) after 1 h of application of the treatments as described before (Trapphoff et al., 2009).
2.5. Isolation & Purification of mitochondria from cell cultures of M. truncatula:
M. truncatula (Jemalong A 17) cell suspension cultures were harvested at different time points: 4 h, 6 h, 10 h, 18 h, 20 h, 24 h, and 40 h for organelle preparations. Inoculated and mock treated (control) cells were processed in parallel. Each time point considered with three distinct preparations. The cells were filtered through 2 layers of gauze to remove growth medium and disrupted by using a chilled grinder (one time for 20 s at maximum speed followed by two grinding steps of 20 s at minimum speed, 1min breaks between each grinding step). The extraction buffer [450 mM of sucrose, 1.5 mM 3-(N-morph olino propane sulfonic acid (MOPS)-KOH at pH 7.4, 1.5mM EGTA, 0.6% (w/v) polyvinylpyrrolidone-40 (PVP 40), 0.2% (w/v) BSA, 0.2 mN phenyl methyl sulfonyl fluoride (PMSF), 14.3 mM β-mercapto ethanol] was prepared one day before. Large organelles cell debris and undisrupted cell aggregates were sedimented by two centrifugation steps: (i) 2700 g for 5 min at 4 °C and the supernatant was centrifuged again at (ii) 8300 g for 5 min at 4 °C. Mitochondria enriched organelle pellet was obtained by centrifugation of the supernatant at 20,000 g for 10 min at 4 °C. The organelle pellet was resuspended in 3 ml of wash buffer [300 mM sucrose, 10 mM MOPS–KOH at pH 7.2, 1 mM EGTA, 0.2 mM PMSF] and loaded onto Percoll density gradients centrifugation: 18–23–40% Percoll [v/v]) in gradient buffer [1.5 M Sucrose, 50 mM MOPS at pH 7.2 (5M KOH)]. Mitochondrial fraction was obtained via ultracentrifugation at 70,000 g for 90 min at 4 °C, observed as opaque band in between 23% to 40% Percoll interphase. A Pasteur pipette was used to remove the mitochondria from the opaque band, and washed with resuspension buffer [400 mM mannitol, 1 mM EGTA, 10 mM Tricine, 0.2 mM PMSF, pH 7.2 KOH] by two successive centrifugation steps at 14,500 g for 10 min at 4 °C as described in Dubinin et al., 2011. The weight of the mitochondrial pellets was determined before being resuspended in resuspension buffer to a concentration of 0.1 g mitochondria per ml (which approximately corresponds to 10 mg of mitochondrial protein per ml) (modified protocol of Dubinin et al., 2011).
2.6. Proteomic analyses:
2.6.1. 2-D BN/Tricine SDS-PAGE:
Mitochondrial OXPHOS system proteins were separated by 2-D blue-native/Tricine SDS-PAGE which allowed the evaluation of the purity of organelle preparations and status of the protein complexes of the respiratory chain. About 100 μl solubilization buffer [30 mM HEPES (hydroxyl-ethyl-piperazine-ethane-sulfonic, zwitterionic organic buffer) pH 7.4, 150 mM potassium acetate (CH3CO2K), 10% (v/v) glycerin, 2 mM PMSF, 5% (w/v) digitonin] was used to re-suspend 1 mg of protein, and incubated for 20 min on ice. Subsequently, the samples were centrifuged (18,500 g for 10 min at 4 °C) and 5 μl of blue loading buffer [5% (w/v) Serva Blue G, 750 mM aminocaproic acid (ACA) 5% (w/v) Coomassie 250 G] was added to the supernatants and protein samples were loaded onto a 4.5% to 16% acrylamide gradient gel. For each time point three independent mitochondrial isolations were prepared and from each isolation a single 2-D BN/SDS gel was prepared exclusively for monitoring the status of the respiratory chain protein complexes (modified protocol of Dubinin et al., 2011).
2.6.2. 2-D IEF/Tricine SDS-PAGE:
First instance, mitochondrial protein approximately 1 mg was resuspended in 100 μl lysis solution [8 M urea, 4% (w/v) CHAPS, 40 mM Tris base, 50 mM DTT, 0.2 mM PMSF], and afterwards incubated for 1 h at room temperature, and in addition 250 μl of rehydration solution [8 M urea, 2% (w/v) CHAPS, 0.5% of a carrier ampholyte mixture (IPG buffer 3–11 NL, GE Healthcare), 1.2% (v/v) Destreak solution (GE Healthcare), a trace of bromophenol blue, 20 mM DTT] was supplemented. It was performed with the IPGphor system (GE Healthcare, Munich, Germany) involving Immobiline DryStrip gels (18 cm) with nonlinear pH gradients (pH 3–11) and tricine SDS-PAGE electrophoresis as developed by Colditz et al 2005. Mitochondrial proteome gels were stained with 0.1% (w/v) Coomassie Brilliant Blue CBB (Serva, Amsterdam, the Netherlands) 48 h and scanned on an UMAX Power Look III Scanner (UMAX Technologies, Fremont, USA). For each time point’s three independent mitochondrial isolations was prepared and in respect of each isolation a single 2-D-IEF-SDS gel was prepared exclusively for monitoring the status of the soluble proteins (modified protocol of Dubinin et al., 2011).
2.6.3. Gel evaluation by alignment:
Protein gels of mitochondrial fraction were scanned and aligned horizontally and vertically with the corresponding gels for each time point’s and subsequently compared with 2D-BN-SDS gel map (www.gelmap.de) and IEF reference map (as described by Dubinin et al., 2011).
2.7. Tryptic digests of plant mitochondria for shotgun analyses:
Mitochondrial proteins (25 ug) were precipitated with ice cold methanol (200 ul) at 18,000xg for 10 minutes at 10°C, and the supernatants were removed. The pellets were washed with 90% MeOH, vortexes briefly, centrifuged as described above, and the supernatants were removed. The pellets were resuspended in 50µl of 0.1 M (pH 8) NH4HCO3 and mixed thoroughly using a Vortexer. Afterwards, 40 µl of 50 mM DTT and 50 mM NH4HCO3 were added and dissolved pellet by sonification for 5 min and incubated for 30 min at 50°C. Subsequently, 3 µl of 100 mM IAA/50 mM NH4HCO3 were added and incubated at room temperature in the dark. Then 5 µl of ACN were added and the solution was vortexed briefly. Five micro-liters of Trypsin-sln (20 µg in 100 µl) were added followed by brief vortexing and a short spin down. The solution was incubated over night at 37°C. Insoluble components were removed by spinning at 18300xg. The supernatants were dried down in a vacuum centrifuge and aliquots were prepared and stored at -20 ͦ C until MS analyses (protocol developed by Eubel, unpublished).
2.7.1. Sample preparation for MS analyses:
20 µl buffer P [2% (v/v) ACN, 0.1% (v/v) FA) were added to the dried peptides, sonicated for 5 min and the samples were then transferred into MS sample vials using gel loading tips and placed in the sample tray of the HPLC system (DionexUltiMate 3000, Thermo Scientific, Bremen, Germany) coupled to a tandem mass spectrometer (protocol developed by Eubel, unpublished).
2.7.1.1. LC-method:
High Pressure Liquid chromatography (HPLC) has a very highly sensitivity and separation power for the identification of the peptides from a complex mixture. MS samples were analyzed via DionexUlimate 3000 HPLC system (Thermo Scientific). Two columns were used for the analyses (i) Pre-column: It is 2 cm long, with a 75 µm inner diameter, and contains C18 material. The particles have a size of 3µm. The precolumn binds all peptides of the sample due to their hydrophobicity. (ii) Analytical column: This column is 50 cm long. All other parameters are identical to those of the precolumn. It is used to separate peptides which elute from the precolumn. In this method, a 4 h gradient was used with a flow rate of 200 nl/min. The gradient starts and ends with 98% A (H2O in 0.1% formic acid) and 2% B (Acetonitrile with 0.1% formic acid). The ratio of B increases over the time. Therefore, first hydrophilic and later hydrophobic peptides were detected and analyzed by the MS.
2.7.1.2. MS/MS method:
The Top10 method was used for shotgun analyses and MS-MS/MS cycles were carried out over the entire period. It followed the scan range for MS, 400-1600. A resolution of 70.000 and maximal injection time of 400 ms was used for precursor selection. In MS/MS mode, a resolution of 17.500 and a maximal injection time of 250 ms were used at an under-fill ratio of 0.5%.
2.7.1.3. Data analysis:
MS/MS spectra were loaded into the Proteome Discoverer software and searched with Mascot against a Medicago database. A mass tolerance of 10ppm was used for MS spectra and 0.05 Dafor MS/MS spectra. For peptide validation, a false discovery ratio of 0.01 (strict mode) and 0.05 (relaxed mode) were used. The search results were afterwards used for protein identification in Sieve.
For the label free quantitation, the software Sieve (Version 2.1, Thermo Scientific) was used and data evaluation was carried out using standard parameters. In this case only peptides within a retention time frame between 80 and 250 minutes were considered. For normalization of the samples, the number of peptides per run was used as a quantitative parameter.
3. Results:
3.1. Establishment of an inoculation and pathosystem of M. truncatula and A. euteiches:
The most challenging part of establishing an inoculation system is finding the right compromise between resting (attachment of the pathogen to the host cell) and shaking of the cell suspension cultures (oxygenation of the culture) to avoid oxygen deficiency while ensuring successful microbial interactions at the same time. After inoculation, cell cultures were allowed to rest for 6 hours in the dark, to ensure that the mobile zoospores (biflagellate) come in contact with the cells (Fig. 1). After each hour, the cells were shaken for 5 to 10 minutes to avoid suffocation. This way pathogenic interaction between Medicago cells and A. euteiches zoospores were established and considerable oxidative stress of the cell cultures was avoided (Trapphoff et al., 2009). In the dark, zoospores also interact with cultured cells and not only with root cells and this yields infection like profiles as known for plant-pathogenic root-infecting oomycetes (Gaulin et al., 2007).

Figure 1: Aeuteiches zoospores with M. truncatula (Jemalong A 17) cells in the suspension cultures at 4 hpi
3.2. M. truncatula cell viability at different time points of the inoculation:
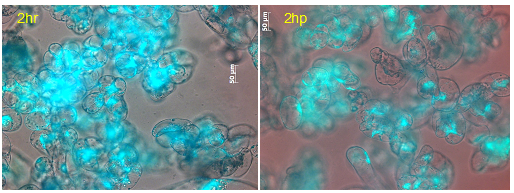
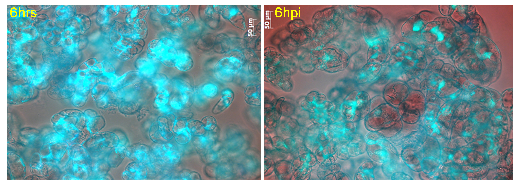
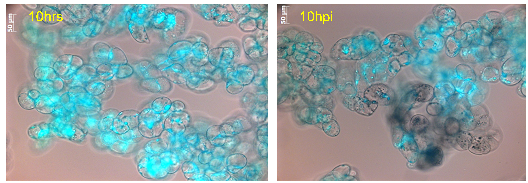
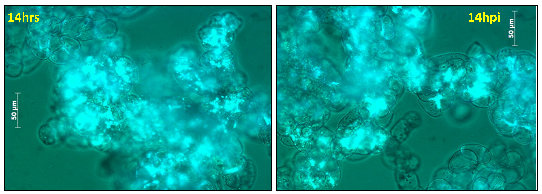
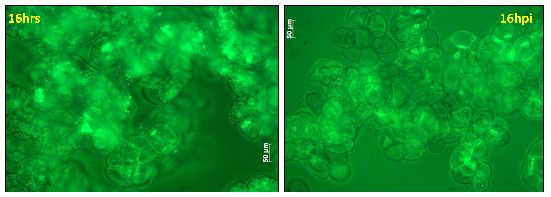
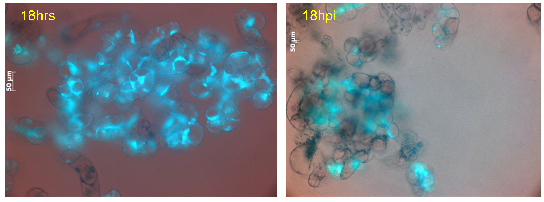
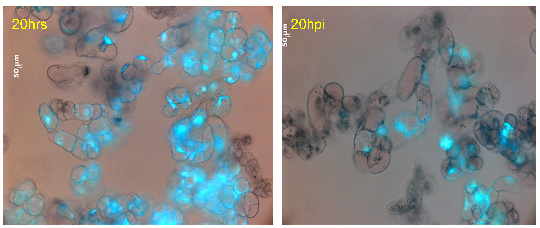
A cell viability assay was performed via fluorescein diacetate (FDA) after 2 h, 4 h, 6 h, 8 h, 10 h, 12 h, 14 h, 16 h, 18 h, 20 h, and 24 h. After 2 h, cell viabilities of the A. euteiches zoospores inoculated and lake water (mock) treated cell cultures were almost the same with mean viabilities of 94% and 93%, respectively (Figure 2). After 4 h, cell cultures inoculated with A. euteiches zoospores showed a gradual decline in cell viability to less than 85%. In contrast, viability of the lake water treated cell cultures remained unchanged to the 2 h time point. There was a steady decrease of cell viability in the presence of A. euteiches zoospores until the 6 h time point which showed a mean value of 72%. From here, viability rates were more or less constant until 14 h. interestingly, the lake water treated cell cultures showed a mean value of 93% which was also observed at 4 h time points of treatment. After 6 h, the mean value of the lake water treated cell cultures fell steadily to reach 75% after 18 h. After 14 h to onward, there has been a noticeable decrease of cell viability in A. euteiches zoospores inoculated cells. A good percentage of cell death occurred time points between 16 hpi and 18 hpi, which was approximately 20%. There was a steady fall at 20 h time points and a sharp decline at 24 h time points in the cell viability with A. euteiches zoospores inoculated cells which represented mean value of 39% and 27% respectively. Furthermore, the mean value of lake water (mock) treated cells at 20 h and 24 h time points was approximately 70%.

Figure 2: Assessment of cell viability of M. truncatula (Jemalong A 17) cell suspension cultures inoculated with A. euteiches zoospores or lake water (mock) via FDA staining at different time points: 2 h, 4 h, 6 h, 8 h, 10 h, 12 h, 14 h, 16 h, 18 h, 20 h, and 24 h. For each time point three independent replications were considered.
|
Figure 3: Cell viability of M. truncatula cell suspension cultures treated with lake water at 2 h tested via FDA, mean value 94% (representative image out of 61 snapshots). |
Figure 4: Cell viability of M. truncatula cell suspension cultures inoculated with A. euteiches zoospores at 2 hpi tested via FDA, mean value 93% (representative image out of 61 snapshots). |

|
Figure 5: Cell viability of M. truncatula cell suspension cultures treated with lake water at 4 h tested via FDA, mean value 93% (representative image out of 61 snapshots). |
Figure 6: Cell viability of M.truncatula cell suspension cultures inoculated with A. euteiches zoospores at 4 hpi tested via FDA, mean value 85% (representative image out of 61 snapshots). |
|
Figure 7: Cell viability of M. truncatula cell suspension cultures treated with lake water at 6 h tested via FDA, mean value 93% (representative image out of 61 snapshots). |
Figure 8: Cell viability of M. truncatula cell suspension cultures inoculated with A. euteiches zoospores at 6 hpi tested via FDA, mean value 72% (representative image out of 61 snapshots). |
|
Figure 9: Cell viability of M. truncatula cell suspension cultures treated with lake water at 8 h tested via FDA, mean value 92% (representative image out of 21 snapshots). |
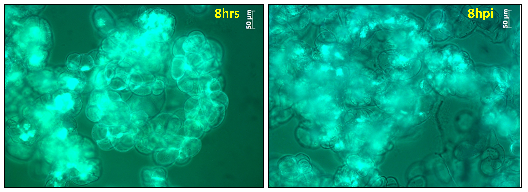
Figure 10: Cell viability of M. truncatula cell suspension cultures inoculated with A. euteiches zoospores at 8 hpi tested via FDA, mean value 72% (representative image out of 21 snapshots). |
|
Figure 11: Cell viability of M. truncatula cell suspension cultures treated with lake water at 10hrs tested via FDA, mean value 88% (representative image out of 61 snapshots). |
Figure 12: Cell viability of M. truncatula cell suspension cultures inoculated with A. euteiches zoospores at 10 hpi tested via FDA, mean value 72% (representative image out of 61 snapshots). |

|
Figure 13: Cell viability of M. truncatula cell suspension cultures treated with lake water at 12 h tested via FDA, mean value 86% (representative image out of 21 snapshots). |
Figure 14: Cell viability of M. truncatula cell suspension cultures inoculated with A. euteiches zoospores at 12 hpi tested via FDA, mean value 70% (representative image out of 21 snapshots). |
|
Figure 15: Cell viability of M. truncatula cell suspension cultures treated with lake water at 14 h tested via FDA, mean value 80% (representative image out of 21 snapshots) |
Figure 16: Cell viability of M. truncatula cell suspension cultures inoculated with A. euteiches zoospores at 14 hpi tested via FDA, mean value 69% (representative image out of 21 snapshots) |
|
Figure 17: Cell viability of M. truncatula cell suspension cultures treated with lake water at 16 h tested via FDA, mean value 77% (representative image out of 21 snapshots) |
Figure 18: Cell viability of M. truncatula cell suspension cultures inoculated with A. euteiches zoospores at 16 hpi tested via FDA, mean value 62% (representative image out of 21 snapshots) |
|
Figure 19: Cell viability of M. truncatula cell suspension cultures treated with lake water at 18 h tested via FDA, mean value 75% (representative image out of 61 snapshots) |
Figure 20: Cell viability of M. truncatula cell suspension cultures inoculated with A. euteiches zoospores at 18 hpi tested via FDA, mean value 44% (representative image out of 61 snapshots) |
|
Figure 21: Cell viability of M. truncatula cell suspension cultures treated with lake water at 20hrs tested via FDA, mean value 70% (representative image out of 61 snapshots) |
Figure 22: Cell viability of M. truncatula cell suspension cultures inoculated with A. euteiches zoospores at 20 hpi tested via FDA, mean value 39% (representative image out of 61 snapshots) |
|
Figure 23: Cell viability of M. truncatula cell suspension cultures treated with lake water at 24 h tested via FDA, mean value 67% (representative image out of 61 snapshots) |
Figure 24: Cell viability of M. truncatula cell suspension cultures inoculated with A. euteiches zoospores at 24 hpi tested via FDA, mean value 27% (representative image out of 61 snapshots) |
3.3. Oxidative burst assays in M. truncatula cell cultures:
Oxidative burst assays were performed for verification of the responsiveness of M. truncatula cell cultures to Invertase (Mt_Invertase 50 μg ml-1, Fig. 25), and for the following samples; A. euteiches zoospores at 0 h (Mt_Ae spores [0 h]), heat-treated A. euteiches zoospores at 0 h (Mt_Ae spores[0 h, heat treated]), A. euteiches zoospores inoculation at 10 h, and at 20 h respectively (Mt_Ae spores[10 h], Mt_Ae spores[20 h]), double inoculation by A. euteiches zoospores for ‘0 h & 10 h’ and ‘0 h & 20 h’ (Mt_Ae spores[0 & 10 h], Mt_Ae spores[0 & 20 h]), A. euteiches zoospores elicitor (Mt_Ae elicitors), and as negative control (mock) (Mt_Ae controls[lake water]) cell cultures inoculated with lake water. A luminol-based chemiluminescence assay was performed to determine the production of hydrogen peroxide (H2O2) during a period of 1 h after application. Among the tested treatments fractions the yeast invertase led to the highest values for the production of H2O2, with an average maximal concentration of 5.0 μM at 15 min after stimulation. By contrast, A. euteiches zoospores inoculation with culture media at zero 0 h, 10 h, and 20 h time points induced moderate oxidative burst reactions, reaching approximately half the maximum of the invertase treatment at 15 min; with averaged maximal values of 3.0 μM (0 h), 2.4 μM (10 h) and 1.8 μM (20 h) H2O2 production for the zoospores. After getting the peak of maximal H2O2 production, values for the oxidative burst declined gradually but were measured up to 55 min after treatment. Interestingly, also heat-treated A. euteiches zoospores induced an oxidative burst reaction of 1.2 μM H2O2. Similarly, A. euteiches elicitors, and two successive inoculations by A. euteiches zoospores after 0 h, 10 h, and 20 h, showed an average value which were close to 1 μM H2O2 production. As expected, the lake water did not provoke an escalated level of H2O2 production in any of the measurements carried out (Fig. 25).

Figure 25: Induction of oxidative burst in M. truncatula cell suspension cultures: after treatment with invertase (50 μg ml-1), A. euteiches zoospores after ‘0’ h, heat-treated A. euteiches zoospores after ‘0’ h, A. euteiches zoospores at 10 h and 20 h, two successive inoculation by A. euteiches zoospores after ‘0’ hours and either at 10 h and 20 h, A. euteiches elicitors, and lake water as negative control. Production of H2O2 was determined utilizing the luminal based chemiluminescence assay. The data shown are mean values with standard error of three biological replications.
3.4. Purification of mitochondria from M. truncatula cell suspension cultures:
The purity of the isolated compartment has great impact on the quality of a sub-cellular proteome. The M. truncatula cell suspension cultures inoculated with zoospores or treated with lake water or non-treated were subjected for the isolation of mitochondria at different time points; 6 h, 10 h, 18 h, 20 h, 24 h, and 40 h of post inoculation. Each time point was considered with three independent isolations. After differential centrifugation, three phase gradients (18-23-40%, [v/v]) of percoll, loaded with mitochondria enriched suspension prepared from etiolated photo synthetically inactive root derived M. truncatula cells. After ultracentrifugation, a single mitochondrial band appeared directly below the interphase of the 23%- 40% of Percoll phases (Fig. 26) in all the respective time points, while only a sub-mitochondrial fraction (just below 40%, Percoll gradients) was noticed at 24 hpi in the samples from the zoospores inoculated cell suspension, and further characterized via spectrophotometer and 2 D gel electrophoresis as described by Dubinin et al., 2011.
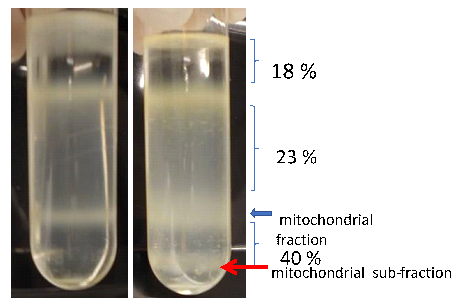
Figure 26: Three phase Percoll gradients (18-23-40%), loaded with mitochondria enriched fractions of M. truncatula cells at 24 h time points from lake water treated cells (left side) and A. euteiches zoospores inoculated cells (right side).
3.5. 2D BN/SDS-PAGE of mitochondrial protein complexes:
The M. truncatula mitochondrial proteome was analyzed via two dimensional (2-D) blue native (BN)/SDS-PAGE from mitochondrial fractions of cell suspension cultures, namely A. euteiches zoospores inoculated cells, and lake water treated (mock) or non-treated Medicago cells for the following time points: 6 h, 10 h, 18 h, 20 h and 24 h. Each time point was evaluated with three independent mitochondrial isolations and independent mitochondrial gels (Appendix II). The BN/SDS-PAGE system mainly traced the membrane bound more hydrophobic mitochondrial protein complexes; especially those protein complexes of the respiratory chain of plant mitochondria, I: complex I (NADH dehydrogenase), II: complex II (succinate dehydrogenase), III: complex III (cytochrome c reductase), III2: dimeric complex III, I+III2 : supercomplex composed of complex I and dimeric complex III, IV: complex IV (cytochrome c oxidase), V: complex V (ATP synthase), V2: dimeric complex V (Fig. 33-35) (Kiirika et al., 2013).
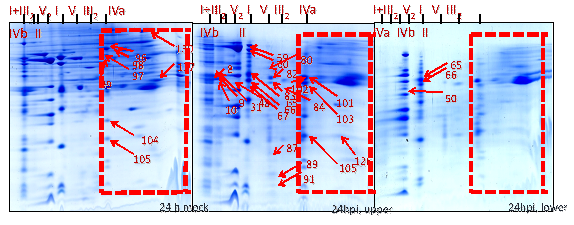
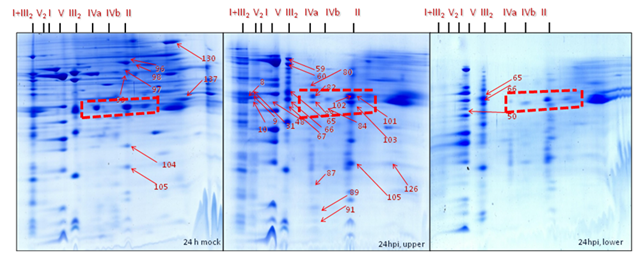
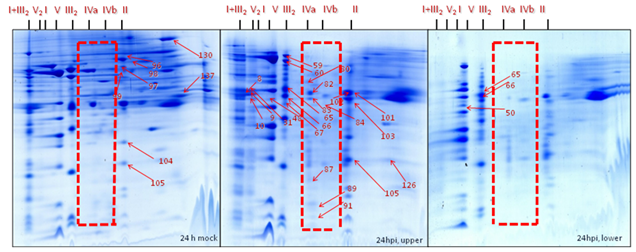
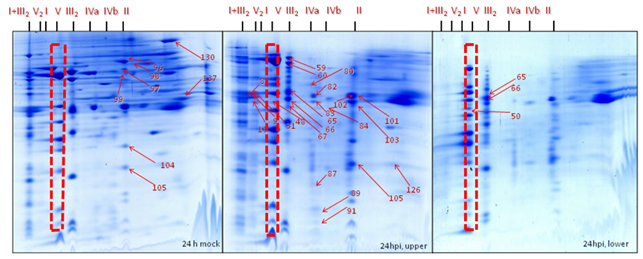
Interestingly, mitochondria isolated via ultracentrifugation at 24 hpi divided into two pronounced fractions in the Percoll gradients: (i) one upper mitochondrial fraction in between 23% to 40% of the Percoll gradients (in the expected area, light mitochondria) according to Dubinin et al., 2011, and (ii) one lower mitochondrial sub-fraction (heavy mitochondria) just below 40% of the Percoll gradients. These above-mentioned fractions, including mock control and non-treated fractions, were loaded separately on the BN-SDS-gels and approximately 140 proteins spots were visualized via coomassie staining (Fig. 27-29). As expected, mitochondrial proteome gels from mock (control) and non-treated fractions were similar (Fig. 27: A-B). In these regards, one exemplary mitochondrial proteome gel image from lake water treated (mock), and the upper mitochondrial fraction (light mitochondria), the lower mitochondrial sub-fraction (heavy mitochondria), were compared with the Medicago gel map (www.gelmap.de/projects-medicago/). Subsequently, the respective position of protein complexes of the electron transport chain (OXPHOS system) from the mock control, the light and the heavy mitochondria proteome gels were drawn in Figure 30-32.
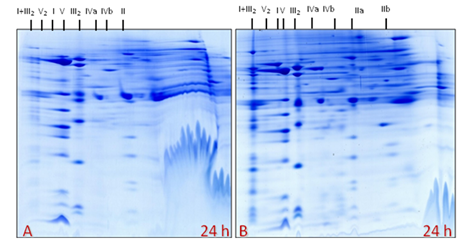
Figure 27: Mitochondrial proteome gels (A-B): ‘A’-from mitochondrial band (termed as ‘light mitochondria’) within the Percoll gradient at expected position (interphase of 23-40% Percoll) of Medicago cells treated with lake water (mock) at 24 h and ‘B’- prepared in similar condition but from non-treated Medicago cells at 24 h (representative gel out of three gels).
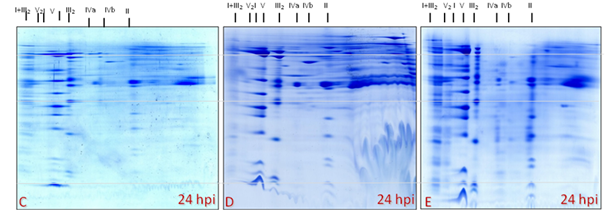
Figure 28: Mitochondrial proteome gels (C-D-E): from mitochondrial band (light mitochondria) within the Percoll gradient at expected position (interphase of 23-40% Percoll) of Medicago cells inoculated with A. euteiches at 24 hpi. Three independent mitochondria isolation accorded for each 2-D BN/SDS PAGE.

Figure 29: Mitochondrial proteome gels (F-G-H): from mitochondrial band (sub-fraction: heavy mitochondria) in the Percoll gradient at unexpected position (below 40% Percoll) of Medicago cells inoculated with A. euteiches at 24 hpi. Three independent mitochondria isolation accorded for each 2-D BN/SDS PAGE.
|
Figure 30: 2-D BN/SDS-PAGE image of M. truncatula mitochondrial proteome from mitochondrial band within the Percoll gradient at expected position (interphase of 23-40% Percoll) of Medicago cells treated with lake water (mock) at 24 h (representative gel out of three gels). Red box indicating position of super complex I+III2 and red arrow showing increased abundance of protein spots. |
Figure 31: 2-D BN/SDS-PAGE image of M. truncatula mitochondrial proteome from mitochondrial band within the percoll gradient at expected position (interphase of 23-40% Percoll) of Medicago cells inoculated with A. euteiches at 24 hpi. (representative gel out of three gels). Red box indicating position of super complex I+III2 and red arrow showing increased abundance of protein spots. |
Figure 32: 2-D BN/SDS-PAGE image of M. truncatula mitochondrial proteome from mitochondrial band (sub-fraction) in the percoll gradient at unexpected position (below 40% Percoll) of Medicago cells inoculated with A. euteiches at 24 hpi. (representative gel out of three gels). Red box indicating position of super complex I+III2 and red arrow showing increased abundance of protein spots. |
Position 1: Super complex I+III2 (1500 kDa) was found to be absent in gels of the mitochondrial sub-fraction (heavy mitochondria, below 40% Percoll gradients) at 24 hpi. It was found to be dissociated, resulting in the migration of their subunit members to the adjacent complex I (1000 kDa) and dimeric complex III2 (500 kDa). By contrast, it was moderately abundant in gels from the expected mitochondrial fraction (light mitochondria, 23-40% Percoll interphase) of inoculated cells and it was highly abundant in the gels of the mitochondrial fraction from the mock control (Figure 30-32).
 ax
ax
|
Figure 30: 2-D BN/SDS-PAGE image of M. truncatula mitochondrial proteome from mitochondrial band within the Percoll gradient at expected position (interphase of 23-40% Percoll) of Medicago cells treated with lake water (mock) at 24 h (representative gel out of three gels). Red box indicating position of complex II and red arrow showing increased abundance of protein spots. |
Figure 31: 2-D BN/SDS-PAGE image of M. truncatula mitochondrial proteome from mitochondrial band within the Percoll gradient at expected position (interphase of 23-40% Percoll) of Medicago cells inoculated with A. euteiches at 24 hpi (representative gel out of three gels).Red box indicating position of complex II and red arrow showing increased abundance of protein spots. |
Figure 32: 2-D BN/SDS-PAGE image of M. truncatula mitochondrial proteome from mitochondrial band (sub-fraction) in the Percoll gradient at unexpected position (below 40% Percoll) of Medicago cells inoculated with A. euteiches at 24 hpi (representative gel out of three gels). Red box indicating position of complex II and red arrow showing increased abundance of protein spots. |
Position 2: Complex II (Succinate dehydrogenase, 160 kDa) and its subunits were less abundant in gels from the mitochondrial sub-fraction (heavy mitochondria, below 40% Percoll) at 24 hpi. By contrast, it was mostly abundant in gels of the expected mitochondrial fraction (light mitochondria, 23-40% Percoll) of inoculated cells while highly abundant in gels of the expected mitochondrial fraction from the mock control. Interestingly, SDH subunits identified with the spot numbers 96, 97, 98, 99, 104, 105, 130, and 137 present in gels of expected mitochondrial fraction of the mock control and in gels of the expected mitochondrial fraction of the inoculated cells when compared with Medicago mitochondrial gel map (www.gelmap.de/projects-medicago/) (Figure 30-32).

|
Figure 30: 2-D BN/SDS-PAGE image of M. truncatula mitochondrial proteome from mitochondrial band within the percoll gradient at expected position (interphase of 23-40% Percoll) of Medicago cells treated with lake water (mock) at 24 h (representative gel out of three gels). Red box indicating position of complex III2 and red arrow showing increased abundance of protein spots. |
Figure 31: 2-D BN/SDS-PAGE image of M. truncatula mitochondrial proteome from mitochondrial band within the percoll gradient at expected position (interphase of 23-40% Percoll) of Medicago cells inoculated with A. euteiches at 24 hpi. (representative gel out of three gels). Red box indicating position of complex III2 and red arrow showing increased abundance of protein spots. |
Figure 32: 2-D BN/SDS-PAGE image of M. truncatula mitochondrial proteome from mitochondrial band (sub-fraction) in the percoll gradient at unexpected position (below 40% Percoll) of Medicago cells inoculated with A. euteiches at 24 hpi (representative gel out of three gels). Red box indicating position of complex III2 and red arrow showing increased abundance of protein spots. |
Position 3: Dimeric complex III2 (cytochrome c reductase, 500 kDa) was of increased abundance in gels of the expected mitochondrial fraction (23-40% Percoll) from the inoculated cells and moderately abundant in gels from the expected mitochondrial fraction of mock control cells whereas less abundant in gels of the mitochondrial sub-fraction (below 40% Percoll) at 24 hpi. The BN-SDS gels of the expected mitochondrial fraction shows the following protein subunits as identified spot numbers 31, 59, 60, 65, 67, and 103 (Figure 30-32).
|
Figure 30: 2-D BN/SDS-PAGE image of M. truncatula mitochondrial proteome from mitochondrial band within the percoll gradient at expected position (interphase of 23-40% Percoll) of Medicago cells treated with lake water (mock) at 24 h (representative gel out of three gels). Red box indicating position of porin protein complexes and red arrow showing increased abundance of protein spots. |
Figure 31: 2-D BN/SDS-PAGE image of M. truncatula mitochondrial proteome from mitochondrial band within the percoll gradient at expected position (interphase of 23-40% Percoll) of Medicago cells inoculated with A. euteiches at 24 hpi (representative gel out of three gels). Red box indicating position of porin protein complexes and red arrow showing increased abundance of protein spots. |
Figure 32: 2-D BN/SDS-PAGE image of M. truncatula mitochondrial proteome from mitochondrial band (sub-fraction) in the percoll gradient at unexpected position (below 40% Percoll) of Medicago cells inoculated with A. euteiches at 24 hpi (representative gel out of three gels). Red box indicating position of porin protein complexes and red arrow showing increased abundance of protein spots. |
Position 4: Mitochondrial porin protein complexes (90-500 kDa) were of increased abundance in gels of the expected mitochondrial fraction (light mitochondria, 23-40% Percoll) from the inoculated cells and moderately abundant in gels of the expected mitochondrial fraction of the mock control but less abundant in the gels of the mitochondrial sub-fraction (below 40% Percoll) of inoculated cells at 24 hpi. The gels of the expected mitochondrial fraction of the inoculate cells and the mock control showed the porin protein complex subunits identified as spot number 101 and 102. By contrast, gels from the mitochondrial sub-fraction of inoculated cells showed spot number 83 and 101 (Figure 30-32).
|
Figure 30: 2-D BN/SDS-PAGE image of M. truncatula mitochondrial proteome from mitochondrial band within the Percoll gradient at expected position (interphase of 23-40% Percoll) of Medicago cells treated with lake water (mock) at 24 h (representative gel out of three gels). Red box indicating position of complex II and red arrow showing increased abundance of protein spots. |
Figure 31: 2-D BN/SDS-PAGE image of M. truncatula mitochondrial proteome from mitochondrial band within the Percoll gradient at expected position (interphase of 23-40% Percoll) of Medicago cells inoculated with A. euteiches at 24 hpi (representative gel out of three gels).Red box indicating position of complex II and red arrow showing increased abundance of protein spots. |
Figure 32: 2-D BN/SDS-PAGE image of M. truncatula mitochondrial proteome from mitochondrial band (sub-fraction) in the Percoll gradient at unexpected position (below 40% Percoll) of Medicago cells inoculated with A. euteiches at 24 hpi (representative gel out of three gels). Red box indicating position of complex II and red arrow showing increased abundance of protein spots. |
Position 5: There was reduced number of complex IV (cytochrome c oxidase, 160-200 kDa) in gels of the mitochondrial sub-fraction (heavy mitochondria) at 24 hpi. By contrast, it was present in the gels of the expected mitochondrial fraction (light mitochondria) of the inoculated cells. For instance, in gels from the expected mitochondrial fraction of the inoculated cells showing the protein spot numbers 80, 82, 83, 84, 87, 31 and 91 of complex IV (cytochrome c oxidase) (Figure 30-32).

|
Fig. 30 2D BN/SDS-PAGE image of M. truncatula mitochondrial proteome from mitochondrial band within the percoll gradient at expected position (interphase of 23-40% Percoll) of Medicago cells treated with lake water (mock) at 24 h (representative gel out of three gels). Yellow box showing increased abundance of cyt c 1-1 and cyt c 1-2 spots. |
Fig. 31 2DBN/SDS-PAGE image of M. truncatula mitochondrial proteome from mitochondrial band within the percoll gradient at expected position (interphase of 23-40% Percoll) of Medicago cells inoculated with A. euteiches at 24 hpi (representative gel out of three gels). Yellow box showing increased abundance of cyt c 1-1 and cyt c 1-2 spots. |
Fig. 32 2D BN/SDS-PAGE image of M. truncatula mitochondrial proteome from mitochondrial band (sub-fraction) in the percoll gradient at unexpected position (below 40% Percoll) of Medicago cells inoculated with A. euteiches at 24 hpi (representative gel out of three gels). Yellow box showing increased abundance of cyt c 1-1 and cyt c 1-2 spots. |
Position 6: Among nine proteins identified as cyt c 1-1 (spots- 9, 59, 60, 65, 66, 67 and 103) and cyt c 1-2 (50, 59, 65, 66, 84 and 89) (15 kDa) in the Medicago mitochondrial gel map (www.gelmap.de), only three remained present (50, 65 & 66) in the gels of the mitochondrial sub-fraction (heavy mitochondria) at 24 hpi. In addition, they were less abundant than in the gels from the expected mitochondrial fraction (light mitochondria, interphase of 23-40% Percoll) of inoculated cells and in the mock control. In the gels of the expected mitochondrial fraction at least 6 out of 9 cytochrome c 1 proteins were identified (Figure 30-32).
|
Fig. 30 2-D BN/SDS-PAGE image of M. truncatula mitochondrial proteome from mitochondrial band within the percoll gradient at expected position (interphase of 23-40% Percoll) of Medicago cells treated with lake water (mock) at 24 h (representative gel out of three gels). Red box indicating position of complex V and red arrow showing increased abundance of protein spots. |
Fig. 31 2-D BN/SDS-PAGE image of M. truncatula mitochondrial proteome from mitochondrial band within the percoll gradient at expected position (interphase of 23-40% Percoll) of Medicago cells inoculated with A. euteiches at 24 hpi (representative gel out of three gels). Red box indicating position of complex V and red arrow showing increased abundance of protein spots. |
Fig. 32 2-D BN/SDS-PAGE image of M. truncatula mitochondrial proteome from mitochondrial band (sub-fraction) in the percoll gradient at unexpected position (below 40% Percoll) of Medicago cells inoculated with A. euteiches at 24 hpi (representative gel out of three gels). Red box indicating position of complex V and red arrow showing increased abundance of protein spots. |
Position 7: There was an increased abundance of complex V (ATP synthase, 600 kDa) in gels of the expected mitochondrial fraction (light mitochondria, 23-40% Percoll) of the mock and the inoculated cells compared to the gels of the mitochondrial sub-fraction (heavy mitochondria, below 40% Percoll) at 24 hpi (Figure 30-32).
3.6. 2 D IEF/SDS PAGE of the mitochondrial proteome:
In this proteomic analysis, particularly hydrophilic mitochondrial (matrix) proteins were separated within a molecular mass range of 10 to 110 kDa and an IEP range of pI 3 to 11. Mitochondrial isolations of the Medicago cells treated either with zoospores or lake water (mock) were separated on preparative IEF gels. All gel replicates shown in Appendix II. The involvement of proteins in physiological pathways and their molecular mass (KDa) and their best matching tentative consensus (TC) sequence were mentioned in the table 2-9.

|
Figure 33: 2-D IEF/SDS-gel of M. truncatula mitochondrial proteome at 20 h time point of treatment with lake water (representative gel out of three gels). |
Figure 34: 2-D IEF/SDS-gel of M. truncatula mitochondrial proteome at 20 hpi with Aphanomyces euteiches zoospores showing 19 protein spots (representative gel out of three gels). |
The physiological categories of the identified proteins are (A) Oxidative phosphorylation (OXPHOS) system (B) Pyruvate decarboxylation and citric acid cycle (C) Amino acid degradation (D) Chaperones (E) DNA transcription, translation, DNA-binding proteins (F) Membrane transport (H)Other proteins (I) Proteins of unknown function.
Comparison of the mitochondrial proteomes isolated from cells treated with lake water and zoospores at 20 h revealed 19 protein spots of increased abundance in the zoospores treated fraction (Figure. 33-34).
Five out of nineteen proteins spots belonged to the oxidative phosphorylation (OXPHOS) system: complex I (two subunits, 29 & 207), complex II (two subunits, 140 & 233), and one putatively uncharacterized protein (216) (Fig. 40). There was an increasing abundance of five proteins (85, 134, 144, 175 & 232) which belonged to the pyruvate decarboxylation complex and citric acid cycle (Krebs cycle/Tricarbooxylic acid cycle). Three proteins involved in (48, 181 & 189) amino acid degradation and three chaperones (HSP 10, two iso-forms of mitochondrial prohibitin) were identified. All these identified proteins spots were compared with the Medicago mitochondrial proteome IEF/SDS reference map, labeled in gels, and listed in the Table 2 & 3 (Dubinin et al., 2011).
Table 2 Proteins of increased abundance in the Medicago truncatula mitochondrial proteome of lake water treated cells at 20 h revealed by IEF/SDS-PAGE
|
Spot no. |
TC annotation |
Name of gene product |
MW(kDa) |
|
B)Pyruvate decarboxylation and citric acid cycle |
|||
|
174 |
TC181501 |
Citrate synthase |
80.4 |
|
I)Proteins of unknown function |
|||
|
13 |
TC183187 |
Putative uncharacterized protein |
25.9 |
Table 3 Proteins of increased abundance in the Medicago truncatula mitochondrial proteome of zoospores treated cells at 20 hpi as revealed by IEF/SDS-PAGE
|
Spot no. |
TC annotation |
Name of gene product |
MW (kDa) |
|
A)Oxidative phosphorylation (OXPHOS) system |
|||
|
29 |
TC175695 |
NADH dehydrogenase (complex I), α-sub complex subunit 5 |
80.7 |
|
207 |
TC181921 |
NADH dehydrogenase (complex I), δ-carbonic anhydrase subunit |
33.6 |
|
233 |
CT033768_6.4 |
Succinate dehydrogenase (complex II) Flavoprotein subunit |
70.2 |
|
140 |
CT033768_6.4 (XP_002530482) |
Succinate dehydrogenase (complex II) Flavoprotein subunit |
70.2 |
|
216 |
TC177625 |
Putative uncharacterized protein |
29.3 |
|
B)Pyruvate decarboxylation and citric acid cycle |
|||
|
85 |
TC179299 |
Aconitrate hydratase 2 |
108.8 |
|
175 |
TC181501 |
Citrate synthase |
52.5 |
|
134 |
TC174809 |
Isocitrate dehydrogenase |
56.3 |
|
232 |
TC174809 |
Isocitrate dehydrogenase |
52.1 |
|
144 |
TC177422 |
Succinyl-CoA ligase β sub unit |
45.1 |
|
C)Amino acid degradation |
|||
|
189 |
TC191986 |
Cysteine synthase subunit |
41.1 |
|
181 |
TC181396 |
Glutamate dehydrogenase |
44.7 |
|
48 |
TC200439 |
Ketoacide-reducto isomersae |
108.2 |
|
D)Chaperones |
|||
|
47 |
TC190343 |
HSP10 |
10.6 |
|
67 |
TC184419 |
Mitochondrial prohibitin 1 |
30.6 |
|
204 |
TC184419 |
Mitochondrial prohibitin 1 |
20.8 |
|
E)DNA transcription, translation, DNA-binding proteins |
|||
|
173 |
TC181255 |
Elongation factor Tu |
50.5 |
|
176 |
TC181255 |
Elongation factor Tu |
50.5 |
|
H)Other proteins |
|||
|
16 |
TC175168 |
Putative plastid protein |
32.2 |
 ax
ax
|
Figure 35: 2-D IEF/SDS-gel of M. truncatula mitochondrial proteome at 24 h time point of treatment with lake water (representative gel out of three gels) |
Figure 36: 2-D IEF/SDS-gel of M. truncatula mitochondrial proteome at 24 hpi with Aphanomyces euteiches zoospores showing 22 protein spots (representative gel out of three gels). |
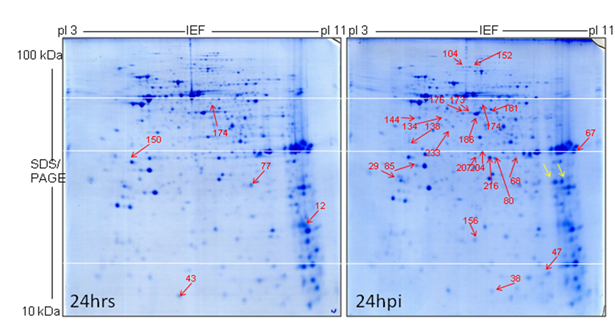
There was an increased abundance of 22 protein spots at 24 hpi in the mitochondrial proteome gel from inoculated fraction. Seven out of twenty-two protein spots were belonged to the oxidative phosphorylation (OXPHOS) system; complex I (four subunits-29, 104, 152 & 207), complex II (two subunits, 140 & 233), complex III (one subunit-38) and one putatively uncharacterized protein (216) (Fig. 36). There has been an increasing abundance of five protein subunits (80, 85, 134, 144 & 156) which were related to the pyruvate decarboxylation and citric acid cycle (Krebs cycle/Tricarbooxylic acid cycle). Two proteins involved in (181 & 186) amino acid degradation and three chaperones (HSP 10, two iso-forms of mitochondrial prohibitin) were identified. Two protein spots were only found in mitochondrial proteome gels of the inoculated cells. But not found in the mock mitochondrial proteome gels and even in the Medicago mitochondrial proteome IEF/SDS reference map. They were labeled with yellow arrow. All identified protein spots were labeled with red arrow in the gel images and listed in the Table 4 & 5.
Table 4 Proteins of increased abundance in the Medicago truncatula mitochondrial proteome of lake water treated cells (mock control) at 24 h revealed by IEF/SDS-PAGE
|
Spot no. |
TC annotation |
Name of gene product |
MW (kDa) |
|
A)Oxidative phosphorylation (OXPHOS) system |
|||
|
150 |
TC176177 |
ATP synthase (complex V) |
31.2 |
|
B)Pyruvate decarboxylation and citric acid cycle |
|||
|
174 |
TC181501 |
Citrate synthase |
80.4 |
|
43 |
TC147544 |
Fumarate hydratase |
59.3 |
|
77 |
TC174056 |
2-oxoglutarate dehydrogenase E2 subunit |
49.5 |
|
D)Chaperones |
|||
|
12 |
TC178533 |
Peptidyl-proly cis-trans isomerase |
18.8 |
Table 5 Proteins of increased abundance in the Medicago truncatula mitochondrial proteome of zoospores treated cells at 24 hpi as revealed by IEF/SDS-PAGE
|
Spot no. |
TC annotation |
Name of gene product |
MW (kDa) |
|
A)Oxidative phosphorylation (OXPHOS) system |
|||
|
29 |
TC175695 |
NADH dehydrogenase (complex I), α-sub complex subunit 5 |
80.7 |
|
104 |
CT009535_11.4 (AQ43644) |
NADH dehydrogenase (complex I) Fe-S protein 1 |
80.7 |
|
152 |
CT009535_11.4
|
NADH dehydrogenase (complex I) Fe-S protein 1 |
80,7 |
|
207 |
TC181921 |
NADH dehydrogenase (complex I), δ-carbonic anhydrase subunit |
33.6 |
|
140 |
CT033768_6.4 (XP_002530482) |
Succinate dehydrogenase (complex II) Flavoprotein subunit |
70.2 |
|
233 |
CT033768_6.4 |
Succinate dehydrogenase (complex II) Flavoprotein subunit |
70.2 |
|
38 |
AC202593_13.4 (NP_197927) |
Cytochrome c reductase (complex III) |
69.5 |
|
216 |
TC177625 |
Putative uncharacterized protein |
29.3 |
|
B)Pyruvate decarboxylation and citric acid cycle |
|||
|
80 |
TC179299 |
Aconitrate hydratase 2 |
108.8 |
|
85 |
TC179299 |
Aconitrate hydratase 2 |
108.8 |
|
134 |
TC174809 |
Isocitrate dehydrogenase |
56.3 |
|
144 |
TC177422 |
Succinyl-CoA ligase β sub unit |
45.1 |
|
156 |
TC177422 |
Succinyl-CoA ligase β sub unit |
45.1 |
|
C)Amino Acid degradation |
|||
|
186 |
TC191986 |
Cysteine synthase subunit |
41.1 |
|
181 |
TC181396 |
Glutamate dehydrogenase |
44.7 |
|
D)Chaperones |
|||
|
47 |
TC190343 |
HSP10 |
10.6 |
|
67 |
TC184419 |
Mitochondrial prohibitin 1 |
30.6 |
|
204 |
TC184419 |
Mitochondrial prohibitin 1 |
20.8 |
|
E)DNA transcription, translation, DNA-binding protein |
|||
|
173 |
TC181255 |
Elongation factor Tu |
50.5 |
|
176 |
TC181255 |
Elongation factor Tu |
50.5 |
|
H)Other proteins |
|||
|
68 |
TC191518 |
Adenylate kinase B |
26.7 |
|
138 |
TC183335 |
Thiosulfate sulfur transferase |
34.3 |
|
Figure 37: 2-D IEF/SDS-gel of M. truncatula mitochondrial proteome at 40 h time point of treatment with lake water (representative gel out of three gels). |
Figure 38: 2-D IEF/SDS-gel of M. truncatula mitochondrial proteome at 40 hpi with Aphanomyces euteiches zoospores showing 44 protein spots (representative gel out of three gels). |
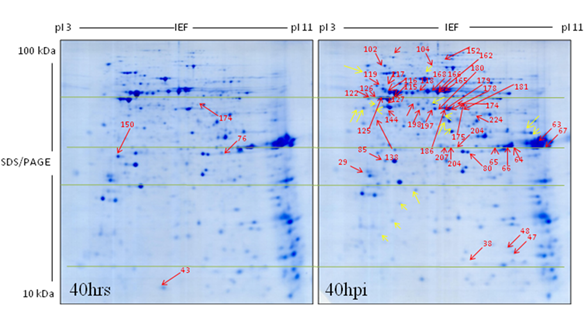
The number of mitochondrial protein spots exhibiting increased abundance in the inoculated cells dramatically increased to 44 at 40 hpi, in the mitochondrial proteome gels compared to the respective earlier two time points (20 hpi & 24 hpi) and from the control (mock) (Fig. 37-38). 19 out of the 44 proteins belong to the oxidative phosphorylation (OXPHOS) system: complex I (four subunits of NADH dehydrogenase-29, 104, 152 & 207), complex II (two subunits of succinate dehydrogenase, 140 and 233), complex III (eight subunits of cytochrome c-reductase-38, 125, 126, 127, 162, 165, 166, and 168), complex V (four subunits of ATP synthatase-115, 116, 117 and 119) and one putatively uncharacterized protein (216) (Fig. 38). Eleven proteins subunits were identified (80, 85, 118, 134, 144, 156, 175, 197, 198, 224 and 232) that belong to the pyruvate decarboxylation complex and the citric acid cycle (Krebs cycle/Tricarbooxylic acid cycle). Four proteins are involved in (181, 186 & 189) amino acid degradation and five represent chaperones (HSP 10, HSP90, HSP60 and two iso-forms of mitochondrial prohibitin) were identified. As expected, three subunits of membrane proteins (VDAC-porin) were also of increased abundance at 40 hpi. These identified protein spots were labeled by red arrows in the gel image (Fig. 38) and listed in the Table 6. Interestingly, sixteen protein spots were found in the mitochondrial proteome gels from the mitochondrial fraction of the inoculated cells but not observed in the mitochondrial proteome gels from the mitochondrial fraction of mock control and also not found in the mitochondrial proteome IEF/SDS reference map. They were labeled with yellow arrow (Fig. 38). Proteins that were up regulated in the control were arranged in Table 6. Initially, protein spots in the mitochondrial proteome gels from inoculated fractions (6 hpi to 24 hpi) exhibited similarities with IEF/SDS-PAGE reference map while mitochondrial proteome gels of the later time point (40 hpi) differed very much.
Table 6: Proteins of increased abundance in the Medicago truncatula mitochondrial proteome of lake water treated cells at 40 h revealed by IEF/SDS-PAGE
|
Spot no. |
TC annotation |
Name of gene product |
MW (kDa) |
|
A)Oxidative phosphorylation (OXPHOS) system |
|||
|
150 |
TC176177 |
ATP synthase (complex V) |
31.2 |
|
B)Pyruvate decarboxylation and citric acid cycle |
|||
|
174 |
TC181501 |
Citrate synthase |
80.4 |
|
43 |
TC147544 |
Fumarate hydratase |
59.3 |
|
H)Other proteins |
|||
|
76 |
TC191518 |
Adenylate kinase B |
26.7 |
Table 7: Proteins of increased abundance in the Medicago truncatula mitochondrial proteome of zoospores treated cells at 40 hpi as revealed by IEF/SDS-PAGE
|
Spot no. |
TC annotation |
Name of gene product |
MW (kDa) |
|
A)Oxidative phosphorylation (OXPHOS) system |
|||
|
29 |
TC175695 |
NADH dehydrogenase (complex I), α-sub complex subunit 5 |
80.7 |
|
104 |
CT009535_11.4 (AQ43644) |
NADH dehydrogenase (complex I) Fe-S protein 1 |
80.7 |
|
152 |
CT009535_11.4
|
NADH dehydrogenase (complex I) Fe-S protein 1 |
80.7 |
|
207 |
TC181921 |
NADH dehydrogenase (complex I), δ-carbonic anhydrase subunit |
36 |
|
140 |
CT033768_6.4 (XP_002530482) |
Succinate dehydrogenase (complex II) Flavoprotein subunit |
70.2 |
|
233 |
CT033768_6.4 |
Succinate dehydrogenase (complex II) Flavoprotein subunit |
70.2 |
|
125 |
TC194157 |
Cytochrome c reductase (complex III), mitochondrial processing peptidase α |
54.9 |
|
126 |
TC194157 |
Cytochrome c reductase (complex III), mitochondrial processing peptidase α |
14.4 |
|
127 |
TC194157 |
Cytochrome c reductase (complex III), mitochondrial processing peptidase α |
54.9 |
|
166 |
TC180307 |
Cytochrome c reductase (complex III), mitochondrial processing peptidase β |
59.6 |
|
165 |
TC180307 |
Cytochrome c reductase (complex III), mitochondrial processing peptidase β |
41.9 |
|
168 |
TC180307 |
Cytochrome c reductase (complex III), mitochondrial processing peptidase β |
|
|
162 |
TC180307 |
Cytochrome c reductase (complex III), mitochondrial processing peptidase β |
59.6 |
|
38 |
AC202593_13.4 (NP_197927) |
Cytochrome c reductase (complex III) |
69.5 |
|
116 |
TC180052 |
ATP synthase (complex V) β subunit |
60.8 |
|
115 |
TC180052 |
ATP synthase (complex V) β subunit |
60.8 |
|
117 |
TC180052 |
ATP synthase (complex V) β subunit |
60.8 |
|
119 |
TC197042 |
ATP synthase (complex V) β subunit |
60.8 |
|
|
|
|
|
|
B)Pyruvate decarboxylation and citric acid cycle |
|||
|
80 |
TC179299 |
Aconitrate hydratase 2 |
108.8 |
|
85 |
TC179299 |
Aconitrate hydratase 2 |
108.8 |
|
174 |
TC181501 |
Citrate synthase |
80.4 |
|
175 |
TC181501 |
Citrate synthase |
52.5 |
|
197 |
TC198607 |
Malate dehydrogenase |
38.3 |
|
198 |
TC198606 |
Malate dehydrogenase |
45.9 |
|
118 |
TC201171 |
Pyruvate dehydrogenase E2 dihydrolipoamide S-acetyl transferase |
59.3 |
|
224 |
TC196770 |
Pyruvate dehydrogenase E1 α subunit |
45.9 |
|
C)Amino acid degradation |
|||
|
186 |
TC191986 |
Cysteine synthase subunit |
41.1 |
|
181 |
TC181396 |
Glutamate dehydrogenase |
44.7 |
|
48 |
TC200439 |
Ketoacide-reducto isomersae |
108.2 |
|
D)Chaperones |
|||
|
47 |
TC190343 |
HSP10 |
10.6 |
|
102 |
CT571263_17.4 (XP_002531697) |
HSP90 |
91.0 |
|
122 |
TC191717 |
HSP60 |
19.4 |
|
67 |
TC184419 |
Mitochondrial prohibitin 1 |
30.6 |
|
204 |
TC184419 |
Mitochondrial prohibitin 1 |
20.8 |
|
E)DNA transcription, translation, DNA-binding protein |
|||
|
178 |
TC181255 |
Elongation factor Tu |
50.5 |
|
179 |
TC181255 |
Elongation factor Tu |
50.5 |
|
180 |
TC181255 |
Elongation factor Tu |
50.5 |
|
F)Membrane transport |
|||
|
63 |
TC182093 |
VDAC 1.1 (porin) |
59.6 |
|
64 |
TC179231 |
VDAC 1.3 (porin) |
29.6 |
|
65 |
TC179231 |
VDAC 1.2 (porin) |
36.1 |
|
G)Others proteins |
|||
|
66 |
TC191618 |
Adenylate kinase B |
26.7 |
|
138 |
TC183335 |
Thiosulfate sulfur transferase |
34.3 |
Among the increasingly abundant protein spots found at 40 hpi, in the mitochondrial proteome gels of inoculated fractions, 25 protein spots were exclusively increased abundance at 40hpi (Table 8). For instance; seven subunits of the protein complex III (cytochrome c reductase) were identified in the following spot numbers: 125, 126, 127, 166, 165, 168, and 162; Four subunits of the complex V (ATP synthase) in spot numbers: 115, 116, 117, and 119; Four subunits of the pyruvate decarboxylation complex and the citric acid cycle in spot numbers: 118, 197, 198 and 224; Three protein subunits of the porin family (membrane transport: VDAC) spot numbers 63, 64 and 65; Two proteins of the chaperones and two proteins of transcription, translation, DNA-binding.
Overall, 13 proteins were highly up regulated in the mitochondrial proteome gels of all the above mentioned three time points (at 20 hpi, 24 hpi, and 40 hpi). For example; three subunits of protein complex I (NADH dehydrogenase), two subunits of protein complex II (Succinate dehydrogenase), one subunit of protein complex III (cytochrome C reductase), two subunits of the pyruvate decarboxylation complex and the citric acid cycle, two subunits of the Amino acid degradation, and three proteins of the chaperone (Table 8).
A set of five increasingly abundant protein spots was observed in the mock mitochondrial proteome is particularly related to oxidative phosphorylation (OXPHOS), pyruvate decarboxylation complex and the citric acid cycle, and chaperones (Table 9).
Table 8: Proteins of increased abundance exclusively present in the Medicago truncatula mitochondrial proteome gels from inoculated fraction (cell cultures with Aphanomyces euteiches zoospores) at 20 hpi, 24 hpi, and 40 hpi via IEF-SDS-PAGE
|
Spot no. |
TC annotation |
Name of gene product |
MW (kDa) |
Time point of post inoculation (hpi) |
|
A)Oxidative phosphorylation (OXPHOS) system |
||||
|
29 |
TC175695 |
NADH dehydrogenase (complex I), α-sub complex subunit 5 |
80.7 |
20, 24, 40 |
|
104 |
CT009535_11.4 (AQ43644) |
NADH dehydrogenase (complex I) Fe-S protein 1 |
80.7 |
24, 40 |
|
152 |
CT009535_11.4
|
NADH dehydrogenase (complex I) Fe-S protein 1 |
80.7 |
20,24,40 |
|
207 |
TC181921 |
NADH dehydrogenase (complex I), δ-carbonic anhydrase subunit |
36 |
20,24,40 |
|
140 |
CT033768_6.4 (XP_002530482) |
Succinate dehydrogenase (complex II) Flavoprotein subunit |
70.2 |
20,24,40 |
|
233 |
CT033768_6.4 |
Succinate dehydrogenase (complex II) Flavoprotein subunit |
70.2 |
20,24,40 |
|
125 |
TC194157 |
Cytochrome c reductase (complex III), mitochondrial processing peptidase α |
54.9
|
40 |
|
126 |
TC194157 |
Cytochrome c reductase (complex III), mitochondrial processing peptidase α |
14.4 |
40 |
|
127 |
TC194157 |
Cytochrome c reductase (complex III), mitochondrial processing peptidase α |
54.9 |
40 |
|
166 |
TC180307 |
Cytochrome c reductase (complex III), mitochondrial processing peptidase β |
59.6 |
40 |
|
165 |
TC180307 |
Cytochrome c reductase (complex III), mitochondrial processing peptidase β |
41.9 |
40 |
|
168 |
TC180307 |
Cytochrome c reductase (complex III), mitochondrial processing peptidase β |
41.9 |
40 |
|
162 |
TC180307 |
Cytochrome c reductase (complex III), mitochondrial processing peptidase β |
59.6 |
40 |
|
38 |
AC202593_13.4 (NP_197927) |
Cytochrome c reductase (complex III) |
69.5 |
20,24,40 |
|
116 |
TC180052 |
ATP synthase (complex V) β subunit |
60.8 |
40 |
|
115 |
TC180052 |
ATP synthase (complex V) β subunit |
60.8 |
40 |
|
117 |
TC180052 |
ATP synthase (complex V) β subunit |
60.8 |
40 |
|
119 |
TC197042 |
ATP synthase (complex V) β subunit |
60.8 |
40 |
|
216 |
TC177625 |
Putative uncharacterized protein |
29.3 |
20, 24 |
|
B) Pyruvate decarboxylation and citric acid cycle |
||||
|
80 |
TC179299 |
Aconitrate hydratase 2 |
108.8 |
24,40 |
|
85 |
TC179299 |
Aconitrate hydratase 2 |
108.8 |
20, 24,40 |
|
175 |
TC181501 |
Citrate synthase |
52.5 |
20, 24,40 |
|
134 |
TC174809 |
Isocitrate dehydrogenase |
56.3 |
20, 24 |
|
232 |
TC174809 |
Isocitrate dehydrogenase |
52.1 |
20 |
|
197 |
TC198607 |
Malate dehydrogenase |
38.3 |
40 |
|
198 |
TC198606 |
Malate dehydrogenase |
45.9 |
40 |
|
118 |
TC201171 |
Pyruvate dehydrogenase E2 dihydrolipoamide S-acetyl transferase |
59.3 |
40 |
|
224 |
TC196770 |
Pyruvate dehydrogenase E1 α subunit |
45.9 |
40 |
|
144 |
TC177422 |
Succinyl-CoA ligase β subunit
|
45.1 |
20, 24 |
|
156 |
TC177422 |
Succinyl-CoA ligase β subunit |
45.1 |
24 |
|
C)Amino acid degradation |
||||
|
186 |
TC191986 |
Cysteine synthase subunit |
41.1 |
20, 24,40 |
|
189 |
TC191986 |
Cysteine synthase subunit |
41.1 |
20 |
|
181 |
TC181396 |
Glutamate dehydrogenase |
44.7 |
20, 24,40 |
|
48 |
TC200439 |
Ketoacide-reducto isomersae |
108.2 |
20, 40 |
|
D)Chaperones |
||||
|
47 |
TC190343 |
HSP10 |
10.6 |
20, 24,40 |
|
102 |
CT571263_17.4 (XP_002531697) |
HSP90 |
91.0 |
40 |
|
122 |
TC191717 |
HSP60 |
19.4 |
40 |
|
67 |
TC184419 |
Mitochondrial prohibitin 1 |
30.6 |
20, 24,40 |
|
204 |
TC184419 |
Mitochondrial prohibitin 1 |
20.8 |
20, 24,40 |
|
E)DNA transcription, translation, DNA-binding protein |
||||
|
178 |
TC181255 |
Elongation factor Tu |
50.5 |
40 |
|
179 |
TC181255 |
Elongation factor Tu |
50.5 |
40 |
|
180 |
TC181255 |
Elongation factor Tu |
50.5 |
40 |
|
173 |
TC181255 |
Elongation factor Tu |
50.5 |
20, 24 |
|
176 |
TC181255 |
Elongation factor Tu |
50.5 |
20, 24 |
|
F)Membrane transport |
||||
|
63 |
TC182093 |
VDAC 1.1 (porin) |
59.6 |
40 |
|
64 |
TC179231 |
VDAC 1.3 (porin) |
29.6 |
40 |
|
65 |
TC179231 |
VDAC 1.2 (porin) |
36.1 |
40 |
|
H)Others proteins |
||||
|
66 |
TC191618 |
Adenylate kinase B |
26.7 |
40 |
|
68 |
TC191518 |
Adenylate kinase B |
26.7 |
24 |
|
138 |
TC183335 |
Thiosulfate sulfur transferase |
34.3 |
24,40 |
Table 9. Proteins of increased abundance exclusively present in the Medicago truncatula mitochondrial proteome gels at 20 h, 24 h, and 40 h mock treatment (control) via IEF-SDS-PAGE
|
Spot no. |
TC annotation |
Name of gene product |
MW (kDa) |
Time point (h) |
|
A) Oxidative phosphorylation (OXPHOS) system |
||||
|
150 |
TC176177 |
ATP synthase (complex V) |
31.2 |
24, 40 |
|
B)Pyruvate decarboxylation and citric acid cycle |
||||
|
43 |
TC147544 |
Fumarate hydratase |
59.3 |
24,40 |
|
D)Chaperones |
||||
|
12 |
TC178533 |
Peptidyl-proly cis-trans isomerase |
18.8 |
24 |
|
H)Other proteins |
||||
|
76 |
TC191518 |
Adenylate kinase B |
26.7 |
40 |
|
I)Proteins of unknown function |
||||
|
13 |
TC183187 |
Putative uncharacterized protein |
25.9 |
20 |
3.7. Shotgun proteomics:
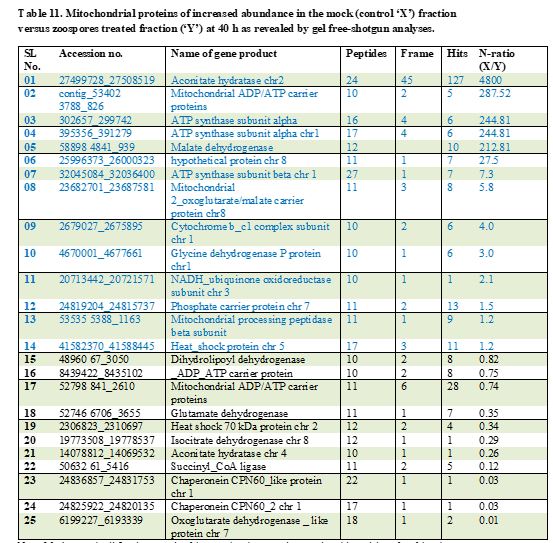
In gel free analyses, twenty-one proteins were of altered abundance at 24 h, among them 8 proteins were more abundant in the mitochondria fraction of mock treated cells while 13 proteins were more abundant in the inoculated fraction. Proteins upregulated in the inoculated cell lines comprise: two chaperones, three heat shock proteins, two proteins involved in amino acid degradation, four proteins of the pyruvate decarboxylation complex and the citric acid cycle, and one protein of the oxidative phosphorylation (OXPHOS) and one outer plastidial membrane protein porin (Table 10).
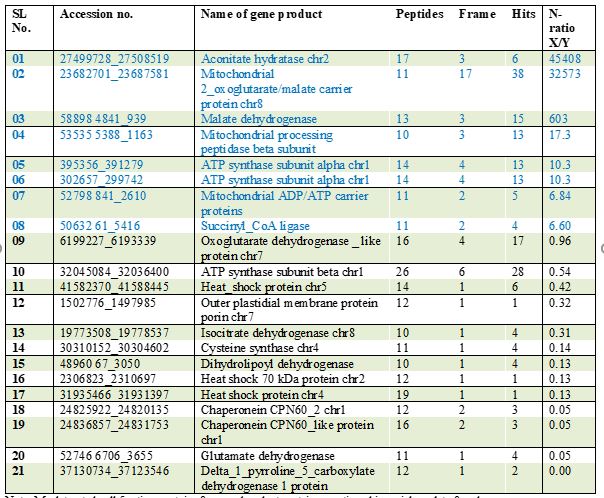
Twenty-five proteins showed abundance changes at 40 h, among them 14 proteins which were prevalent in the mock fraction listed in the Table 11. In contrast, 11 proteins were more abundant in the inoculated fraction. As expected, two chaperones, one heat shock protein, one protein involved in amino acid degradation, five proteins of pyruvate decarboxylation complex and the citric acid cycle, two ADP/ATP carrier proteins were noticed to be of increased order in the inoculated fraction (Table 11).
4. Discussion:
During the last two decades, M. truncatula became a well-developed model system to study legume biology at the molecular level (Colditz and Braun 2010). Conspicuously, as a member of legumes and thus elaborating symbiotic associations with nitrogen-fixing rhizobial bacteria and very specific interaction with pathogens, M. truncatula represents a superior model for studying plant-microbe interactions (Young et al., 2011). This study is aimed to illustrate cellular and molecular alterations of Medicago truncatula cell suspension cultures following inoculation with zoospores of Aphanomyces euteiches inducing an infection-like situation, and triggering defense mechanism in the plant cells. Of special interest are the mitochondrial processes, such as programmed cell death, in response to the pathogen treatment.
4.1. Cell suspension culture inoculation strategy
First and foremost, the most challenging part of establishing an in vitro inoculation or pathosystem for Medicago cell suspension cultures was to find the best compromise between resting and shaking of the cell suspension cultures to allow the zoospores to attach to the cells and to avoid oxidative stresses of the cell cultures as described by Trapphoff et al., 2009. By this way, pathogenic interactions between cultured cells and A. euteiches zoospores were developed. It is reported that in the sub-surface soil, under dark situation, zoospores interact with the plant roots (Gaulin et al., 2007). Likewise, zoospores also interact with cells during the resting stages of cell suspension in order to establish infection-like profiles as commonly known for plant-pathogenic root-infecting oomycetes. It has been noticed in microscopic studies that zoospores contact the cells. However, cultured cells may never be covering all biological aspects of a plant tissue and neither yield profound parasitic interactions like plants (Trapphoff et al., 2009).
4.2. Cell viability assay as initial determinant to cell death:
In the studies presented here, cells that were inoculated with A. euteiches infectious mobile zoospores revealed a clear reduction in cell viability over the following time points: at 2 h, 4 h, 6 h, 8 h, 10 h, 12 h, 14 h, 16 h, 18 h, 20 h, and 24 h as compared to cells from the mock control (Fig 3-24). A sharp drop in cell viability occurred after 14hpi, and discoloration of the cells were only noticed in the inoculated M. truncatula cells which indicates compatible interactions. In the earlier studies, any toxic effect was not found in the A. euteiches inoculated cell suspension cultures as described by Trapphoff et al., 2009. Hence, the M. truncatula cell suspension cultures imitated as a simplified system for monitoring and dissecting molecular dialogue in between cells and mobile zoospores.
4.3. ROS as important modulators of HR:
An oxidative burst assay was applied to measure the responsiveness of cell cultures following A. euteiches zoospores inoculation. Cell culture treated with A. euteiches zoospores at 0 h, 10 h, and 20 h showed a moderate oxidative burst reaction compared to the strong elicitor Yeast Invertase (Fig. 25). It is assumed that this moderately pronounced oxidative burst was initiated via the plasma membrane associated NADPH oxidase (known as RBOHs). Heat-treated A. euteiches zoospores, and double inoculation (at 0h & 10h, and at 0h & 20h) exhibited lower oxidative burst reactions in respect to their corresponding non-heated fractions. This demonstrates a heterogeneous composition of the zoospore elicitors containing heat-stable constituents: putatively cell wall oligomers of the oomycete as well as heat-sensitive molecules (e.g. proteins which are inactivated by the heat treatment). The latter is assumed to trigger a relatively low induction of H2O2. To date, other omycete elicitors have been well studied except Aphanomyces zoospore elicitors, for instance: hepta-β-glucoside and glycol-proteins of Phytophthora have been used in cultured plant cells for studying defense responses (Gaulin et al., 2007). Double inoculation (at 0 h & 10 h, and at 0 h & 20 h) and its successive lower oxidative burst reactions suggests a second oxidative burst induction which is characterized by decreased H2O2 synthesis, indicating a degree of cells potentiality to acclimatize to the applied stress. Since, the generation of elevated level of ROS and programmed cell death represent a cellular defense mechanism and the major functional element to HR by the oxidative burst reaction involved in primary pathogen defense (Teixeira et al., 2005). To this end, the observation of cell death phenomenon in the inoculated cell suspension cultures as well as oxidative burst reaction indicates a convincible analogy with the hypersensitive response (HR) that usually occurs in plant tissue to restrict the growth and spread of pathogens as mostly happens in plant programmed cell death.
4.4. Mitochondria and ROS:
In photo-synthetically inactive cells, the mitochondrial respiratory chain is assumed to be a major site of reactive oxygen species (ROS) production under biotic and abiotic stress conditions (Moller et al., 2001). Albeit, it is assumed in green plants that other cell organelles, chloroplasts, peroxisomes and nuclei also generates considerable amount of H2O2 during biotic stress (Gadjev et al., 2008). In animals, there is very profound evidence that mitochondria act as sensors of cell death signals and subsequently become initiators of cell death (Scott and Logan 2008). Against this backdrop, M. truncatula cell suspension cultures were inoculated with zoospores in lake water or with lake water only (as mock) treatment before the isolation of mitochondria at different time points (viz; 6 h, 10 h, 18 h, 20 h, 24 h, and 40 h of post treatments). In three-step Percoll gradients (18%-23%-40%) mitochondria formed a clear thick band between the 23%-40% Percoll interphase of the gradients in all the respective time points mentioned above (Dubinin et al., 2011). Interestingly, in the samples of A. euteiches inoculated cell suspension at 24 hpi an additional layer of mitochondria was found just below the established organelle band near the bottom of the centrifugation tube. It may be speculated that intact mitochondria are present in the 23%-40% interphase (termed as ‘light mitochondria’) while potentially disrupted mitochondria sub-fraction yielded just below 40% (termed as ‘heavy mitochondria’) of Percoll gradients. These mitochondria may be involved in ROS generation and resulted to the oxidative burst as part of the defense associated hypersensitive response (HR) ultimately driving in PCD.
4.5. Changes in the mitochondrial proteome as part of the plant defense response:
Light and heavy mitochondria prepared from cell cultures at 24 hpi, were analyzed via two dimensional (2D) blue native (BN)-SDS-PAGE. Pronounced alterations found in the abundance of protein complexes in the respiratory chain in the heavy mitochondria (below 40%) as compared to light mitochondria of the expected fraction (23%-40%) from the inoculated cell cultures. Those two mitochondrial proteome gels also compared with the proteome gels prepared from the non-treated and the mock treated cell cultures at 24 h. Heavy mitochondria (mitochondrial sub-fraction) proteome gels at first instance showed the following changes:
These changes in mitochondrial protein complexes in the heavy mitochondria may be due to the second respiratory burst localized in mitochondria of the cells under inoculation pressure. An increasing amount of superoxide anions and H202 generated at complexes I and III during zoospore interactions that may lead to severe oxidative stress and may be associated with the defense associated hypersensitive response (HR) resulting in PCD (Moller 2001; Gleason et al., 2010).
The respiratory complex II (Succinate dehydrogenase, 160 kDa) and its subunits were less abundant in 2-D BN/SDS gels of the heavy mitochondria (sub-fraction) at 24 hpi. By contrast, it was more abundant in the light mitochondria of the same treatment while being even more abundant in the light mitochondria of the mock control. These findings are supported by Dubinin et al., 2011, however the volume of complex II is generally higher in Medicago as compared to Arabidosis (Appendix II). The result of more abundant protein complex II in the light mitochondria indicates a higher energy level requirment during plant-microbe interactions. The citric acid cycle (or TCA cycle) activity is enhanced by high abundant of complex II (Gleason et al., 2010). Two subunits of succinate dehydrogenase (complex II) flavoprotein (spot number 140 & 230) were noticed highly abundance in IEF/SDS PAGEs at 20 hpi, 24 hpi, and 40 hpi (Fig. 39-44). These results indicate that complex II of the respiratory chain might have influence in plant stress and defense responses by inducing mitochondrial ROS as noticed by Gleason et al., 2010.
After 24 h, mitochondrial porin protein complexes (VDAC, 90-500 kDa) were observed more abundant in gels of the light mitochondria (23-40% Percoll interphase) and moderately abundant in gels of the mock control but clearly less abundant in the gels of the heavy mitochondria (below 40 % Percoll interphase) at 24 hpi. Data from mammalian mitochondria clearly show that VDAC involved in apoptosis (Shoshan-Barmatz et al., 2008). The porins complexes (VDAC channels: membrane transport chain) assist the crosstalk between cytosol and mitochondria by the opening of a channel known as the permeability transition pore (PTP, formed at the IMM–OMM contact site) (Kusano et al., 2009). It influences the release of inter membrane space proteins such as cytochrome c into the cytosol and switches on a range of others cellular proteases, which enhance cell death (Scott and Logan 2008). Until now, VDAC has been reported in rice, Nicotiana tabacum, Arabidopsis thaliana, Lotus japonicas, and Medicago truncatula to be upregulated by biotic and abiotic stress stimuli such as hypersensitive response as described by Wandrey et al., 2004. Hence, the increasing abundance of porins complexes in Medicago truncatula mitochondrial proteome also indicates their involvement in plant defense response and resulting programmed cell death. In addition, the chaperonee complexes (HSP10, HSP90, HSP60, two members of Mitochondrial prohibitins were higher abundant in IEF/SDS gels of the inoculated mitochondrial fractions at 20 hpi, 24 hpi, and 40 hpi. In an earlier study, the mitochondrial fractions (without inoculation) of Medicago cells showed increased abundances of prohibitins in BN gels in contrast to Arabidopsis cells (Dubinin et al., 2011) (Appendix II). Likewise, BN gels of the mitochondrial fractions of inoculated cells contained more prohibitin complexes. It is speculated that prohibitin induction is regulated by ROS production and is increased during stress situation such as pathogen infection and elicitor signaling (Wang et al., 2010; Van Aken et al., 2010). It is hypothesized that mitochondrial chaperone networks influence legumes in establishing interactions with soil microbes and 11% of these proteins have been identified on 2-D BN/SDS gels by Dubinin et al., 2011.
In order to evaluate changes in mitochondrial matrix proteins (hydrophilic) from inoculated and mock treated cell cultures, 2-D/IEF-SDS gels of mitochondrial fractions of M. truncatula cells at 20 hpi, 24hpi, and 40 hpi were compared and proteins of differing abundance were identified using a reference map published previously (Dubinin et al., 2011). While most proteins did not change in abundance, profound dissimilarities in the proteomes were found. At 20 hpi and at 24 hpi, 19 and 22 mitochondrial protein spots, respectively were increased in abundance in the treated cell cultures and at 40 hpi this number rose to 44. Thirteen proteins were found to change consistently across all three time points. These include: three sub-units of protein complex I (NADH dehydrogenase), two sub-units of protein complex II (Succinate dehydrogenase), one sub-unit of protein complex III (cytochrome C reductase), two sub-units of the pyruvate decarboxylase and citric acid cycle, two sub-units of the amino acid degradation, and three chaperones. It is believed that the OXPHOS system operated in the mitochondria act as an initiator of metabolic process where electrons are transferred from donors to electron acceptors as like oxygen in the redox reaction. It releases energy that is involved in to yield ATP and also produces reactive oxygen species (ROS) an increasing amount upon pathogen infection via complex I, Complex II and complex III, for example under stress situation, superoxide and hydrogen peroxide leads to the generation of free radicals often causes damage to cellular organelle and cell death (Gleason et al., 2010). Besides, there has been an increasing abundance of two proteins which were confined to the pyruvate decarboxylation and citric acid cycle (Krebs cycle/Tricarbooxylic acid cycle). The TCA cycle generates NADH (reduces NAD+) that is fed into the oxidative phosphorylation to produce energy in the form ATP (Gerald et al., 2008). Three subunits of amino acid degradation and three chaperones (HSP 10, two mitochondrial prohibitins) were identified (Table 9). The biological role of the chaperones is the renaturation of damaged proteins and therefore protects the cells against biotic and abiotic stresses (Ellis 2006). In this experimental setup, the upregulation of these proteins can be understood as a response to the biotic stress of the cell suspension cultures following the treatment with A. euteiches zoospores.
Notably, 22 protein sub-units out of the 44 protein spots in IEF/SDS gels at 40 hpi were exclusively increased in abundance (Table 9). For instance; seven sub-units of the respiratory complex III (cytochrome C reductase), four sub-units of complex V (ATP synthase), four sub-units of the pyruvate decarboxylation and citric acid cycle, three proteins of the porin (VDAC) family, two chaperones and three proteins involved in transcription, translation, and DNA-binding. It can be speculated that the plasma membrane associated NADPH oxidases (RBOH) involved in the first oxidative burst reaction that may result in an increased production of ROS from the electron transport chain that this triggers downstream defense related responses resulting in plant programmed cell death. These results also possibly indicate that biotic stress induced by pathogenic zoospores, enhances the metabolic cellular energy requirements for the defense mechanisms of the cells, and thus chaperone networks activated to repair of damaged proteins (Moller 2001).
In addition to the 44 increasingly abundant protein spots at 40 hpi with known identities, a further 16 protein spots were found in the mitochondrial proteome gels from inoculated cell fraction which were not observed in the mitochondrial proteome of IEF/SDS reference map or even in the control and thus, the proteins forming these spots are unknown.
Shotgun proteomics and plant defense response:
In gel free analyses 13 and 11 proteins were increasingly abundance in the inoculated mitochondrial fraction at 24 h and at 40 h, respectively. As expected from the IEF/SDS-PAGE at both time points, chaperones, heat shock proteins, amino acid degradation proteins, and proteins of pyruvate decarboxylation and the citric acid cycle as well as subunits of oxidative phosphorylation (OXPHOS) complexes were noticed to increasing in the inoculated mitochondrial fraction compared to the mock fraction (Table 10). These results also indicate that cells in the zoospores inoculated samples were under biotic stress as compared to the mock control. As like the previous speculation that plasma membrane associated NADPH oxidases (RBOH) involved in the first oxidative burst reaction that may influence more production of ROS, and oxidative stress and resulting hypersensitive response. In addition, the induction of chaperone and the resulting repair of damaged proteins help in the recovery of the cells and protects against stress as a result of pronounced oxidative burst (Wehmeyer et al., 1996; Moller 2001).
5.Conclusion:
In this study we aimed to study the molecular alterations of Medicago mitochondria following inoculation by zoospores of A. euteiches and their role in programmed cell death. Against this backdrop, we were able to notice the following effects:
Our findings suggest that mitochondria might be responsible for the induction of ROS during oxidative burst as a defense mechanism to protect the cells from the zoospores that this causes cell death similar to programmed cell death.
Future studies could be carried out in the following aspects:
Acknowledgments:
We are very much thankful to Leibniz University Hannover, Germany and DAAD research grants for helping to conduct this research.
Conflict of Interest Statement: We declare no conflict of interest

Open Access By Aditum Open Access Journals id licensed under Creative Commons Attribution 4.0 International License. Based On a Work at aditum.org