Agricultural Research Pesticides and Biofertilizers
OPEN ACCESS | Volume 6 - Issue 1 - 2026
ISSN No: 2994-0109 | Journal DOI: 10.61148/2994-0109/ARPB


Jasna Mary Thomas 1, Anindita Bhattacharya 2, Sheetal Kamble 3, Swati Bhargava 4, Ashna Mehra 5, Manasi Menon 6, Akshey Bhargava 7*
1Masters in Urban Planning, School of Planning Delhi.
2Masters in Urban Planning, BIT Mesra, Ranchi, Jharkhand.
3Assistant Professor, Environmental Science, P P Savani University, Surat, Gujarat,India.
4master’s in architecture from Architectural Association, London and Proxemics Studio London.
5B. Tech Civil Engineering, VIT, Vellore, India.
6Bachelor of Architecture, Manipal Academy of higher education Manipal, India. *7Enironmental Adviser, Green Circle and Ex. Member Secretary, Rajasthan Pollution Control Board, Jaipur and Ex. Professor, CEPT University, Ahmadabad, India.
*Corresponding Author: Akshey Bhargava, Enironmental Adviser, Green Circle and Ex. Member Secretary, Rajasthan Pollution Control Board, Jaipur and Ex. Professor, CEPT University, Ahmadabad, India.
Received: June 22, 2021
Accepted: June 28, 2021
Published: July 05, 2021
Citation: Jasna Mary Thomas , Anindita Bhattacharya , Ashna Mehra , Manasi Menon and Akshey Bhargava. (2021) “Environmentally Sustainable Solid Waste Management Case Study of Gurgaon.”, Journal of Agricultural Research Pesticides and Biofertilizers, 2(1); DOI:http;//doi.org/06.2021/1.1029.
Copyright: © 2021 Akshey Bhargava. This is an open access article distributed under the Creative Commons Attribution License, which permits unrestricted use, distribution, and reproduction in any medium, provided the original work is properly cited.
Solid Waste Management is a major problem that world faces, where urbanization, industrialization and economic growth have resulted in increased municipal solid waste generation per person. Waste generation, its quantity & composition is essential for determining collection, processing & disposal options to be adopted and it is dependent on population, local economy, life styles, income levels etc.Due to the increasing population and prosperity, the generation rate of municipal solid waste (MSW) has increased significantly, resulting in serious problems on public health and the environment. Every single person in the world is affected by the municipal solid waste management (MSWM) issue. MSWM is reaching a critical level in almost all areas of the world and seeking the development of MSW strategies for a sustainable environment. It is observed that there are lack of appropriate skills, technological competencies and the lack of financial resources in India This paper basically has the objective to have sustainable solid waste management, so accordingly estimations are being made which projects the waste generation per capita per day in next 30 years in Gurgaon in the form of bio-degradable, non-biodegradable and recyclable wastes and how these wastes can be treated in the form of compost, bio-fuel, fuel pallets and generating power from the waste, then the economy value has been generated in order to see which method of treatment is more suitable for the sustainable solid waste management in the city. It provides an overview of solid waste management in Global, India and Gurgaon and how we can overcome the situation by proposing sustainable SWM in the state
1. Introduction:
[[1]]Solid waste management is defined as the discipline associated with control of generation, storage, collection, transport or transfer, processing and disposal of solid waste materials in a way that best addresses the range of public health, conservation, economic, aesthetic, engineering, and other environmental considerations. It is a crucial function of local governments around the world, and directly affects public health, the environment, and livelihoods. These wastes are generated due to human as well as animal activities. Waste can be categorized based on material, such as plastic, paper, glass, metal, and organic waste. Categorization may also be based on hazard potential, including radioactive, flammable, infectious, toxic, or non-toxic wastes. Categories may also pertain to the origin of the waste, whether industrial, domestic, commercial, institutional, or construction and demolition.
In older days MSW does not affect the nature so adversely because the population was less and land was more for dumping but now the population is increasing at a high rate and the open land and green cover is decreasing day by day leading to deterioration of environment rapidly.This led to an imbalance in the human-nature relationship, finally leading to environmental problems like soil, air, and water pollution and accumulation of municipal solid waste (MSW).
The primary goal of solid waste management is reducing and eliminating adverse impacts of waste materials on human health and the environment to support economic development and superior quality of life. Generation [[2]] of solid waste is natural phenomenon i.e. generated by living as well as non-living components. The amount of solid waste generation is directly proportion to population. Less population means fewer excreta while large population growth will enhance excreta in natural condition. People in order to fulfil their needs and requirements are deteriorating the environment since last five decades. Both biodegradable and non-biodegradable solid wastes are also associated with air pollution in atmosphere in form of inorganic particles and foul odour. Data of solid waste production from domestic and industrial sectors from different countries of the world is very alarming. The increasing volume and complexity of waste associated with the modern economy is posing a serious risk to ecosystems and human health. Poor waste management - ranging from non-existing collection systems to ineffective disposal -causes air pollution, water and soil contamination. Open and unsanitary landfills contribute to contamination of drinking water and can cause infection and transmit diseases. The dispersal of debris pollutes ecosystems and dangerous substances from electronic waste or industrial garbage puts a strain on the health of urban dwellers and the environment.
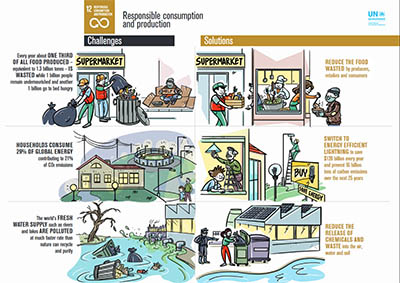
Figure 1: Sustainable Development Goals 12: Responsible Consumption and Production
Source: unep.org
Resource decoupling and impact decoupling are needed to promote sustainable consumption and production patterns and to make the transition towards a greener and more socially inclusive global economy.
To ensure sustainable consumption and production practices necessarily entails to respect the biophysical boundaries of the planet and to reduce current global consumption rates in order to fit with the biophysical capacity to produce ecosystem services and benefits. Sustainable growth and development require minimizing the natural resources and toxic materials used, and the waste and pollutants generated, throughout the entire production and consumption process.
1.1. Global Level Solid Waste Management:
Around the world, waste generation rates are rising. In 2016, the worlds’ cities generated 2.01 billion tonnes of solid waste, amounting to a footprint of 0.74 kilograms per person per day [[3]]. With rapid population growth and urbanization, annual waste generation is expected to increase by 70% from 2016 levels to 3.40 billion tonnes in 2050. Managing the waste in developing countries has become a challenge in order to provide a sustainable and liveable environment. Awareness must be spread among the people to discharge waste according to rules and regulations provided by authorities. Effective waste management is expensive, often comprising 20%–50% of municipal budgets. Operating this essential municipal service requires integrated systems that are efficient, sustainable, and socially supported.
In China, the Waste wise Scheme encourages the private sector to initiate waste reduction activities. A working group comprising representatives from various industries, schools, hospitals, government departments and the Environmental Protection Department (EPD) has been formed to assist members and encourage more companies to join the scheme. Plastic bags are the main waste concern of supermarkets and convenience stores. Some initiatives have been introduced to reduce this problem and the problem of waste in general from these outlets.Hospitals are being encouraged to promote waste reduction and recovery and to join the Waste wise Scheme. The EPD has provided technical advice and organized workshops and seminars for managerial and frontline staff in public and private hospitals.
In Germany, The Stadtreinigung Hamburg (SRH, Stadtreinigung means city cleaning) is responsible for the municipal solid waste management in the city. The SRH is a city-owned institution, working as a private company. The function of the SRH is to be a solution-provider for waste collection, city-cleaning and disposal. Generation of municipal solid waste annually in the city of Hamburg is 20,098.49 lakh tons. The approach adopted towards solid waste management for households and commercials is done separately.
[[4]] The East Asia and Pacific region are generating most of the world’s waste, at 23 percent, and the Middle East and North Africa region is producing the least in absolute terms, at 6 percent. However, the fastest growing regions are Sub-Saharan Africa, South Asia, and the Middle East and North Africa, where, by 2050, total waste generation is expected to more than triple, double, and double respectively. In these regions, more than half of waste is currently openly dumped, and the trajectories of waste growth will have vast implications for the environment, health, and prosperity, thus requiring urgent action.
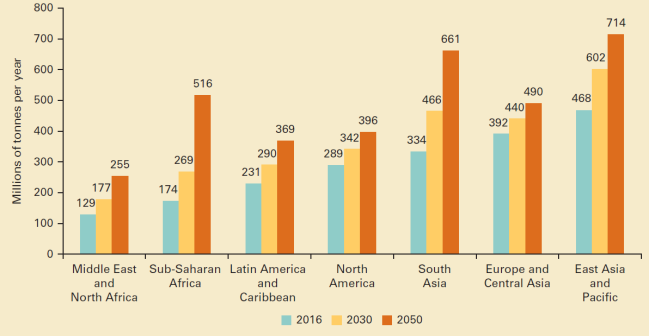
Figure 2: Projected waste generation, by region (millions of tonnes/year)
Source: datatopics.worldbank.org/what-waste/trends_in_solid_waste_management.html
Waste collection is a critical step in managing waste, yet rates vary largely by income levels, with upper-middle- and high-income countries providing nearly universal waste collection. Low-income countries collect about 48 percent of waste in cities, but this proportion drops drastically to 26 percent outside of urban areas. Globally, most waste is currently dumped or disposed of in some form of a landfill. Some 37 percent of waste is disposed of in some form of a landfill, 8 percent of which is disposed of in sanitary landfills with landfill gas collection systems. Open dumping accounts for about 31 percent of waste, 19 percent is recovered through recycling and composting, and 11 percent is incinerated for final disposal. Adequate waste disposal or treatment, such as controlled landfills or more stringently operated facilities, is almost exclusively the domain of high- and upper-middle-income countries.
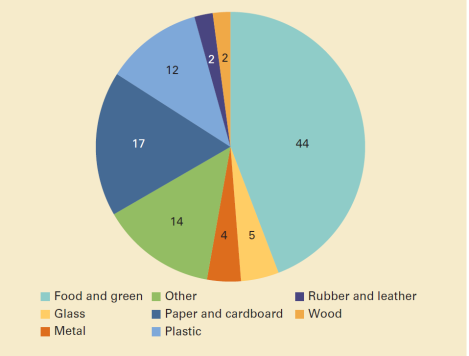
Figure 3: Global waste composition (percent)
Source: datatopics.worldbank.org/what-a-waste/trends_in_solid_waste_management
In most countries [[5]], solid waste management operations are typically a local responsibility, and nearly 70 percent of countries have established institutions with responsibility for policy development and regulatory oversight in the waste sector. Financing solid waste management systems is a significant challenge, even more so for on-going operational costs than for capital investments, and operational costs need to be taken into account upfront.Countries that advance from open dumping and other rudimentary waste management methods are more likely to succeed when they select locally appropriate solutions. Globally, most waste is currently dumped or disposed of in some form of a landfill. Some 37 percent of waste is disposed of in some form of a landfill, 8 percent of which is disposed of in sanitary landfills with landfill gas collection systems. Open dumping accounts for about 31 percent of waste, 19 percent is recovered through recycling and composting, and 11 percent is incinerated for final disposal.
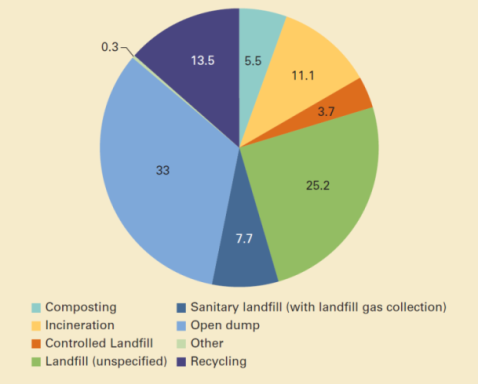
Figure 4: Global treatment and disposal of waste (percent)
1.1. India’s Level Solid Waste Management:
[[6]] The urban growth in India is faster than the average for the country and far higher for urban areas over rural. The proportion of population residing in urban areas has increased from 27.8 % in 2001 to 31.80 % in 2011 and likely to reach 50% by 2030. It is estimated that Urban India generates about 1.5 Lakhs Tonnes per day. The per capita waste generation in major cities ranges from 0.20 Kg to 0.6 Kg. Generally, the collection efficiency ranges between 70 to 90% in major metro cities whereas in several smaller cities the collection efficiency is below 50%. The composition of MSW at generation sources and collection points in India is observed to mainly consist of a large organic fraction (40–60%), ash and fine earth (30–40%), paper (3–6%) and plastic, glass and metals (each less than 1%). It is also estimated that the Urban Local Bodies spend about Rs.500 to Rs.1500 per tonne on solid waste for collection, transportation, treatment and disposal. About 60-70% of this amount is spent on street sweeping of waste collection, 20 to 30% on transportation and less than 5% on final disposal of waste, which shows that hardly any attention is given to scientific and safe disposal of waste.
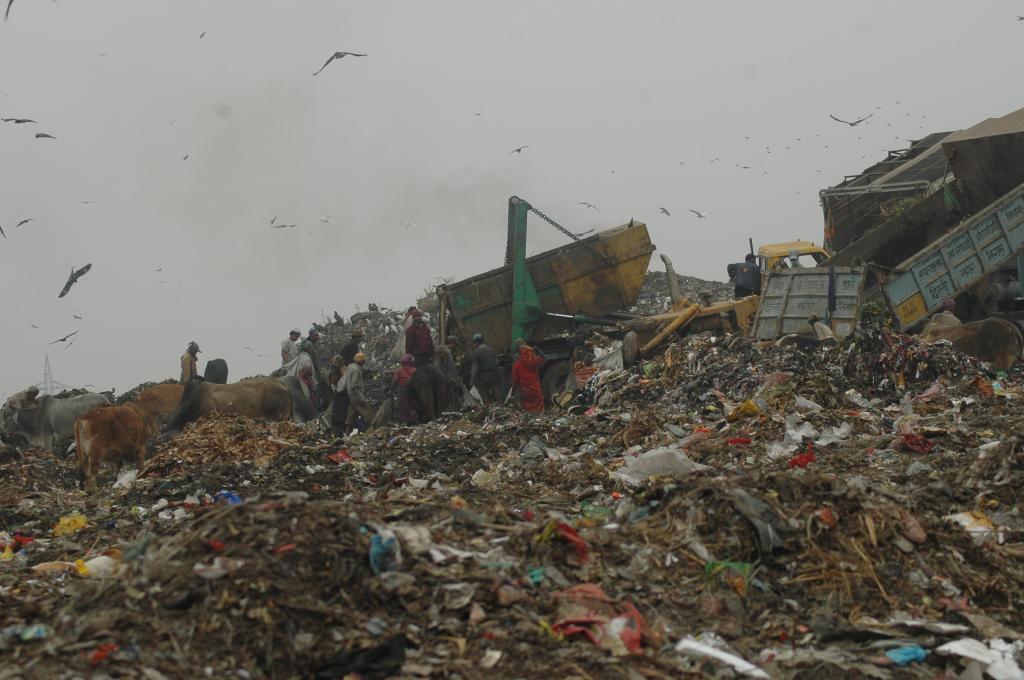
Figure 5: Waste Disposal in India
Source: downtoearth.org.in
Waste management rules in India are based on the principles of "sustainable development", "precaution" and "polluter pays" [[7]]. These principles mandate municipalities and commercial establishments to act in an environmentally accountable and responsible manner—restoring balance, if their actions disrupt it. The increase in waste generation as a by-product of economic development has led to various subordinate legislations for regulating the manner of disposal and dealing with generated waste are made under the umbrella law of Environment Protection Act, 1986 (EPA).India is turning into one big garbage dump. The problem is assuming gigantic proportions and the numbers are staggering. Urban India is the world’s 3rd largest garbage generator and by 2050 waste is expected to rise to 436 million tons up.
[[8]] Out of the total municipal waste collected, 94% is dumped on land and 5% is composted. Central Pollution Control Board in its report which was released in 2009 indicates that around 62 million tons of solid waste is produced in our country every year, of which less than 20% or only 12 million tons are treated. This essentially means that the remaining 52 million tons of waste remain ‘untreated’ and contaminate land or make its way into rivers, lakes and wetlands. Total quantity of solid waste generated in urban areas of the country is about 1.15 lakh tonnes per day. Out of these 19643 tonnes of waste is generated in metro cities per day.
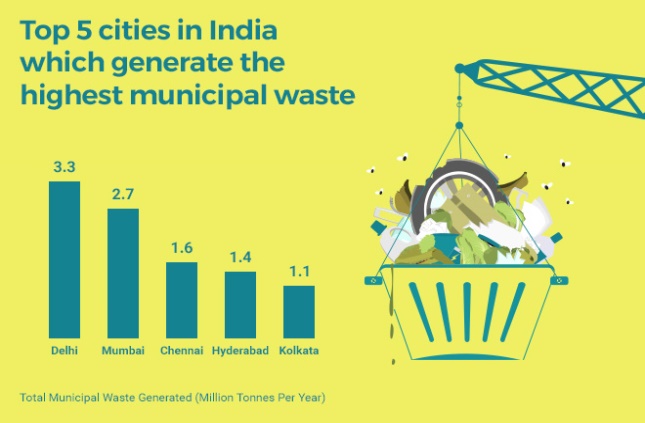
Figure 6: Total waste generated (Million Tonnes per year)
This essentially means that the remaining 52 million tons of waste remain ‘untreated’ and contaminate land or make its way into rivers, lakes and wetlands. Total quantity of solid waste generated in urban areas of the country is about 1.15 lakh tonnes per day. Out of these 19643 tonnes of waste is generated in metro cities per day. [[9]] The survey conducted by CPCB puts total municipal waste generation from Class I and Class II cities to around 18 million tonnes in 1997 (CPCB, 2000a). The solid waste generated in Indian cities has increased from 6 million tonnes in 1947 to 48 million tonnes in 1997 and is expected to increase to 300 million tonnes per annum by 2047 (CPCB, 2000a). More than 25% of the municipal solid waste is not collected at all, 70% of the Indian cities lack adequate capacity to transport it and there are no sanitary landfills to dispose of the waste. The existing landfills are neither well equipped nor well managed. Also, they are failed to protect against contamination of soil and groundwater.

Table 1: Waste Quantity (Tonnes per day) of Indian cities
Source: http://cpcb.nic.in
1.2. Gurgaon Solid Waste Management:
[[10]] Gurugram is a growing city which was formerly known as Gurgaon located in the Northern Indian state of Haryana. It is a second largest IT Hub and 8th largest city in India in terms of total wealth. Due to its rapid growth population is increasing adversely; even the migrants from other states are living here in order to have jobs. Gurugram city (Haryana state) has witnessed unprecedented urban growth over the past two decades, owing to the escalation in population, immigration and unorganized expansion. This brings with it the challenges associated with urbanization, among which are generation of large quantities of Municipal Solid Waste (MSW) and its disposal. Gurgaon city’s solid waste generation has doubled in the last ten years due to rising population. [[11]] Today Gurugram generates 650 metric tonnes (MT) per day of solid waste, according to non- governmental organization, Gurgaon First. A family of four generates a little more than 2kg of waste in a day. The city has so far followed a centralized approach to waste management. About over 90 per cent the waste in mixed form goes to the landfill at Bandhwari. Since treatment plant at Bandhwari has been dysfunctional, the waste pile has become a health and management hazard. Waste is collected and disposed of at Bandhwari by contractors who have service contracts with the authorities. Municipal Corporation Gurugram is the nodal body for waste management which has divided the city into four zones. It is manned by 3,648 sanitary workers, including permanent and contractual.
2.Literature Review:
The aim of the study is to minimize the solid waste generation and must be disposed properly without affecting the environment and maximizing the resource recovery and efficiency. The per capita waste generation in India varies from 200-500 per capita per day. Not only the waste is increasing but also various characteristics of wastes are also increasing. Solid waste must be segregated, collected, treated and disposed properly without affecting the environment [[12]]. Only about 75- 80% of the municipal waste gets collected and out of this only 22-28 % is processed and treated and remaining is disposed of indiscriminately at dump yards. The primary aim of sustainable solid waste management is to address concerns related to public health, environmental pollution, land use, resource management and socio-economic impacts associated with improper disposal of waste.
2.1. Salient Features of Solid Waste Management:
People must take initiative and dispose the waste properly without throwing, burning, burying the waste in open [[1]].
Door to Door collection of waste must be initiated.
The state government has banned the use of plastics; thus, it should not be used as it poses a major threat for environment due to its non-disposability.
There shall be complete prohibition on open burning of waste on lands including at landfill sites.
Convey the provisions of solid waste management under the byelaws to all the tourists visiting different areas in India i.e. by putting suitable hoarding at tourist places.
Non-recyclable wastes can be utilized as refuse-derived fuel in cement factories and power plants.
Waste generated can be used to generate the power.
20-30% of Plastic waste can be transferred to use to construct roads by mixing it with other materials.
There must be awareness program for the segregation of wastes and shall promote recycling and reuse of waste with the objective of “Zero Waste”
No dumping in nallahs and roadside should be allowed, or else the offenders should be fined.
Used sanitary waste like diapers, sanitary pads should be wrapped securely in pouches provided by manufacturers or brand owners of these products or in a suitable wrapping material and shall place the same in the bin meant for dry waste / non- bio-degradable waste [[2]].
The bio-degradable waste should be processed, treated and disposed of through composting or bio-methanation within the premises as far as possible. The residual waste shall be given to the waste collectors or agency as directed by the local authority.
Every street vendor should keep suitable containers for storage of waste generated during the course of his activity such as food waste, disposable plates, cups, cans, wrappers, coconut shells, leftover food, vegetables, fruits etc. and deposit such waste at waste storage depot or container or vehicle as notified by the local authority.
All such manufacturers, brand owners or marketing companies should educate the masses for wrapping and disposal of their products.
Non-recyclable [[3]] waste having calorific value of 1500 K/cal/kg or more shall not be disposed of on landfills and shall only be utilized for generating energy either or through refuse derived fuel or by giving away as feed stock for preparing refuse derived fuel.
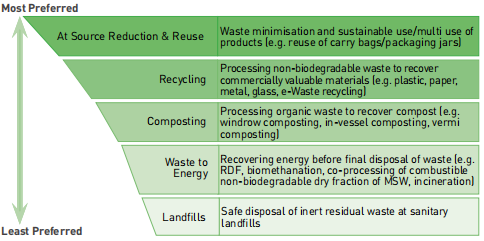
Figure 7: Integrated Solid Waste Management Hierarchy
Source: CPHEEO Part-1 SWM Manual
3.Case study of Gurgaon – The Millennium City:
Gurugram is one of the industrial and financial city of Haryana states, which is located in the National Capital Region (NCR), very near to New Delhi. Gurugram lies at latitude of 28° 27′ 34.1892″ N and longitude of 77° 1′ 35.8824″ E. Gurugram is located around 20 miles south-west of New Delhi, and its total population is around 1514,432 (Census, 2011), as per the census data city has witnessed rapid urbanization (total population 870,539, as per 2001 census report). According to the census report of 2011, Gurugram city is among the third highest per capita income cities of India and per capita income is most important parameter for calculating the Human Development Index (HDI). Gurgaon district has witnessed a phenomenal growth in all spheres of developments, particularly in industry and urbanization. With its rapid development, Gurgaon city has emerged as a jewel in the crown of Gurgaon district and has made the district proud due to its achievements. However, behind the shine and glitter lies an ailing population. Soaring levels of air pollution in the city have become a serious threat to human health. According to HSPCB’s annual report on solid waste management for the year 2018-19, which also states that of the total solid waste generated in Haryana (4,635.79 TPD), only 17.5% (815.93 TPD) is successfully treated and recycled, while about 78% (3,614.32 TPD) is sent to landfills.
Rapid urbanization along with increases in population has led to the deterioration of physical environment in Gurgaon. Effective Solid Waste Management is one of the major challenges faced by the local authorities. High volumes of waste generation, inefficient collection and transportation system and limited disposal options are continuously impacting the health, environment and quality of life in the area.
3.1. Population Projection:
Since last 20 years, Gurgaon growth has been rapidly increased. In the year [[5]] 2000, city has lots of barren lands green spaces (agricultural lands), waterbodies where water can easily seep but as the year passed city continued to grow depleting natural drainages lines and lakes. The current estimated population of Gurgaon, including the urban areas, the existing town, and the 17 villages surrounded by existing urban. Due to migration in the city in search of employments, the population is increasing at an annual growth rate of 5%. Using Arithmetic Projection method, population of Gurgaon is predicted for 2021, 2031, 2041, and 2051 (according to census 2011).As the population of the area starts growing on the backdrop of new projects, the physical and social infrastructure will further get a positive boost.
The population of Gurgaon is expected to increase drastically as shown in (Graph 4 Population Growth Projection 2021-2051) in next 5 years as it is becoming centre for employment, thus increase of waste generation at a high rate. In order to cater the population, more land is to be required to give shelter to these people and also fulfil their requirements.
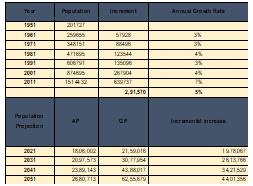
Table 2: Population Projection of Gurgaon (1951-2051)
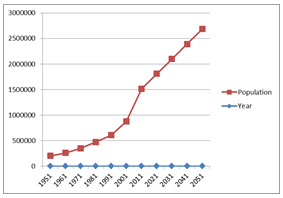
Figure 8: Population Growth Projection 2021-2051
3.2. Estimation of Solid Waste in Different Decades
Various issue of solid waste management quantity in various decades has been estimated in the study. Solid waste generated by domestic, commercial and industrial activities is often indiscriminately disposed. Unscientific management of such wastes leads to serious environmental problems. High risks of spreading diseases like typhoid, cholera, dysentery, yellow fever, plague etc.
In our study, we have estimated the generation of solid waste in Gurgaon. The volume of waste generation has been increasing rapidly over the last few decades. According to MOHUA (Ministry of Housing and Urban Affairs) the solid waste generated per capita per day is about 0.5-0.9 and 147,613 metric tonnes of solid waste are generated per day. Planning Commission estimate Urban India will generate 2, 76,342 tonnes per day of waste by 2021. Therefore, as per our study we have taken 0.9 as the mean value for the per capita per day generation of solid waste in Gurgaon and increasing at a rate of 1.3% per annum.
Then we have divided the Solid waste Generation into 3 i.e. Bio-degradable wastes, Non-biodegradable waste and Recycle waste constituting 52%, 32% and 17% respectively of total solid waste generated in Gurgaon in next 5 decades. Then we have (70%) of the solid waste generation.
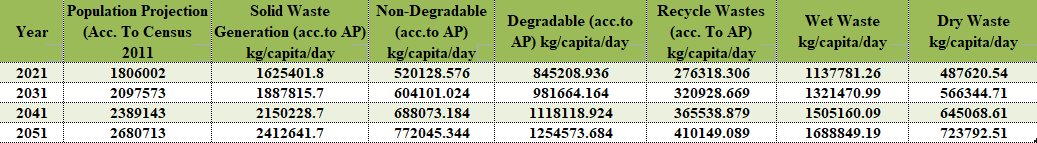
Table 3: Estimation of Solid Waste Management in Gurgaon
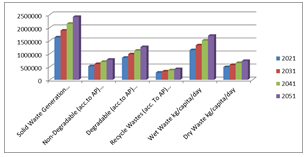
Figure 9: Waste Generation in Gurgaon in next 5 decades
3.3. Transformation of waste into Usable Products:
India's waste management crisis has serious implications for its environment, economy and public health. We focus on creating technologies and solutions that minimize waste generation and convert all waste into useful products. This includes initiatives to promote a circular economy through resource efficient and cleaner production in industries and maximize resource recovery and recycling for landfill-free cities.
Population explosion, coupled with improved lifestyle of people, results in increased generation of solid wastes in urban as well as rural areas of the city. The solid waste from rural areas is more of a biodegradable nature & the same from urban areas contains more non-biodegradable components like plastics & packaging. The repugnant attitude towards solid waste & its management is, however, common in both the sectors. Universally ‘making garbage out of sight’ is the commonly followed practice.
Management of solid waste which generally involves proper segregation and scientific recycling of all the components is in fact the ideal way of dealing with solid waste. Solid waste management (SWM) is a commonly used name and defined as the application of techniques to ensure an orderly execution of the various functions of collection, transport, processing, treatment and disposal of solid waste (Robinson, 1986).
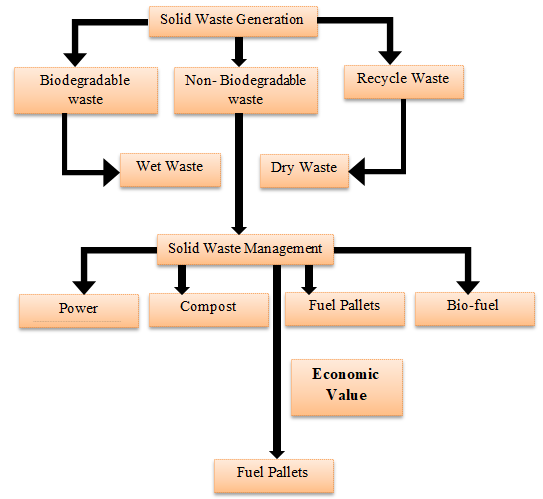
Table 4: Sustainable Solid Waste Management
In (Table 4 Sustainable Solid Waste Management), we have classified it into four management methods i.e. Power, Compost, Fuel Pallets and Bio-fuel respectively.
Therefore, from this study our aim is to propose a sustainable method of solid waste management i.e. “higher the economic value higher will be the sustainability”. We have calculated the economic value of all the methods that has been discussed and elaborated below:
Power generation:
2021: Solid Waste Generated (1625.40 Tonnes)
So, for every 100 tons it generates 1 MW Power
Therefore, for 1625.40 tons it will generate 16.25 MW Power
Cost:
1 MW Power cost = Rs. 4000
So, 16.25 MW Power Cost =Rs. 65,016
2031: Solid Waste Generated (1887.81 Tonnes)
So, for every 100 tons it generates 1 MW Power
Therefore, for 1887.81 tons it will generate 18.87 MW Power
Cost: with increase in 20% every decade
1 MW Power cost = Rs. 4800
So, 18.87 MW Power Cost =Rs. 90,614.88
2041: Solid Waste Generated (2150.22 Tonnes)
So, for every 100 tons it generates 1 MW Power
Therefore, for 2150.22 tons it will generate 21.50 MW Power
Cost: with increase in 20% every decade
1 MW Power cost = Rs. 5760
So, 21.50 MW Power Cost =Rs. 1, 23,852.67
2051: Solid Waste Generated (2412.64 Tonnes)
So, for every 100 tons it generates 1 MW Power
Therefore, for 2412.64 tons it will generate 24.12 MW Power
Cost: with increase in 20% every decade
1 MW Power cost = Rs. 6912
So, 24.12MW Power Cost =Rs. 1, 66,761.67
FUEL PELLETS
2021: Solid Waste Generated (1625.40 Tonnes)
40 Kg of waste = 15 Kg of Fuel Pellets
Therefore, 1625401.8Kg of waste =609525 g of Fuel Pellets.
Cost:
Per Kg Cost = Rs.35
Therefore, 609525 Kg of Fuel Pellets Cost =Rs. 21,333,375
2031: Solid Waste Generated (1887.81 Tonnes)
40 Kg of waste = 15 Kg of Fuel Pellets
Therefore, 1887815.7 Kg of waste =707928 Kg of Fuel Pellets.
Cost:
Per Kg Cost = Rs.45
Therefore, 707928 Kg of Fuel Pellets Cost =Rs. 31,856,793
2041: Solid Waste Generated (2150.22 Tonnes)
40 Kg of waste = 15 Kg of Fuel Pellets
Therefore, 2150228.7 Kg of waste =806332 Kg of Fuel Pellets.
Cost: -
Per Kg Cost = Rs.55
Therefore, 806332 Kg of Fuel Pellets Cost =Rs. 44,348,287
2051: Solid Waste Generated (2412.64 Tonnes)
40 Kg of waste = 15 Kg of Fuel Pellets
Therefore, 2412641.7 Kg of waste =904740 Kg of Fuel Pellets.
Cost:
Per Kg Cost = Rs.65
Therefore, 904740 Kg of Fuel Pellets Cost =Rs. 58,808,100
Compost Generation:
2021: Solid Waste Generated (1625.40 Tonnes)
1 Ton of waste = 83 Kg of Compost
Therefore, 1625.40 ton of waste =134.908 Kg of Compost.
Cost: with increase of 5% every decade
Per Kg Cost = Rs.10
Therefore, 134.908 Kg of Compost Cost =Rs. 13, 49,082
2031: Solid Waste Generated (1887.81 Tonnes)
1 Ton of waste = 83 Kg of Compost
Therefore, 1887.81 ton of waste =156.688 Kg of Compost.
Cost: with increase of 5% every decade
Per Kg Cost = Rs.15
Therefore, 156.688 Kg of Compost Cost =Rs. 23, 50,323
2041: Solid Waste Generated (2150.22 Tonnes)
1 Ton of waste = 83 Kg of Compost
Therefore, 2150.22 ton of waste =178.468 Kg of Compost.
Cost: with increase of 5% every decade
Per Kg Cost = Rs.20
Therefore, 178.468 Kg of Compost Cost =Rs. 35, 69,365
2051: Solid Waste Generated (2412.64 Tonnes)
1 Ton of waste = 83 Kg of Compost
Therefore, 2412.64 ton of waste =200.249 Kg of Compost.
Cost: with increase of 5% every decade
Per Kg Cost = Rs.25
Therefore, 200.249 Kg of Compost Cost =Rs. 50, 06,228
BIO-FUEL GENERATION
2021: Solid Waste Generated (1625.40 Tonnes)
1000 Tonnes of waste = 21.43 m³ of Compost
Therefore, 1625.40 tonnes of waste =34.832 m³ of Biofuel.
Cost: with increase of 20% every decade
Kg/m³ Cost = Rs. 45000
Therefore, 34.832 m³ =Rs. 15, 67,454
2031: Solid Waste Generated (1887.81 Tonnes)
1000 Tonnes of waste = 21.43 m³ of Compost
Therefore, 1887.81 tonnes of waste =40.45 m³ of Biofuel.
Cost: with increase of 20% every decade
Kg/m³ Cost = Rs. 54000
Therefore, 40.45 m³ =Rs. 21, 84,611
2041: Solid Waste Generated (2150.22 Tonnes)
1000 Tonnes of waste = 21.43 m³ of Compost
Therefore, 2150.22 tonnes of waste =46.079 m³ of Biofuel.
Cost: with increase of 20% every decade
Kg/m³ Cost = Rs. 64800
Therefore, 46.079 m³ =Rs. 29, 85,933
2051: Solid Waste Generated (2412.64 Tonnes)
1000 Tonnes of waste = 21.43 m³ of Compost
Therefore, 2412.64 tonnes of waste =51.702 m³ of Biofuel.
Cost: with increase of 20% every decade
Kg/m³ Cost = Rs. 45000
Therefore, 51.702 m³ =Rs. 40, 20,415
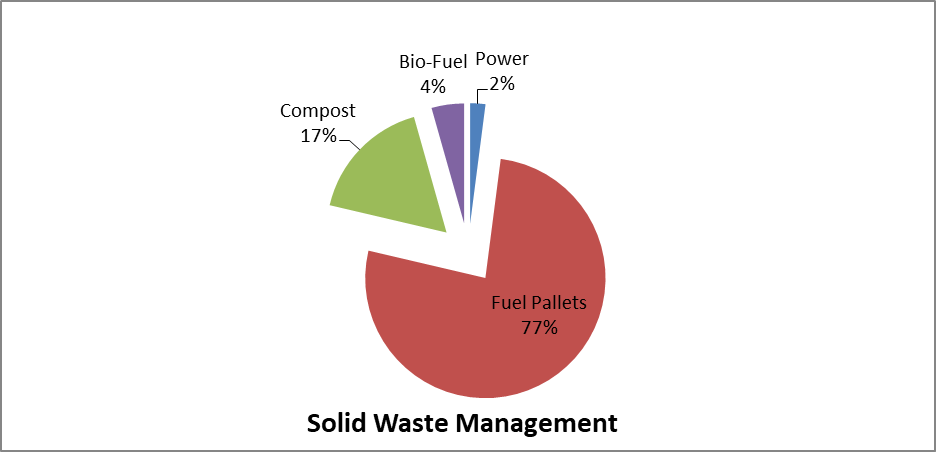
Figure 10: Sustainable Solid Waste Management
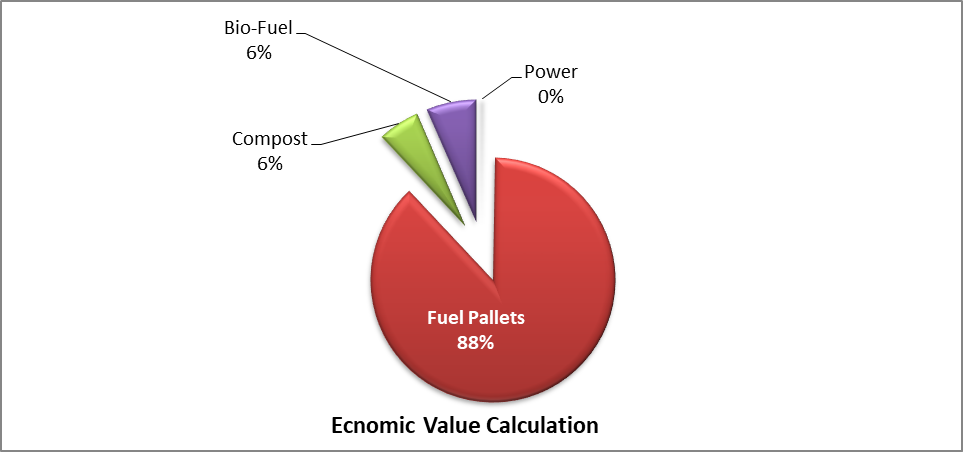
Figure 11: Economic Value Calculation
4.Conclusion:
The rapid urbanization process leads too many problems in which solid waste is one of the aspects which are changing the environment of Cyber City Gurgaon. The solid waste management is a low priority but can create social and environmental problem with risks to public health and environment.The existing solid waste management is constrained by institutional weakness, lack of proper funding, lack of proper management and operational systems, public apathy, lack of municipal will to become financially self-sufficient through municipal taxation and whole sole no administrative control on ultimate waste management stage i.e. disposal and processing system.Waste dumping is the only favourable method to urban local body without any further action. Day by day increasing trend practice of dump to dump yard won’t sustain the function. So, there is a requirement of taking integrated policy and technology to use less land as land is precious. Different part of India’s dump yard has started to reclaimed and process of SWM to reach zero waste city tag. Recycling, composting and ultimate power generation makes this city also zero waste city status.
To achieve financial sustainability, socio-economic and environmental goals in the field of waste management, there is a need to systematically analyze the strengths and weaknesses of the community as well as the municipal corporation, based on which an effective waste managementsystem can be evolved with the participation of various stakeholders in India. All these above saidsuggestions are given in relation to India and will be effective only when we individually feel the responsibility of making environment clean.So, as per the study “higher the economic value higher the sustainability” Therefore, Fuel pallets is one of the sustainable method that is showing high economic value, thus it is recommended to use Fuel Pellets as a sustainable solid waste management.

Open Access By Aditum Open Access Journals id licensed under Creative Commons Attribution 4.0 International License. Based On a Work at aditum.org