Agricultural Research Pesticides and Biofertilizers
OPEN ACCESS | Volume 6 - Issue 1 - 2026
ISSN No: 2994-0109 | Journal DOI: 10.61148/2994-0109/ARPB


Z.H.Aliyev* and S.X.Shukurov
Institute of Soil Science and Agrochemistry of NAS Azerbaijan-21.
*Corresponding Author: Z.H.Aliyev, Institute of Soil Science and Agrochemistry of NAS Azerbaijan-21.
Received: May 29, 2021
Accepted: June 07, 2021
Published: June 16, 2021
Citation: Z.H.Aliyev and S.X.Shukurov. (2021) “ Soil salinity research and mapping using Remote sensing GIS.”, Journal of Agricultural Research Pesticides and Biofertilizers, 1(5); DOI:http;//doi.org/05.2021/1.1021.
Copyright: © 2021 Z.H.Aliyev. This is an open access article distributed under the Creative Commons Attribution License, which permits unrestricted use, distribution, and reproduction in any medium, provided the original work is properly cited.
The research study evaluated the soil salinity by using special scientific tools like Remote Sensing and GIS technology, so that proper measurements could be taken for the sustainable agriculture and water management. A study to evaluate an irrigation system in the dry and semi-dry zone of straight Salyan, the study is made on the basis of salinity to evaluate the system. The primary data use for the study was the satellite images. This study employed an index-based approach of using Geographic Information System with field data. The satellite images of four different years was used to examine the effective area. Several combinations of the ratio of signals received in different spectral bands were used for development of this index. Near Infrared and Thermal IR spectral bands proved to be most effective as this combination helped easy detection of salt affected area. The results were confirmed by field research and laboratory analysis. The research will not only RS base for this field measurement also required for verification and correction. Several combinations of the ratio of signals received in different spectral bands were used for development of this index.
1. Introduction:
Soil salinity in irrigated soils in underground rocks accumulation of soluble salts in the root zone to adversely affect the growth of most crops [1]. This results in increasing impact on crop yields and agricultural production in both dry and irrigated areas due to poor land and water management and expansion of the agricultural frontier into marginal dry lands. Arid area crop jeld be achieved with irrigation and this reason expand the salinization hazard.
Guidelines for irrigation water quality generally focus on the physical, chemical, and microbiological factors that may affect crop growth or the soil environment. Trigger values or thresholds are provided for [2].
Furthermore, salinity also affects other major soil degradation phenomena such as soil dispersion, increased soil erosion, and engineering problems. When soil salinization Advances in Environmental and Agricultural Scienceis assessed in economic terms, reasons to be concerned about it become more apparent. To keep track of changes in salinity and anticipate further degradation, operational research is needed so that proper and timely decisions can be made to modify the management practices or undertake reclamation advances in the application of remote sensing technology in mapping and monitoring degraded lands, especially in salt-affected soils, have shown great promise of enhanced speed, accuracy and cost-effectiveness.
The approach to the problem of delineating saline soils using remote sensing data and GIS techniques has been proved in many recent studies to be most efficient [3].
2. Methods and techniques used:
2.1. Geographical location:
Salinity intrusion is a pressing issue in the coastal areas worldwide. It affects the natural environment and causes massive economic loss due to its impacts on the agricultural productivity and food safety. [5].
The study was conducted in the coastal areas of Salyan and Neftchala districts of the Republic of Azerbaijan. Development of agriculture in the coastal areas of the Caspian Sea, which is below the world sea level.
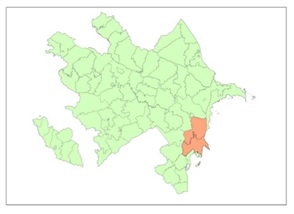
Figure 1: Geographic location of study area.
The territory is a dry and semi-arid, seaside main agricultural zone of Azerbaijan.
The soils of the arid and semi-arid regions are generally deficient in organic matter where saline and sodic soils are commonly found. The dispersed sodium in soil degrades the soil structure and restricts root growth and water movement in soil. [4].
2.2. Climate:
The climate of the area is temperate-hot semi-desert and dry-steppe type with dry summers. Semi-desert and saline, gray-meadow, carbonate alluvial-meadow and meadow soils are widespread. The Kura River flows into the Caspian Sea, forming a delta in this area. There is gray-meadow, carbonate alluvial-meadow and meadow wetlands. Salinity is found. Vegetation is desert and semi-desert.
Remotely sensed data is an efficient data source to produce variety of salt-affected soil maps in conjunction with field measurements. As such, soil analysis by utilizing modern technological tools of Remote Sensing (RS) and Geographical Information System (GIS) provides a valuable resource inventory related to the well-being of land especially those allocated for agricultural production [6].
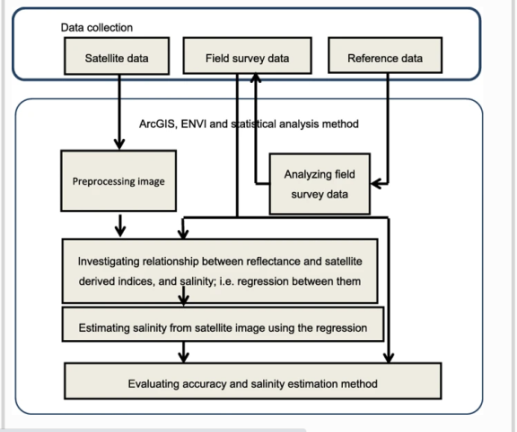
Figure 2: Methodical scheme of research work.
The main goal is to confirm the remote sensing information with the results of laboratory analysis.
These are the results of a joint study of Azercosmos LLC and the Institute of Soil Science and Agro chemistry of ANAS base on Azersky satellite images. The methodology used to research the salt affected soil area and soil pattern. In dry and irrigated areas, salts tend to concentrate on the soil surface. As salinity increases, more salts will appear at the soil surface, favoring the use of conventional remote sensing tools. To keep track of changes in salinity and anticipate further degradation, operative research method is needed so that proper and timely decisions can be made to modify the management practices or undertake reclamation and rehabilitation. The fields of Remote Sensing and Geographical Information Systems (GIS) are expanding very fast and the methods are constantly adapted to new fields of application.
Our work was carried out by means of space and ground soil surveys of the research area that were synchronous in time and location. For this purpose, by means of conducting ground reconnaissance survey of the area, were have chosen sub satellite areas with contrasting soil salinization, and satellite images have been ordered from Azersky 1A/1B in panchromatic mode with spatial resolution of 1.5 m on the site, and in multispectral mode (4-channel mode) with spatial time-resolution about 2.0 m on the site. In addition, Azersky satellite data for done aimed at exploring of soil salinization. In regard to satellite data processing methods and decoding of soil salinity state, we can outline the following main approaches:
Regression analysis of the correlation between magnitude of results of laboratory tests, and space images, was used for decoding satellite images. During the classification, a total of 24 bands were used, including 4 different time satellite images (4 * 4 = 16), each with 4 bands, and 4 NDVI and 4 SVSI indexes (4 + 4 = 8), each with 1 band. The following predictors were used for regression analysis: image was utilized to derive indices for soil salinity estimate including the single bands, Vegetation Soil Salinity Index (VSSI), Normalized Difference Vegetation Index (NDVI), and Normalized Difference Salinity Index (NDSI).
Two salinity indices based on the concept of spectral response to salt-affected soils were calculated. It is noted that spectral response in terms of digital number (DN) of salt-affected soils is relatively higher than other categories in band-1 (B1) and band-3 (B3). The following two salinity indices were used:
1) Salinity Index (S.I.). This index which gives relatively adequate results in the re-classification of salt-affected soils.
1). S.İ.= (Band1 x Band3)1/2
Normalized Differential Salinity Index (NDSI). The NDSI is basically the difference between the red and near infrared band combination divided by the sum of the red and near infrared band combination. The algorithm used was:
2) NDSI = ( Band3-Band4) ( Band3-Band4 )
Reflectance variations of vegetation on the image are attributed to the different species of vegetation and their densities, which together provide evidence of shallow ground water table conditions and saline agricultural areas.
Normalized Differential Vegetation Index (NDVI) which easily grasps the state of vegetation. NDVI was the most common form of vegetation indexand was basically the difference between the red and near infrared band combination divided by the sum of the red and near infrared band combination or:
3) NDVI = ( NİR-R) ( NİR+R)
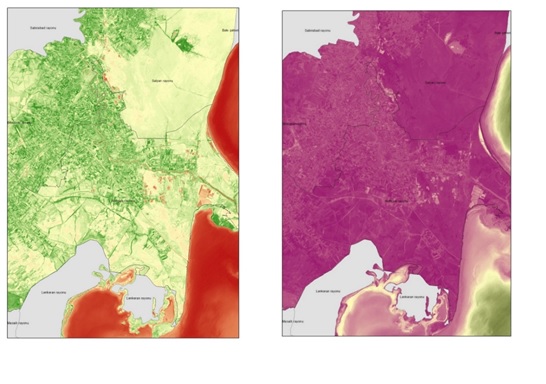
Figure 3: NDVİ Figure 4: SVSİ
Was executed isodata clustering algorithm to determine the characteristics of the natural groupings of cells in multidimensional attribute space. Maximum probability classification has been performed on a number of raster bands and creates a raster classified as output.
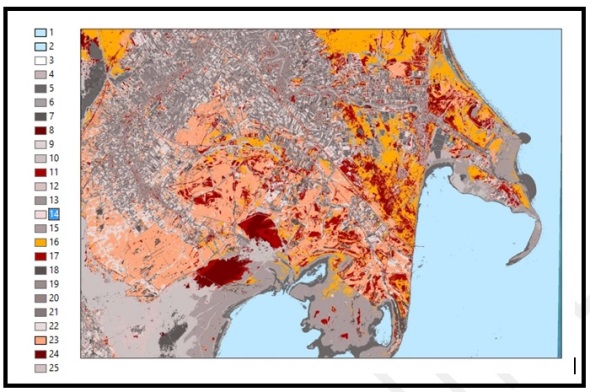
Figure 5: Outcome of Uncontrolled Classification (ISO cluster UC)
Statistical analysis between results of laboratory tests and the environmental indices derived from Azersky image was performed. Results indicated that spectral values of near-infrared (NIR) band and VSSI were better correlated with severe salinity and salinity indicators than the other indices. Comparative results show that soil salinity derived from Azersky was consistent with in situ data with coefficient of determination, R2 = 0.89 and RMSE = 1.06 dS/m for NIR band and R2 = 0.80 and RMSE = 1.50 dS/m for VSSI index. Findings of this study demonstrate that Azersky images reveal a high potential for spatiotemporally monitoring the magnitude of soil salinity at the topsoil layer.
3. Results and Discussion:
Our work began with the creation of the basic GIS layers within the Salyan and Neftchala rural districts (research objects), including borders of irrigated sites, settlements, roads, lakes, rivers, irrigation network, etc. All the layers that make up the GIS were obtained by decoding Azersky space imagery for 2018-2019, and also land use maps of local farmers. After conducting fieldwork, field observation points and results of satellite imagery of the research object were added into GIS. Then the image of NDSI indices was divided into three classes corresponding to non-saline, slightly saline, and medium-saline soils. Quintile counted on imagery for day 250 in 2018-2019 was used as class boundaries.
The main goal of our research was to investigate the potential of thermal imagery as a rapid, non-destructive landscape-level method for assessing the soil salinity of areas under crops. Our results confirm that remotely sensed canopy temperature at the landscape level is significantly related to soil salinity. Statistical analysis showed significant differences between salinity classes.
The assessments were confirmed by laboratory tests. IN the laboratory, the iCAP 7200 ICP-OES Duo device was used to measure the amount of Na +, K +, Mg+,Ca +cations. Soil layer analysis (0-20 cm, 20-50 cm, 50-100 cm) was analyzed at 250 points.

Figure 6: Assessments Laboratory analysis prices.
Controlled Classification (MLC) operation was performed for soil analysis. A salinity map has been compiled based on salinity prices and type.

Figure 7: Final map by salinity type and prices.
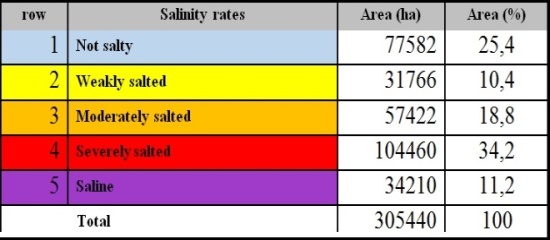
Figure 8: Distribution of lands in Salyan straight according to the degree of salinity
Conclusion:
Using regression analysis of linkage between spectral properties of Azersky space image and laboratory analysis of irrigated soils, it became possible to build, it became possible to build salinization regression models only for particular soil layers. Salinity maps were built on a semi-quantitative level using automated image classification on learning selection using and dividing soil imagery based on NDSI salinity index values. Strongly saline soils were identified most accurately, while soils with other salinity degrees were outlined with less precision.

Open Access By Aditum Open Access Journals id licensed under Creative Commons Attribution 4.0 International License. Based On a Work at aditum.org