Agricultural Research Pesticides and Biofertilizers
OPEN ACCESS | Volume 6 - Issue 1 - 2026
ISSN No: 2994-0109 | Journal DOI: 10.61148/2994-0109/ARPB


S.Kh. Shukurov
Doctor of Philosophy in Agrarian Sciences Institute of Soil Science and Agrochemistry of ANAS.
*Corresponding Author: S.Kh. Shukurov, Doctor of Philosophy in Agrarian Sciences Institute of Soil Science and Agrochemistry of ANAS.
Received: May 29, 2021
Accepted: June 07, 2021
Published: June 16, 2021
Citation: S.Kh. Shukurov. (2021) “ Innovative study of saline soils in Salyan and Neftchala districts.”, Journal of Agricultural Research Pesticides and Biofertilizers, 1(4); DOI:http;//doi.org/05.2021/1.1020.
Copyright: © 2021 S.Kh. Shukurov. This is an open access article distributed under the Creative Commons Attribution License, which permits unrestricted use, distribution, and reproduction in any medium, provided the original work is properly cited.
Modern problems of agrochemical science and new perspectives of application of modern technologies in the solution of these problems are shown. Samples of maps of lands in Salyan and Neftchala districts based on the latest level of development of cartography based on the application of GIS and space technologies were presented.
Introductıon:
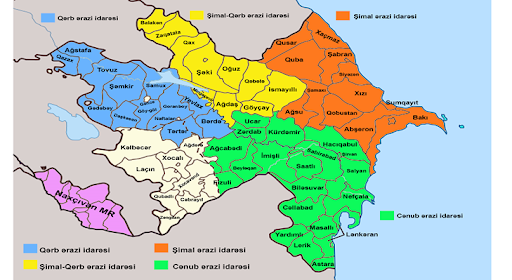
Figure 1
Since the second half of the twentieth century, the application of mineral fertilizers, pesticides and advanced irrigation systems in crop production around the world has been aimed at expanding the production of environmentally friendly products in the context of the intensification of the "Green Revolution", characterized by mechanization.Agrochemical research is carried out in order to study the fertility properties of soils, to determine the need for mineral organic fertilizers and chemical ameliorants, nutrients in the soil, toxic chemicals, heavy metal residues, radiation levels.The rules for conducting agrochemical research on lands shall be determined by the relevant legislation of the Republic of Azerbaijan. (8) The production of agricultural products in the country is mainly carried out in the Kur-Araz lowland, where groundwater with high mineral content is located close to the surface. Also, taking into account the natural and climatic conditions of the area, crop products are obtained through irrigation. The water-salt balance of the area is regulated by collector-drainage systems. Thus, achieving sustainable production requires proper regulation of the water-salt balance in the area.
Recently, remote sensing methods, including satellite imagery, have been used to study the salinity of soils over large areas. The application of modern satellite technologies in scientific research quickly detects changes in the area and provides GIS information.
The “State Program for the Development of Satellite Remote Sensing Services in the Republic of Azerbaijan for 2019-2022” approved by the Order of the President of the Republic of Azerbaijan No. 696 dated November 15, 2018 encourages the use of satellite imagery in various fields, including soil salinity is. In this regard, it is important to develop, test and substantiate a unified methodology for determining the degree of salinity of soils in Azerbaijan using satellite imagery for application in science and industry. Although there is international experience in this field, this methodology should be developed taking into account the specifics of agriculture in Azerbaijan.
Object and Methodology of Research:
The main purpose of the study is to substantiate the methodology of salinization using satellite imagery and to determine the distribution of salinity and the type of salinization of soils in the Salyan and Neftchala regions. The study area covers the territory of Salyan and Neftchala districts (305 440 ha), including Salyan (160260 ha) and Neftchala (145180 ha) districts, which are 22-25 m below sea level. The total area is connected to the Caspian Sea from the east. This area is one of the main agricultural regions of the country. Most of the existing irrigation and collector-drainage networks in the area are groundwater and open. The Salyan plain is characterized as a complex reclamation object. There are different types of soil in the area, groundwater is close to the surface. Therefore, some irrigated lands are subject to varying degrees of salinity.
After the transition to new forms of farming, no systematic soil surveys were conducted in the area due to lack of funding. Also, according to preliminary data, the fertility rates in the reserve lands included in the new crop rotation are low. Due to the lack of a scientific approach to land use in existing land use based on different types of ownership, crop productivity is much lower than the potential of the area.
The total sown area of agricultural crops in Neftchala region in 2018 is 67,767 hectares, and in Salyan region - 46,902 hectares. The sown area of cereals and legumes in the region increased from 42944 ha to 51333 ha during 2013-2018. These figures are accompanied by a decrease from 18,215 ha to 17,500 ha in the Salyan region.
Grain productivity in Neftchala region for 2013-2018 was 25.8 cents per hectare, 19.0 cents per hectare, 31.2 cents per hectare, 22.6 cents per hectare, 23.1 cents per hectare, 23 cents per hectare. , 6 sen / ha for Salyan region for the same period 32.3 sen / ha, 30.1 sen / ha, 33.1 sen / ha, 32.1 sen / ha, 34.3 sen / ha, 34, It was 1 sen / ha.
Neftçala district The area under cotton increased from 713 ha to 7,000 ha during 2013-2018. Productivity was 10.6 sen / ha, 13.8 sen / ha, 11.5 sen / ha, 12.8 sen / ha, 8.2 sen / ha, 14.4 sen / ha, respectively. The sown area of cotton in Salyan region increased from 666 ha (in 2013) to 7055 ha (in 2018). In that period, the productivity was 19.8 cents per hectare, 23.6 cents per hectare, 14.4 cents per hectare, 12.5 cents per hectare, 13.2 cents per hectare, 14.6 cents per hectare.
At the national level, the application of mineral fertilizers at the rate of 100% nutrient (g.m.) per hectare area was increased from 16 kg to 63 kg during the relevant years. Also, while the supply of mineral fertilizers to cotton was 30 kg per hectare in 2013, in 2018 it was increased to about 84 kg. At the same time, 20 kg of grain was harvested in 2013. In 2018, this figure reached about 86 kg. Analysis of statistical data shows that despite the increase in mineral fertilizers applied in the country, there has been no significant change in crop productivity over the years.
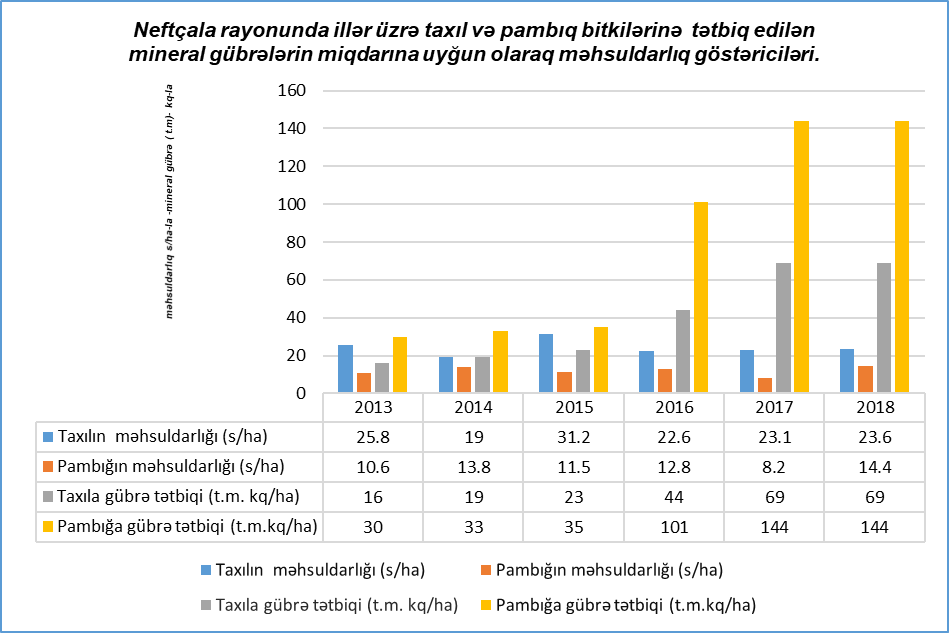
Figure 2: Productivity of cotton and grain crops against the background of applied mineral fertilizers

Figure 3: Sown area and productivity of cotton and grain crops

Figure 4: Productivity of cotton and grain crops against the background of applied mineral fertilizers
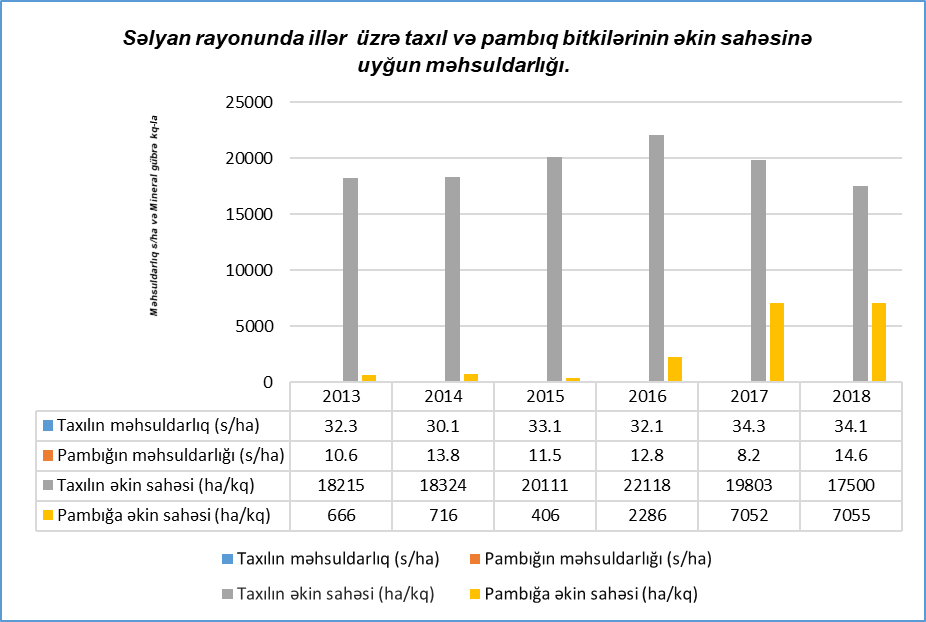
Figure 5: The research was carried out on the basis of satellite imagery and close-range methods according to the methodology developed in the scheme shown in Figure 6.
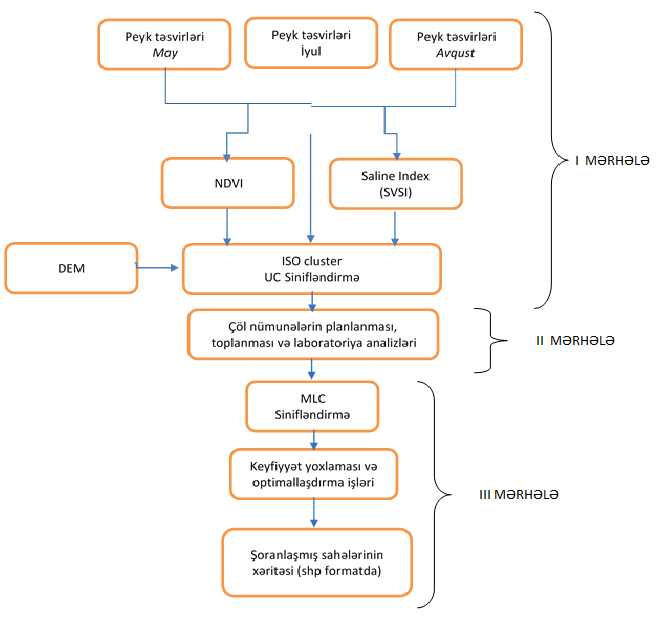
Figure 6: Methodology for determining salinity based on satellite imagery.
In Salyan and Neftchala regions, the spectral diversity of space images was determined by means of remote sensing. For this purpose, Azercosmos OJSC took multispectral (MS, 6m resolution) images of 4 periods in June-August, September-December 2018, January-April and May-July 2019 for 4 periods via Azersky satellite. Initially, NDVI (plant index) and SVSI (salinity index) were calculated for each of these images. The results obtained for 25 classes obtained by automated methods using the uncontrolled classification (UC) operation were initially studied.
At the next stage, the exact coordinates of 250 points to be cut at the points where soil sampling is necessary were determined. In the 3rd stage, soil samples were taken, numbered and packed with drilling tools at depths of 0-10, 10-30, 30-100 cm in sections by approaching the area determined on the basis of coordinates with the help of modern technological equipment (GPS, iPad).
Thus, as a result of spectral analysis of spatial images, soil samples were seen at 218 (0-30 cm, 30-60 cm, 60-100 cm) of the selected coordinate points on the areas corresponding to the identified color contours, the areas with the remaining 32 color contours were swamps, water bodies and Due to the fact that it covers impassable forests, the situation in the fields was visually defined.
Photographs were taken of the area where the land was taken, and visual information on the natural and economic condition of the area was collected. In the 4th stage, the analysis of complete water gravity and granulometric composition of soil samples was carried out in accordance with the methods adopted in traditional reclamation practice.
Thus, a general Table for complete water gravity analysis and salinity type has been compiled. According to the classification for determining the salinity of soils, according to the amount of salts (dry residue,%) in the sections, the soils were not saline (<0.25), weakly saline (025-0.5), moderately saline (0.5-1.0), severe ( 1,0—2,0) and very strongly saline (2,0-3,0) and saline (> 3,00), as well as the use of correction factors for chlorinated, sulfate, soda, chloride-sulfate, sulfate-soda types of salinity was evaluated by doing. The results of the analysis are summarized as follows. [10]
Table 1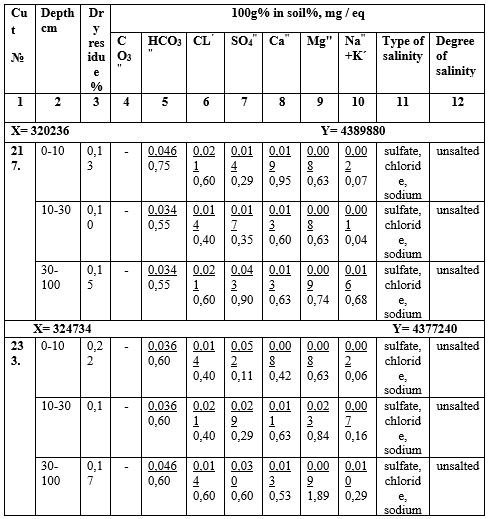
Table 1: Results of full water gravity analysis of gray-meadow soils in Salyan-Neftchala regions research area.
Dıscussıon of Results:
For the study, Azercosmos OJSC used Azersky satellite for 4 periods of June-August, September-December 2018, January-April and May-July 2019 for multi-spectral (MS, 6m resolution) images. 25 different classes were obtained by combining 4 satellite images, NDVI, SVSI indices with ISO cluster UC (uncontrolled classification). The Digital Elevation Model (DEM) of the area was used to mask the limestone (Figure 9) The results for 25 classes obtained by automated methods using the Uncontrolled Classification (UC) operation were initially examined (Figure 7).
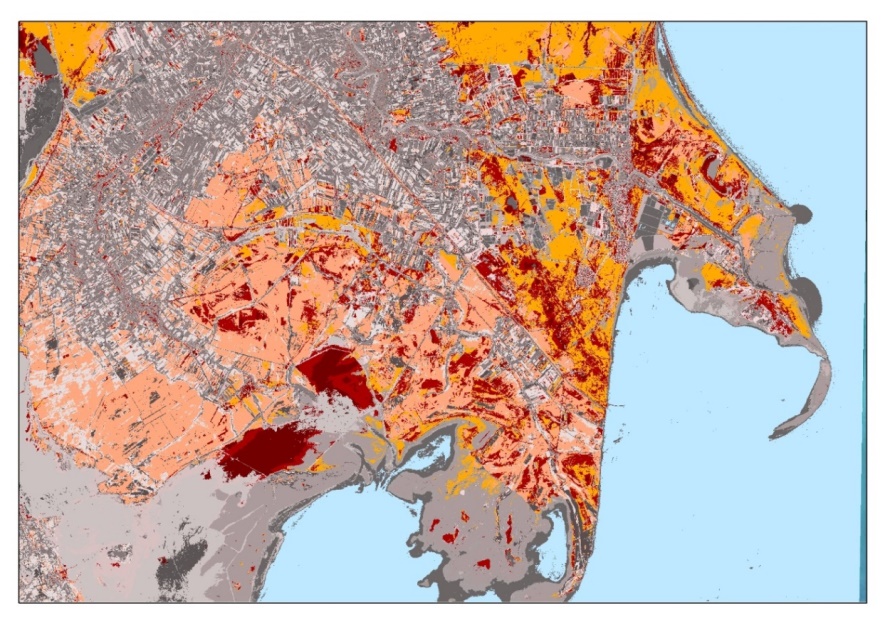
Figure 7: Outcome of Uncontrolled Classification (ISO cluster UC)
It was found that in some areas salinization is up to the point of salinity, and this indicates that the process of re-salinization is going on in the lands under cultivation. There is also a risk that the topsoil will be severely saline if irrigation conditions do not improve in these areas. The areas covered by the sections in the territory of Shirvan National Park are saline.
High salinity was found in the lower layers, while moderate salinization occurred in the upper layers of the sections surrounding such areas. If winter pastures continue to be used for planting without a systematic drainage network, severe salinization will gradually occur in the topsoil. In some uneven parts of these areas, there is a risk of salinization as a result of leaching of salts by irrigation water. The results of mechanical analysis of the soil show that these areas have a medium clayey and dusty mechanical composition. In winter pastures and arable lands
In areas with light clayey-clayey-dusty mechanical composition, rapid salinization is observed. Areas with sandy-clayey-clayey-dusty mechanical composition are formed mainly as a result of lake and sea withdrawal, and severe salinization is observed in the lower and upper layers of these areas. A controlled classification (MLC) operation was performed using field samples. The main goal at this stage was to adapt the results of the classification to the sample values collected on the basis of field samples and to apply them in nature throughout the area.
Using the results of laboratory analysis of the obtained field samples, the satellite imagery was processed together with the salinity and vegetation indices and a controlled classification operation was performed. The Digital Elevation Model of the Territory and the Landduse / Landcover (Land Cover) ) map was used. In order to check the quality of the results, Azersky PMS (with 1.5 m resolution) images were visually compared and quality control was performed. Thus, an accurate salinity map of the Salyan plain was compiled. The area was also distributed according to the type of salinity (Figure 8.9).
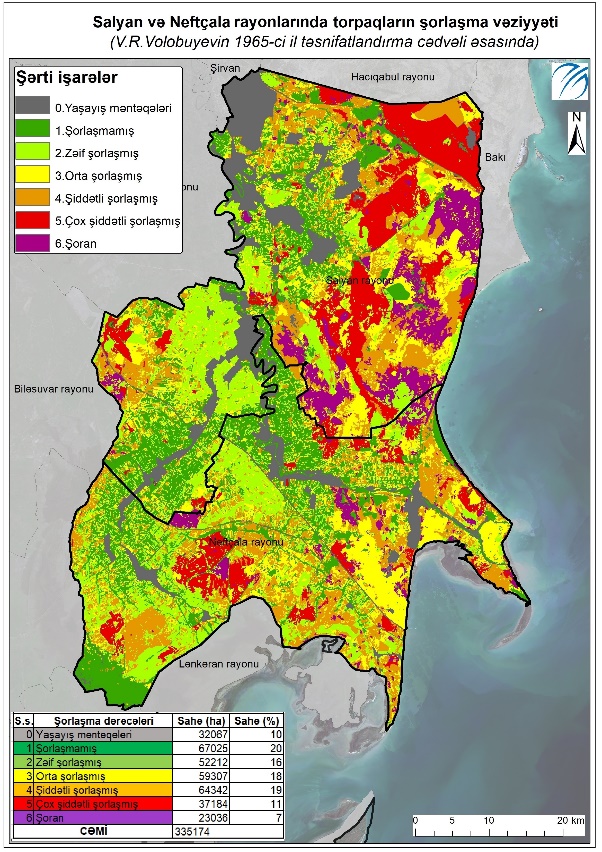

Figure 8: Soil salinity map Figure 9: Type of salinization of soils
Our time is rich in such technological innovations that the development of agrochemical science by old methods is becoming more and more difficult. The main difficulty is the strong flow of information. Thus, issues such as acceptance, systematization, research, storage, timely use, comparative analysis of the existing information flow have become the most pressing issues, and it is no longer possible to do all this in the traditional way. Perfect and accurate work that can meet high requirements can be accomplished by creating Digital Land Maps based on the Information System (IS). [5] The condition for soil fertility is not only the supply of nutrients to the soil. It is important to have favorable ecological conditions for the assimilation of these substances by plants. [7]
Under different soil climatic conditions and different agrocenoses, new ecological fertility models of soils are emerging and the flow of information is increasing. Therefore, the creation of a database of soil fertility models on the basis of modern electronic devices is both scientifically and practically necessary. [7]
Along with other agronomic data on soil composition, it is very important to collect data on salt management very quickly and to analyze and communicate the results to users as quickly as possible. There is a need to create all this not just as a technological process, but as part of a system. Such a system is the latest achievement of scientific and technical innovations Building on a platform of geographic information systems that incorporates teams gives even better results. Thus, GIS is a perfect system based on the latest technologies for the reliable analysis and management of planning, data composition, engineering, historical, physicochemical and other necessary information needed to perform activities in an area with certain boundaries, to make optimal decisions.
In addition to the above-mentioned positive features of the compilation of salinity cartograms of arable lands in GIS, it also opens wide opportunities for the application of new research methods in the development of this scientific field. The most important of these research methods is the determination of many land quality indicators through the application of space technology. This system will play an invaluable role in solving global issues such as the processing and delivery of extensive data obtained through the application of such technologies. Combining all these innovations, the integration of the system into modern corporate systems can give a strong impetus to the development of agrochemical science. Thus, following the technological developments, taking into account any changes in the near future, the necessary infrastructure must be built at the technical level. The created cadastral map layers can also be linked to other text sectors by exchanging information and a lot of textual information. [9] The presence of a section on salinity in the map layers can provide a breakthrough in the study and application of this scientific field.
Conclusıon:
Distribution areas of soils in Salyan and Neftchala districts according to the degree of salinity were determined (Table 2).
|
No |
the rate of salinization |
Salyan district
|
Neftchala district |
Project area |
|||
|
Area (ha) |
% |
Area (ha) |
% |
Area (ha) |
% |
||
|
0 |
Living |
22041 |
12 |
10026 |
7 |
32067 |
10 |
|
1 |
Not salty |
32463 |
17 |
34562 |
23 |
67025 |
20 |
|
2 |
Weakly salted |
26487 |
14 |
25725 |
17 |
52212 |
16 |
|
3 |
Moderately salted |
30887 |
16 |
28420 |
19 |
59307 |
18 |
|
4 |
Severely salted |
31745 |
17 |
32597 |
23 |
64342 |
19 |
|
5 |
Very severe salinization |
26592 |
14 |
10592 |
7 |
37184 |
10 |
|
5 |
Saline |
17428 |
10 |
5609 |
4 |
23036 |
7 |
|
Total |
187643 |
100 |
147531 |
100 |
335173 |
100 |
|
Table 2: Distribution of soils according to the degree of salinity in the project area
The sown areas are mainly provided with irrigation canals and drains, however, re-salinization is taking place on previously irrigated or poorly saline irrigated soils. Lack of systematic drainage networks in the areas included in the new crop rotation increases the risk of salinization and salinization in these lands as well.
In the irrigated areas of Salyan and Neftchala districts, the degree of salinity of arable lands was assessed and the results are summarized in Table 3 and Table 4.
|
No |
the rate of salinization |
Salyan district
|
Neftchala district |
Common area |
|||
|
Area (ha) |
% |
Area (ha) |
% |
Area (ha) |
% |
||
|
1 |
Not salty |
19103 |
35 |
20004 |
26 |
39108 |
30 |
|
2 |
Weakly salted |
15482 |
28 |
19762 |
26 |
35244 |
27 |
|
3 |
Moderately salted |
10954 |
20 |
11963 |
16 |
22917 |
17 |
|
4 |
Severely salted |
8069 |
14 |
16788 |
22 |
24856 |
19 |
|
5 |
Very severe salinization |
889 |
2 |
6300 |
8 |
7189 |
6 |
|
6 |
Saline |
307 |
1 |
1552 |
2 |
1859 |
1 |
|
|
Total |
54804 |
100 |
76369 |
100 |
131173 |
100 |
Table 3: On the degree of salinity of arable lands in Salyan and Neftchala districts
|
No |
Şorlaşma dərəcəsi |
Salyan district
|
Neftchala district |
Common area |
|||
|
Area (ha) |
% |
Area (ha) |
% |
Area (ha) |
% |
||
|
1 |
Not salty |
17872 |
39,5 |
14061 |
36 |
31933 |
38 |
|
2 |
Weakly salted |
12941 |
29 |
11061 |
29 |
24003 |
29 |
|
3 |
Moderately salted |
7720 |
17 |
5740 |
15 |
13460 |
16 |
|
4 |
Severely salted |
5371 |
12 |
6036 |
16 |
11407 |
14 |
|
5 |
Very severe salinization |
995 |
2 |
1142 |
3 |
2137 |
2 |
|
6 |
Saline |
169 |
0,5 |
328 |
1 |
497 |
1 |
|
|
Total |
45068 |
100 |
38368 |
100 |
83437 |
100 |
Table 4: Distribution of irrigated areas according to the degree of salinity included in the service area of the Hydrogeological-Ameliorative Expedition in Salyan and Neftchala districts
As a result of agrochemical studies, the causes of soil salinization in the Salyan plain were identified as follows.
1. non-compliance of existing irrigation systems with modern requirements;
2. the main channels are long and not completely covered with solid pavement;
3. Irregular leveling of irrigated lands, non-compliance with the planned use of water;
4. Poor application of precision farming technologies;
5. Improper water management in the area and erosion of the topsoil.

Open Access By Aditum Open Access Journals id licensed under Creative Commons Attribution 4.0 International License. Based On a Work at aditum.org