Worku Kebede1*, Tsion Fikre1, Yazachew Genet1, Kidist Tolosa1, Solomon Chanyalew1, Mengistu Demissie1, Kebebew Assefa1, Habte Jifar1, Nigus Belay2, Getahun Bekana3, Chekol Nigus3, Girma Chemeda4, Molalign Assefa5 and Sewagegn Tariku6
1EIAR, DebreZeit Research Center, P.O.Box 32, Ethiopia
2EIAR, Holetta Research center, P.O.Box 2003, Addis Ababa, Ethiopia
3TARI, Axum Research Center, P.O.Box30, Axum, Ethiopia
4OARI, Bako Research Center, P.O.Box03, Bako Ethiopia
5SARI, Worabe Research Center, P.O.Box021, Worabe, Ethiopia
6AARI, Adet Agricultural Research Center, P.O. Box 8, Bahir Dar, Ethiopia
*Corresponding Author: Worku Kebede, EIAR, DebreZeit Research Center, P.O.Box 32, Ethiopia
Received: May 03, 2021
Accepted: May 07, 2021
Published: May 14, 2021
Citation: Kebede W, Fikre T, Genet Y, Tolosa K, Chanyalew S et.al. (2021) “Evaluating the Performance of Tef Genotypes for Improving Yield on high potential areas”, Journal of Agricultural Research Pesticides and Biofertilizers
, 1(1); DOI:http;//doi.org/05.2021/1.1002.
Copyright: © 2021 Worku Kebede. This is an open access article distributed under the Creative Commons Attribution License, which permits unrestricted use, distribution, and reproduction in any medium, provided the original work is properly cited.
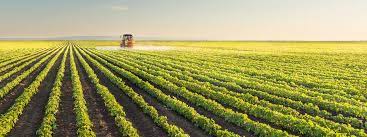
Tef [Eragrostis tef (Zucc.) Trotter], is a staple food crop of Ethiopians that originated and diversified in Ethiopia. It has existed in Ethiopia throughout recorded history. Annually, it occupies more than 3.02 million hectares thereby ranking first among all cereals cultivated in the country. However, the national average yield of tef is low 1.8 t ha [1]. The use of unimproved local cultivars and biotic and abiotic stresses are partially attributed to the low yield of the crop. Thus, the experiment was designed to develop high yielding and desirable quality improved varieties of tef suitable for diverse agro-ecologies and farming systems together with farmer’s opinion. Twenty tef genotypes including two checks were laid out in randomized complete block design using four replications for two years (2018 and 2019) at seven locations (viz. Debre Zeit (black soil), Minjar, Adadi Mariam, Adet, Axum, Ginchi and Holeta).The combined data analysis across locations and over the years indicated that the genotypes DZ-01-974 X GA-10-3 RIL 109 and DZ-01-974 X GA-10-3 RIL 104 performed better than the two checks and other test genotypes.During participatory variety selection farmers overwhelmingly selected the very white seed varieties DZ-01-974 X GA-10-3 RIL 104, DZ-01-974 X GA-10-3 RIL 109 and DZ-01-974 X GA-10-3(RIL NO. 93) respectively. Farmers were selected the genotypes formeet their selection criteria's and market purposes, indicating that tef is a cash crop. The genotype DZ-01-974 X GA-10-3 (RIL NO. 109) and DZ-01-974 X GA-10-3 RIL 104 were very stable genotype with best performance in all tested environments, respectively.
Introduction:
Tef [Eragrostistef (Zucc.) Trotter] has become globally known and various products are available in Europe and North America as health foods especially for persons with gluten intolerance (Saturni et al., 2010). In South Africa, India, Pakistan, Uganda, Kenya and Mozambique tef is mainly grown as a forage or pasture crop (Kebebew et al., 2011). Tef grows under a wide range of ecological conditions from sea level up to 3000 meters above sea level (m.a.s.l). It is annually cultivated on over three million hectares of land, and such it is accounting for about 30% of the total area and 20% of the gross grain production of cereals grown in the country (CSA, 2018). Tef has the genetic potential to yield up to 6 t ha [1] (Seyfu, 1993) and it is a staple food supporting over 70 million people in Ethiopia (CSA, 2015).
Tef is the most important cereal crop in Ethiopia, where the last two decades have shown tremendous increases in both the total area devoted to the crop and its production. Tef is preferred both by farmers and consumers. Farmers prefer cultivating tef to other cereals since tef is more resilient to environmental stresses such as poor soil drainage during rainy season and moisture scarcity. In addition, as a cash crop, both the grain and straw of tef fetch higher and increasing prices than the respective products from other cereals. Consumers prefer tef not only because it makes good quality “injera”, a pancake-like soft bread, but also it is nutritious due to its high protein and mineral content (Ababe et al. 2007and Bultosa et al. 2002), and the absence of gluten (Spaenij-Dekking et al.2005) which makes it an alternative food for people suffering from celiac disease. Due to this life-style nature of the crop, it has been heralded as a super-food or super grain(Jeffrey 2015;Provost and Jobson 2014).In general, tef plays a vital role in food security, nutrition and income generation to smallholder farmers in Ethiopia.
To understand the real causes of low adoption of new varieties, which would in turn inform future variety development efforts in Ethiopia, it is important to work directly with end-users that are primarily farmers. Identifying farmers’needs, searching for suitable material to test with farmers and experimentation on farmers’ fields is important through participatory varietal selection (PVS) to identify preferred varieties. Once identified, the seed of farmer-preferred varieties needs to be rapidly and cost-effectively supplied to farmers. The test materials used in PVS are released or near-finished varieties (Witcombe et al., 1996). It is examination of the crops in farmers’ fields, or the pre-selection of varieties by farmers from trials of many entries grown on a research station or on farm.Improved and released crop varieties used for PVS include rice (Joshi and Witcombe, 1996; Witcombeet al., 1999), sorghum (Mulatu and Belete, 2001), maize (Mulatu and Zelleke, 2002), wheat ( Jalleta, 2004) and tef (Getachew et al. 2006). Consequently, this activity is initiated with the objective to evaluate the best performing lines with respect to stability, yield and preference in the multi-location trial together with farmer’s opinion and to further recommend in the variety verification trial for the high potential tef producing environments.
Materials and Methods:
Experimental Sites:
The field experiment of National Variety Trial was carried out over two years (2018 and 2019) at seven tef growing sites of high potential areas of the country; Debre Zeit (black soil), Minjar, Adadi Mariam, Adet, Axum, Ginchi and Holeta.
Plant materials:
Hybridization/cross between DZ-01-974 X GA-10-3 and DZ-Cr-387 X (DZ-Cr-387 X (GA-10-3)) was made in 2011. DZ-01-974 (Dukam) was selected for its high yielding ability and wide adaptability. DZ-Cr-387 (Quncho) was selected for its high yielding ability, very white seed color and wide adaptability and, GA-10-3 advanced line was selected as a parent for its extra white seed color, thick culm and vigorous growth habit. The purpose was to develop stable, high yielding; and farmers and consumers preferred tef varieties for high rainfall and optimum moisture (high potential) areas of the country. In other words, it was targeted at developing varieties with high yielding potential and better quality than the improved variety Nigus, which gives an average yield of nearest to 2.7 t/ha and the best seed quality.
Crossing and early generation testing for all breeding populations were performed at Debre Zeit Agricultural Research Center from where the National Tef Breeding Program is coordinated. The performance of twenty tef genotypes which includes ten inberd lines from the two independent crosses (DZ-01-974 X GA-10-3) and eight inberd lines from three way crosses [DZ-Cr-387 X (DZ-Cr-387 X (GA-10-3))] as well as two controls (farmers’ check and improved Negus variety were carried out over a two years (2018 and 2019) at seven tef growing sites of high potential areas of the country; Debre Zeit (black soil), Minjar, Adadi Mariam, Adet, Axum, Ginchi and Holeta using Randomized Complete Block Design with four replications. The trial was conducted on the plot size of 2m X 2m with 10 rows per plot throughout all trial sites and 1.5m between replication, 1m between plot, and 20cm between rows. Agronomic and yield data were collected and subjected to statistical analysis in order to identify the best genotypes of the evaluated genotypes.All pre- and post-stand establishment cultural practices were performed as per the research recommendations of the respective test sites.
Participatory Variety Selection:
Participatory variety selectionwere carried out for these experiment on thefarmers field during 2019 at Gimbichu, Adea, Adadimariam, Ambo, Axum, Shambu, Jimma and Worabe. On the participatory variety selection close to 200 farmers were participated and selection were carried out based on farmer’s selection criteria. Farmers’ tef selection criteria are given in Table 3. Among the criteria mentioned by farmers during the interview, crop stand ability, tillering capacity, panicle length andpanicle weight scored the highest responses. Seed colorand panicle length (dalga) were the overriding selection criterion mentioned by more than 80% of the farmers. During the focus group discussion, farmers confirmed that all other selection criteria are considered only after their choice of seed color is fulfilled. White to very white seed-color is chosen for market purposes, while brown seed color is for home consumption.
Data Collection:
Data on grain yield and yield-related traits were collected on plot and plant basis from each plot, respectively. Date of heading and maturity were taken when each plot attained 50% heading (panicle emergency), 90% physiological maturity and lodging index taken during 90% physiological maturity, respectively, and days were calculated beginning from the date of sowing. Data for plant height (cm), panicle length (cm) were collected on the basis of five sample plants which were randomly taken from each plot and the average of five sample plants was used for analysis. Grain yield (g) of each plot was measured on clean, dried seed and the measured grain yield value (g) has converted to kilogram per hectare for analysis. All agronomic practices were done as per the recommendation for tef.
Data Analysis:
Data from individual environments and combined over seven testing sites were made by using SAS Institute (2002) software 9.0 version. The analysis of variance for grain yield and yield-related traits for each seven testing sites was analyzed by using randomized complete block design. The combined analysis of variance across the locations was done in order to determine the differences between genotypes across environments, among environments and their interaction. Before combining the data, Bartlett’s test was used to determine the homogeneity of variances between environments to determine the validity of the combined ANOVA on the data and the data collected was homogenous.Mean comparison using List Significance Difference (LSD) was performed to explain the significant differences among means of genotypes and environments. For participatory variety selection, direct matrix ranking evaluation were used by group of farmers' averages at different locations.
Analysis of Variance (ANOVA) of data of individual location, Yij =µ + Gi +Bj + eij model was used, where; Yij = observed value of genotype i in block j, µ = Grand mean of the experiment, Gi = the effect of genotype i, Bj = the effect of block j, eij =the error of genotype i in block j. Combined analysis of variance over locations over a year were carried out using genotype x site x year (GSY) model. Yijklm=M+Yi+Sj+YSij+R(YS)k(ij)+Gl+GYli+GSlj+GSYlij+eijklm
where; Yijklm = observed value of year iover a site j, M= Grand mean of the experiment, Y= the effect of year i, S= the effect of site j, R(YS)= the effect of replication k in the year i and site j, G= the effect of genotype h, GY = the interaction effect of genotype l with yeari, GS=the the interaction effect of genotype lwith a sitej, GSY= the effect of genotype l by year(i) site(j), eijklm =the error effect of genotype l over year I of site j.
Results and Discussion:
Grain yields across the two main cropping seasons:
The combined analysis of variance for tef grain yield of the 20 genotypes evaluated across seven locations and two main cropping seasons (2018 and 2019) showed highly significant differences (p <0.001) for genotype, year, location and location*year. However, there were no significant differences observed for year*genotype, location*genotype and location*year*genotype (Table 1). This indicated that genotypes performed similarly to the variations in tested environmental conditionson grain yield.
|
Source |
Degrees of freedom |
Sum of squares |
Mean squares |
Explained variance (%) |
|
YEAR |
1 |
24605077.43 |
24605077.43** |
8.94375 |
|
LOC |
6 |
44265584.76 |
7377597.46** |
16.09019 |
|
LOC*YEAR |
2 |
26794377.95 |
13397188.98** |
9.739543 |
|
REP(LOC*YEAR) |
30 |
66827869.93 |
2227595.66** |
24.2914 |
|
ENTRY |
19 |
9218893.34 |
485204.91** |
3.350994 |
|
YEAR*ENTRY |
19 |
3125026.58 |
164475.08NS |
1.135922 |
|
LOC*ENTRY |
114 |
17150039.11 |
150438.94NS |
6.233903 |
|
LOC*YEAR*ENTRY |
38 |
4349129.93 |
114450.79NS |
1.580874 |
|
Error |
570 |
78773184.4 |
138198.6 |
|
|
Corrected Total |
799 |
275109183.4 |
|
|
*. ** denote significance at P≤0.05 and P≤0.01, respectively; NS = Not significant
Table 1: Analysis of variance for grain yield of 20 tef genotypes tested across seven locations over two main cropping seasons
The mean square from the pooled analysis of variance showed statistically significant (P< 0.01) effects of genotypes for all traits assessed (Table 2). As grain yield has been the primary goal of the tef improvement program, the test genotypes DZ-01-974 X GA-10-3 RIL 109 and DZ-01-974 X GA-10-3 RIL 104numerically bit the standard check variety Negus. The average grain yields ofDZ-01-974 X GA-10-3 (DZ-Cr-459 RIL 109) and DZ-01-974 X GA-10-3 (DZ-Cr-459 RIL 104) were 2.7 t ha-1 at research centres (Table3).
DZ-01-974 X GA-10-3 (DZ-Cr-459 RIL 109) and DZ-01-974 X GA-10-3 (DZ-Cr-459 RIL 104) showed higher grain yield advantage of 1.03 and 0.25 percent, respectively, over the standard check (Nigus). Both genotypes have also greater yield advantage of 11.65 and 10.78 percent, respectively, over local cultivar and also comparable shoot biomass yield, and have very white seed color. In this regards it is to be noted that, even though the two genotypes are not out-perform grain yield advantage than standard check varieties Negus in 10 percent, the genotypes havesuperior seed quality than these checks in terms of the whiteness of the seed color. This had the highest price and was well-received on the market.
During participatory variety selection amazingly, farmers were less or not concerned with quantity and quality of the straw for fodder. Farmers were also less interested in agronomic traits that could be manipulated through cultural practices, e.g. adjusting seed and fertilizer rates for tillering capacity and lodging respectively. One interesting criterion, what farmers called dalga in the vernacular perfectly fits with panicle length/weight, a trait highly correlated with grain yield of tef (Tefera et al., 2003).Based on farmers selection the genotype DZ-01-974 X GA-10-3 (DZ-Cr-459 RIL 104), DZ-01-974 X GA-10-3 (DZ-Cr-459 RIL 109), DZ-01-974 X GA-10-3(RIL NO. 93), DZ-01-974 X GA-10-3(RIL NO. 82B) and DZ-Cr-387 X (DZ-Cr-387 X GA-10-3 (RIL NO. 96) have emmer's farmers selection and ranked from one to five, respectively (Table 4). The first two genotypes have got an immense farmer’s attention due to their yielding potential(very long panicle length (dalga)), very white seed color and good straw yield (straw yield is no less important than grain yield) at participatory variety selection trials during 2019.
|
Code |
Genotypes |
Grain yield (kg/ha) across environment |
|||||||
|
Adadi |
Adet |
Axum |
DZ |
Ginchi |
Holeta |
Minjar |
Mean |
||
|
1 |
Standard check (Negus) |
3318 |
2212 |
2877 |
2473 |
2368 |
3134 |
2615 |
2711 |
|
2 |
DZ-01-974 X GA-10-3 RIL 104 |
3022 |
2441 |
2652 |
2576 |
2466 |
2792 |
2986 |
2718 |
|
3 |
DZ-01-974 X GA-10-3 RIL 109 |
3051 |
2563 |
3007 |
2516 |
2308 |
2935 |
2884 |
2739 |
|
4 |
DZ-01-974 X GA-10-3 RIL 118A |
2588 |
2506 |
2674 |
2429 |
2388 |
2803 |
2716 |
2601 |
|
5 |
DZ-01-974 X GA-10-3 RIL 118B |
2620 |
2535 |
2601 |
2434 |
2171 |
2796 |
2727 |
2558 |
|
6 |
DZ-01-974 X GA-10-3 RIL 121 |
3002 |
2304 |
2381 |
2768 |
2221 |
2600 |
2553 |
2521 |
|
7 |
DZ-01-974 X GA-10-3 RIL 122B |
2525 |
2239 |
2452 |
2340 |
2411 |
3105 |
2753 |
2609 |
|
8 |
DZ-01-974 X GA-10-3 RIL 82B |
2783 |
2113 |
2591 |
2473 |
2159 |
2821 |
2884 |
2569 |
|
9 |
DZ-01-974 X GA-10-3 RIL 93 |
2297 |
2457 |
2534 |
2308 |
2309 |
2820 |
2879 |
2561 |
|
10 |
DZ-01-974 X GA-10-3 RIL 94 |
2266 |
2151 |
2657 |
2451 |
2077 |
2875 |
2728 |
2488 |
|
11 |
DZ-Cr-387 X (DZ-Cr-387 X GA-10-3 (RIL 96)) |
3009 |
2148 |
2909 |
2705 |
2496 |
2738 |
2910 |
2706 |
|
12 |
DZ-Cr-387 X (DZ-Cr-387 X GA-10-3 (RIL 13)) |
3070 |
2379 |
2396 |
2271 |
2043 |
2856 |
2758 |
2543 |
|
13 |
DZ-Cr-387 X (DZ-Cr-387 X GA-10-3 (RIL 15)) |
2962 |
2487 |
2826 |
2447 |
2333 |
2724 |
2931 |
2670 |
|
14 |
DZ-Cr-387 X (DZ-Cr-387 X GA-10-3 (RIL 17)) |
2714 |
2470 |
2626 |
2714 |
2290 |
2704 |
2967 |
2645 |
|
15 |
DZ-Cr-387 X (DZ-Cr-387 X GA-10-3 (RIL 26B)) |
3171 |
2302 |
2601 |
2535 |
2112 |
2504 |
2821 |
2548 |
|
16 |
DZ-Cr-387 X (DZ-Cr-387 X GA-10-3 (RIL 31)) |
2661 |
2050 |
2444 |
2361 |
2234 |
2493 |
2924 |
2482 |
|
17 |
DZ-Cr-387 X (DZ-Cr-387 X GA-10-3 (RIL 37B)) |
2759 |
1969 |
2437 |
2134 |
1926 |
2488 |
2808 |
2374 |
|
18 |
DZ-Cr-387 X (DZ-Cr-387 X GA-10-3 (RIL 38A)) |
2441 |
2086 |
2489 |
2468 |
2076 |
2440 |
2770 |
2405 |
|
19 |
DZ-Cr-387 X (DZ-Cr-387 X GA-10-3 (RIL 5)) |
2773 |
2220 |
2295 |
2503 |
2082 |
2531 |
2604 |
2422 |
|
20 |
local Check |
2907 |
1993 |
2575 |
2464 |
1967 |
2448 |
2883 |
2453 |
|
|
Mean |
2797 |
2281 |
2601 |
2468 |
2222 |
2732 |
2807 |
2567 |
|
|
LSD (0.05) |
784.5 |
461.7 |
365.7 |
516.7 |
494.9 |
644.3 |
676.5 |
219.23 |
|
|
CV (%) |
19.81 |
14.29 |
9.92 |
14.78 |
22.53 |
23.82 |
17.16 |
19.44 |
N.B: DZ = DebreZeit
Table 2: Mean yield performance of tef genotypes evaluated in national variety trial (for high potential areas) across environment
|
No. |
Genotypes |
Days to heading (days) |
Days to maturity (days) |
Grain filling period (days) |
Plant height (cm) |
Panicle length (cm) |
Lodging index (%) |
Shoot biomass yield (kg/ha) |
Grain yield (kg/ha) |
|
1 |
Standard check (Negus) |
53.60 |
114.43 |
60.83 |
99.39 |
35.57 |
75.58 |
10265.63 |
2711.30 |
|
2 |
DZ-01-974 X GA-10-3 RIL 104 |
53.78 |
114.65 |
60.88 |
102.26 |
37.86 |
77.58 |
10481.25 |
2718.03 |
|
3 |
DZ-01-974 X GA-10-3 RIL 109 |
53.03 |
114.58 |
61.55 |
100.75 |
36.45 |
75.75 |
9943.75 |
2739.21 |
|
4 |
DZ-01-974 X GA-10-3 RIL 118A |
60.30 |
116.38 |
56.08 |
110.10 |
40.20 |
73.72 |
11353.13 |
2600.95 |
|
5 |
DZ-01-974 X GA-10-3 RIL 118B |
58.70 |
118.23 |
59.53 |
108.91 |
41.33 |
75.49 |
13615.63 |
2557.82 |
|
6 |
DZ-01-974 X GA-10-3 RIL 121 |
53.05 |
113.60 |
60.55 |
98.48 |
37.59 |
80.50 |
9978.13 |
2520.50 |
|
7 |
DZ-01-974 X GA-10-3 RIL 122B |
53.03 |
114.23 |
61.20 |
97.70 |
34.36 |
76.86 |
9381.25 |
2609.43 |
|
8 |
DZ-01-974 X GA-10-3 RIL 82B |
54.70 |
114.95 |
60.25 |
98.97 |
35.07 |
77.07 |
10140.63 |
2568.67 |
|
9 |
DZ-01-974 X GA-10-3 RIL 93 |
55.83 |
115.55 |
59.73 |
108.10 |
38.07 |
78.06 |
10618.75 |
2561.24 |
|
10 |
DZ-01-974 X GA-10-3 RIL 94 |
57.00 |
114.78 |
57.78 |
105.19 |
36.98 |
78.63 |
9956.25 |
2488.35 |
|
11 |
DZ-Cr-387 X (DZ-Cr-387 X GA-10-3 (RIL 96)) |
56.05 |
116.65 |
60.60 |
104.93 |
39.82 |
78.19 |
10806.25 |
2706.64 |
|
12 |
DZ-Cr-387 X (DZ-Cr-387 X GA-10-3 (RIL 13)) |
57.33 |
115.48 |
58.15 |
109.75 |
41.47 |
76.58 |
10993.75 |
2542.80 |
|
13 |
DZ-Cr-387 X (DZ-Cr-387 X GA-10-3 (RIL 15)) |
56.78 |
117.03 |
60.25 |
106.12 |
40.35 |
78.94 |
10787.50 |
2669.75 |
|
14 |
DZ-Cr-387 X (DZ-Cr-387 X GA-10-3 (RIL 17)) |
56.90 |
118.20 |
61.30 |
106.26 |
39.39 |
73.64 |
10956.25 |
2644.69 |
|
15 |
DZ-Cr-387 X (DZ-Cr-387 X GA-10-3 (RIL 26B)) |
58.50 |
115.33 |
56.83 |
104.54 |
40.64 |
77.93 |
10631.25 |
2548.26 |
|
16 |
DZ-Cr-387 X (DZ-Cr-387 X GA-10-3 (RIL 31)) |
59.28 |
116.30 |
57.03 |
110.27 |
41.43 |
79.49 |
11106.25 |
2481.66 |
|
17 |
DZ-Cr-387 X (DZ-Cr-387 X GA-10-3 (RIL 37B)) |
58.50 |
115.25 |
56.75 |
105.07 |
41.19 |
79.65 |
10428.13 |
2374.37 |
|
18 |
DZ-Cr-387 X (DZ-Cr-387 X GA-10-3 (RIL 38A)) |
60.35 |
115.90 |
55.55 |
105.90 |
39.70 |
76.94 |
10640.63 |
2405.41 |
|
19 |
DZ-Cr-387 X (DZ-Cr-387 X GA-10-3 (RIL 5)) |
61.30 |
116.53 |
55.23 |
108.26 |
41.48 |
76.28 |
11003.13 |
2422.40 |
|
20 |
local Check |
54.40 |
115.30 |
60.90 |
100.60 |
36.44 |
83.19 |
10265.63 |
2453.38 |
|
|
Mean |
56.62 |
115.67 |
59.05 |
104.58 |
38.77 |
77.50 |
10667.66 |
2566.99 |
|
|
LSD |
0.92 |
2.27 |
2.33 |
2.83 |
1.89 |
3.47 |
852.15 |
209.77 |
|
|
CV |
3.71 |
4.48 |
9.00 |
6.17 |
11.37 |
10.52 |
18.43 |
18.60 |
|
|
R2 |
0.96 |
0.95 |
0.90 |
0.67 |
0.63 |
0.81 |
0.70 |
0.71 |
Table 3: Mean Agronomic performance of tef genotypes evaluated in national variety trial (for high potential areas) across locations and over years
|
Genotypes |
Crop stand ability |
Tillaring capacity |
Panicle weight |
Lodging tolerance |
Culm strengthens |
Pest free |
Average |
Rank |
|
Standard check (Negus) |
18 |
19 |
10 |
20 |
16 |
14 |
16.2 |
17 |
|
DZ-01-974 X GA-10-3 (RIL NO. 104) |
1 |
1 |
2 |
1 |
10 |
3 |
3.0 |
1 |
|
DZ-01-974 X GA-10-3 (RIL NO. 109) |
2 |
6 |
3 |
4 |
8 |
1 |
4.0 |
2 |
|
DZ-01-974 X GA-10-3 (RIL NO. 118A) |
10 |
16 |
17 |
18 |
17 |
20 |
16.3 |
18 |
|
DZ-01-974 X GA-10-3 (RIL NO. 118B) |
19 |
4 |
14 |
8 |
4 |
5 |
9.0 |
8 |
|
DZ-01-974 X GA-10-3(RIL NO. 121) |
9 |
17 |
18 |
13 |
1 |
12 |
11.7 |
11 |
|
DZ-01-974 X GA-10-3(RIL NO. 122B) |
11 |
10 |
9 |
5 |
5 |
9 |
8.2 |
7 |
|
DZ-01-974 X GA-10-3(RIL NO. 93) |
3 |
3 |
4 |
3 |
13 |
2 |
4.7 |
3 |
|
DZ-01-974 X GA-10-3(RIL NO. 94) |
20 |
11 |
16 |
17 |
2 |
13 |
13.2 |
14 |
|
DZ-Cr-387 X (DZ-Cr-387 X GA-10-3 (RIL NO. 96) |
5 |
5 |
6 |
7 |
3 |
7 |
5.5 |
5 |
|
DZ-Cr-387 X (DZ-Cr-387 X GA-10-3(RIL NO. 17) |
8 |
2 |
1 |
6 |
14 |
6 |
6.2 |
6 |
|
DZ-Cr-387 X (DZ-Cr-387 X GA-10-3(RIL NO. 38A) |
12 |
13 |
11 |
14 |
15 |
19 |
14.0 |
15 |
|
DZ-01-974 X GA-10-3(RIL NO. 82B) |
4 |
7 |
5 |
2 |
6 |
4 |
4.7 |
4 |
|
DZ-Cr-387 X (DZ-Cr-387 X GA-10-3(RIL NO. 13) |
13 |
15 |
13 |
15 |
19 |
16 |
15.2 |
16 |
|
DZ-Cr-387 X (DZ-Cr-387 X GA-10-3(RIL NO. 15) |
16 |
14 |
15 |
10 |
9 |
10 |
12.3 |
13 |
|
DZ-Cr-387 X (DZ-Cr-387 X GA-10-3(RIL NO. 26B) |
17 |
8 |
8 |
11 |
12 |
8 |
10.7 |
10 |
|
DZ-Cr-387 X (DZ-Cr-387 X GA-10-3(RIL NO. 31) |
6 |
9 |
7 |
16 |
18 |
15 |
11.8 |
12 |
|
DZ-Cr-387 X (DZ-Cr-387 X GA-10-3(RIL NO. 37B) |
15 |
20 |
19 |
12 |
20 |
17 |
17.2 |
20 |
|
DZ-Cr-387 X (DZ-Cr-387 X GA-10-3(RIL NO. 5) |
7 |
12 |
12 |
9 |
7 |
11 |
9.7 |
9 |
|
local Check |
14 |
18 |
20 |
19 |
11 |
18 |
16.7 |
19 |
Table 4: Direct matrix ranking evaluation of tef genotypes for high potential areas by group of farmers' (on field) average at different locations (n=198)
GGE biplot analysis:
In GGE biplot analysis, the estimation of yield and stability of genotypes were done by using the average environment (tester) coordinate (AEC) methods (Yan, 2001; Yan et al., 2001). The line passing through the biplot origin is called the average environment (tester) coordinate (AEC), which is defined by the average PC1 (mean yield) and PC2 (stability) scores for all environments (Yan & Kang, 2003). In the biplot, they are close to the origin and have the shorter vector from the AEC. Genotypes on the left side of the line with no arrow have yield performance greater than mean yield and the genotypes on the right side of this line had yields less than mean yield. In this study, genotypes coded 3 followed by genotype coded 2, 1, 10 and 15 were the most stable and high yielding genotypes Figure 1.
The GGE biplot comparison of genotypes relative to the ideal genotype is presented in Figure 2. In this GGE biplot, the first two PCAs captured 66.74% (PCA1 = 40.36, PCA2 = 26.38) of the GGE variance. Closer to the concentric circle indicates a higher mean yield. For selection, the ideal genotypes are those with both high mean yield and high stability. In this figure, the ideal genotype is represented by the small concentric circle and characterized by high mean yield (PC1) and less GE interaction or high stability (PC2). Genotypes that are close to the ideal genotype are more desirable, while those far from it would not be high yielding and stable (Yan & Tinker, 2006). As a result, coded 3 followed by genotype coded 1,2,10 and 15 were more suitable to the testing environments.
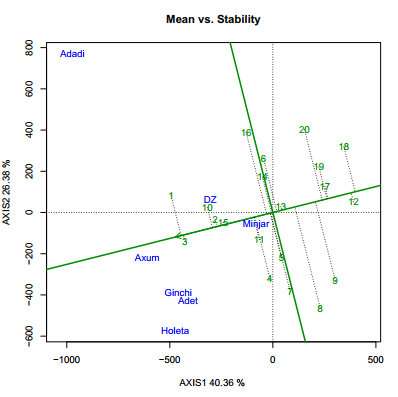
Figure 1: GGE biplot showing the ranking of genotypes for both grain yield and stability performance over environments
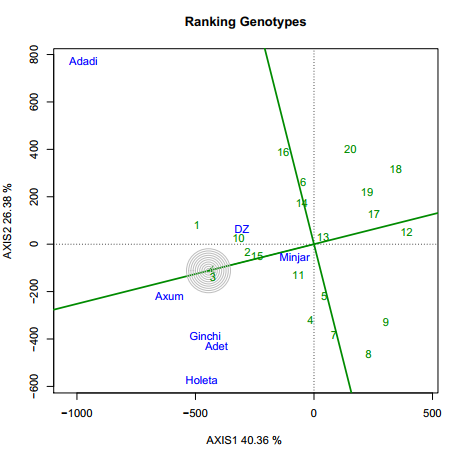
Figure 2: GGE biplot for comparison of the genotypes with respect to the ideal genotype
Conclusion:
All tested genotypes performed similarly to the variations in tested environmental conditionson grain yield performance. Among the tested genotypes, the genotypes DZ-01-974 X GA-10-3 (DZ-Cr-459 RIL 109) and DZ-01-974 X GA-10-3 (DZ-Cr-459 RIL 104) scored higher grain yield 2739 kg/ha and 2718 kg/ha, respectively. Candidate genotypes DZ-01-974 X GA-10-3 (DZ-Cr-459 RIL 109) and DZ-01-974 X GA-10-3 (DZ-Cr-459 RIL 104) yielded 1.03 and 0.25 percent more grain than the standard check, respectively (Nigus). Even if there is a low yield advantage, there is no genotype that perform the two candidates’ genotypes, and it is difficult to achieve grain yields of more than 27qt/ha on average. Both genotypes have better seed quality than checks in terms of the whiteness of the seed colour. The genotype DZ-01-974 X GA-10-3 (RIL NO. 109) was very stable genotype with best performance in all tested environments, major genotypes environments interaction effects revealed inconsistent genotype performance throughout the tested environments. During participatory variety selection, the genotypes DZ-01-974 X GA-10-3 RIL 104, DZ-01-974 X GA-10-3 RIL 109, and DZ-01-974 X GA-10-3 (RIL NO. 93) satisfy farmers' selection requirements.
Author Contributions:
Worku Kebede, Tsion Fikre, Yazachew Genet, Kidist Tolosa, Mengistu Demissie, Nigus Belay, Getahun Bekana, Chekol Nigus, Girma Chemeda, Molalign Assefa and Sewagegn Tariku were carried out the experiment and collect data for analysis. Worku Kebede, Kebebew Assefa, Solomon Chanyalew and Habte Jifar were written the manuscript. All authors read and approved the final manuscript.
Acknowledgments:
The authors are grateful to the Ethiopian Institute of Agricultural Research through Debre Zeit national tef research program for financial support. In addition to this, Holeta, Jima, Adet, Axum, Bako and Worabe research centers are highly acknowledged for executing the experiment with great responsibility.
Competing Interests: The authors declare that they have no competing interests.
Ethics approval: Not applicable.

Open Access By Aditum Open Access Journals id licensed under Creative Commons Attribution 4.0 International License. Based On a Work at aditum.org