Shaikh Badiuzzaman1, Jannatul Naim2, Mesbah Uddin Ahmed3*, Tarun Kanti Paul4
1Assistant Professor (Current Charge), Department of Clinical Pathology, National Institute of Laboratory Medicine and Referral Center, Dhaka.
2Assistant Register, National Institute of Ophthalmology and Hospital, Dhaka.
3MS in Microbiology, Bangladesh University of Health Sciences.
4Tarun Kanti Paul, Lecturer, Dept. of Microbiology, Sylhet M.A.G Osmani Medical College, Sylhet.
*Corresponding Author: Mesbah Uddin Ahmed. MS in Microbiology, Bangladesh University of Health Sciences.
Received Date: June 24, 2023
Accepted Date: July 28, 2023
Published Date: August 04, 2023
Citation: Shaikh Badiuzzaman, Jannatul Naim, Mesbah Uddin Ahmed, Tarun Kanti Paul. (2023) “Reticulocyte Hemoglobin Content and Red Cell Distribution width in Iron Deficiency Anaemia.”, Aditum Journal of Clinical and Biomedical Research, 6(4); DOI: http;//doi.org/08.2023/1.10108.
Copyright: © 2023. Mesbah Uddin Ahmed. This is an open access article distributed under the Creative Commons Attribution License, which permits unrestricted use, distribution, and reproduction in any medium, provided the original work is properly cited.
Reticulocyte count performed on a supravitally stained blood film is a initial and common laboratory method of determining early hematological recovery. This method is rapidly replaced by automated flow cytometry methods which have the advantage of much greater precision, before other test become positive after chemotherapy. A prospective observational study was carried out in the Department of Laboratory Medicine in collaboration with Paediatric Haematology and Oncology, Bangabandhu Sheikh Mujib Medical University during a period of one year to evaluate the bone marrow recovery in children with acute lymphoblastic leukemia by automated reticulocyte analysis over platelet count. Total fifty patients were enrolled in this study on remission induction phase. All patients were between 8 months to 15 years’ age range with a mean age of 5.5 ± 3.2. At the end of the study out of 50 cases, Ret% and Abs ret count showed early recovery in a median of 6 days before the platelet count recovery and concluded that reticulocyte parameter showed earlier haematopoietic recovery than the platelet count recovery.
hematological recovery; chemotherapy
Introduction:
Iron deficiency anemia (IDA) is the most common nutritional anaemia in the world. Reticulocyte hemoglobin content (Ret-He) reflects the amount of iron available for hemoglobin production in the bone marrow.
Methods and materials: This cross sectional study was carried out from Department of Laboratory Medicine in collaboration with Internal Medicine, BSMMU, Shahbag, Dhaka, during March, 2016 to February, 2017 A total of 60 anaemic patients from the department of Internal Medicine were included in this study. Complete blood count (CBC), Ret-He estimation was done by haematology auto analyzer. Biochemical tests were done by biochemical auto analyzer.
Results: More than half 32(53.3%) patients had IDA and 28(46.7%) had anaemia other than IDA by peripheral blood film and serum iron profile which are designed by group I and group II accordingly. Mean±SDRDW-CV(%) was 18.13±1.98 in IDA and 13.53±1 in anaemia other than IDA. The mean±SD Ret-He(pg)was 25.6±2.4 with ranged from 18.6 to 30.1 pg in IDA and 32.9±4.7 with ranged from 26.2 to 40.7 pg in anaemia other than IDA. There is a negative correlation in group I (r=-0.367; p=0.039) between Ret-He and RDW-CV%. There was a significant positive correlation was found between Ret-He and red cell Hb (r=0.453; p=0.009), (r=0.123; p=0.532), in IDA and anaemia other than IDA respectively, Ret-He and serum ferritin (r=0.758; p=0.001), (r=0.208; p=0.289), in IDA and anaemia other than IDA respectively, Ret-He and serum iron (r=0.759; p=0.001), (r=0.243; p=0.393) in IDA and anaemia other than IDA respectively. The validity of Ret-He for evaluation of iron deficiency anaemia was sensitivity 93.8%, specificity 67.9%, accuracy 81.7%, positive predictive values 76.9%and negative predictive values 90.5%. For prediction of IDA and anaemia other than IDA patients Ret-He under curve (AUC) 0.901, with a cut off value of ≥27.0having 89.3% sensitivity and 71.9% specificity, serum iron under curve (AUC) 1.000, with a cut off value of ≥60.5having 96.4% sensitivity and 100.0% specificity, serum ferritin under curve (AUC) 1.000, with a cut off value of ≥12.0having 100.0% sensitivity and 90.6% specificity.
Conclusion: The Ret-He has negative correlation with red cell distribution width. It is an accurate and early marker for diagnosis of iron deficiency anaemia.
Key words: reticulocyte hemoglobin content; red cell distribution width; iron deficiency anaemia.
Introduction:
Anaemia is the most common nutritional problem in the world[1] and a widespread public health problem in Bangladesh[2]. Iron deficiency anemia (IDA) is the commonest form of nutritional anaemiaworldwide[3]. IDA causes poor social behavioral condition[4], detrimental effects on neurological development[5]; and cognitive function[6] etc. In Bangladesh, iron deficiency is most common during rapid growth, menstruation and reproduction, hookworm infestation and diarrhoea[7].For the diagnosis of iron deficiency anaemia, patient’s history, sign, symptoms give the diagnostic clue[8].Iron deficiency anaemia can be diagnosed by haemoglobin, haematocrit, red cell distribution width (RDW-CV), peripheral blood film, s. iron, s. ferritin, total iron- binding capacity (TIBC), transferrin saturation(%), bone marrow examination [9][10].The gold standard of iron deficiency and iron deficiency anaemia diagnosis is bone marrow examination. This is a painful, invasive, costly procedure and highly expertise dependent. It is no longer considered the standard of care for assessment of iron stores [10].RDW-CV is the diagnostic clue for iron deficiency anaemia which has inverse relation with reticulocyte haemoglobincontent[10]. Reticulocytes are the youngest erythrocytes released from the bone marrow into the blood and circulate for 1-2 days before becoming mature erythrocytes. Reticulocyte hemoglobin content (Ret-He) reflects the amount of iron available for hemoglobin production in the bone marrow. Therefore, Ret-He has been proposed as an iron status marker [11].Several studies have indicated that Ret-He measurement in peripheral blood samples is useful for diagnosis of iron deficiency anaemia[12][13][14].Reticulocyte hemoglobin content (Ret-He) is useful diagnostic test in adult patients, geriatric patients [15], pregnant women [16] and patients with chronic kidney disease undergoing hemodialysis.[17]. Ret-He is also useful for detecting iron-restricted erythropoiesis in patients receiving erythropoietin therapy [18]. Reticulocyte hemoglobin content (Ret-He) is a reliable iron marker for monitoring iron therapy’s effectiveness [19][11].Ret-He correlates with iron-deficient erythropoiesis. It is a diagnostic test for iron deficiency anaemia[20][21]. The objective of the study was to evaluate if the reticulocyte haemoglobin content changes proportionately with the iron status and to find out relationship between reticulocyte hemoglobin content and red cell distribution width.
Materials and methods:
This cross sectional study was done from March, 2016 to February, 2017 in the Department of Laboratory Medicine in collaboration with Department of Internal Medicine and Biochemistry & Molecular Biology, BSMMU, Dhaka clinically suspected 60 anaemic adult patients (18 years and above) included from the outpatient dept. who fulfilled the inclusion criteria. Sampling Technique was purposive sampling. 4ml blood was collected among which 2 ml blood was taken in EDTA tube for complete blood count (CBC), Ret-He estimation by haematology auto analyzer (Sysmex-XN 2000) and peripheral blood film. Rest 2 ml of blood was taken in a plain test tube for biochemical test by biochemical auto analyzer (Architect plus ci8200). Both male and female adult (18 years and above) clinically suspected case of anaemia including haemoglobin level below the lower limit of normal range were included in this study. Patients receiving iron supplementation or red cell transfusion, history of blood transfusion for haematological disorder, diagnosed and suspected case of haemoglobinopathies, known case of leukemias, myeloma, myelodysplastic syndrome, known case of vitamin B12 and folate deficiency were excluded from this study. Statistical analysis was carried out by using the Statistical Package for Social Sciences version 20.0 for Windows (SPSS Inc., Chicago, Illinois, USA). Descriptive analysis was performed for all data. The mean values were calculated for continuous variables. The quantitative observations were indicated by frequencies and percentages. Unpaired t-test, Chi-square test used to compare continuous variables between iron deficiency anaemia and anaemia other than IDA patients and to compare categorical data like clinical signs and symptoms accordingly. Pearson’s correlation between Ret-He and RDW-CV, serum Iron, Ferritin, TIBC and Tfsat was performed in different groups as appropriate. Receiver operating characteristic (ROC) curve analysis was performed to identify the optimal Ret-He cut-off value for predicting iron deficiency anaemia. P value <0.05 was considered as significant.
Results:
The cross sectional study was carried out with an aim to find out relationship between reticulocyte hemoglobin content (Ret-He) with red cell distribution width (RDW), serum iron and serum ferritin level. A total of 60 anaemic patients from the department of Internal Medicine, BSMMU, Shahbag, Dhaka, during March, 2016 to February, 2017 were included in this study. Among them 32 patients had iron deficiency anaemia which was considered as Group I and 28 patients hadanaemia other than IDA which was considered as Group II.
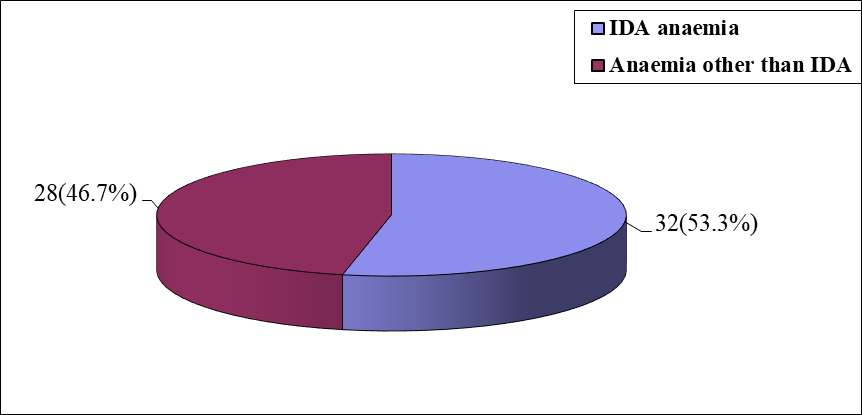
Figure 1: Pie chart showing two groups of study population
|
Age (in year) |
Group-I (n=32) |
Group-II (n=28) |
p value |
||
|
|
n |
% |
n |
% |
|
|
£20 |
3 |
9.4 |
3 |
10.7 |
|
|
21 – 30 |
9 |
28.1 |
3 |
10.7 |
|
|
31 – 40 |
12 |
37.5 |
10 |
35.7 |
|
|
41 – 50 |
5 |
15.6 |
8 |
28.6 |
|
|
51 – 60 |
1 |
3.1 |
2 |
7.1 |
|
|
61 – 70 |
2 |
6.3 |
2 |
7.1 |
|
|
Mean±SD |
35.78 |
±12.19 |
39.82 |
±12.2 |
0.205ns |
|
Range (min-max) |
19 |
-70 |
18 |
-67 |
|
Group I= IDA anaemia, Group II = Anaemia other than IDA, ns= not significant
p value reached from unpaired t-test
Table 1: Distribution of the study patients by age (n=60)
|
Sex |
Group-I (n=32) |
Group-II (n=28) |
p value |
||
|
|
n |
% |
n |
% |
|
|
Male |
6 |
18.8 |
16 |
57.1 |
0.002s |
|
Female |
26 |
81.3 |
12 |
42.9 |
|
s= significant, p value reached from chi square test
Table 2: Distribution of the study patients by sex (n=60)
|
Hematological investigation |
Group-I (n=32) |
Group-II (n=28) |
p value |
|||
|
|
Mean |
±SD |
Mean |
±SD |
|
|
|
Haemoglobin(gm/dl) |
9.3 |
±1.38 |
10.9± |
0.76 |
0.001s |
|
|
Range (min-max) |
6.5 |
-11.1 |
9.1 |
-12.4 |
||
|
Haematocrit % |
31.4± |
3.75 |
37.44 |
±4.45 |
0.001s |
|
|
Range (min-max) |
23.6 |
-39.9 |
30.9- |
46 |
||
|
MCV(fl) |
67.39± |
7.09 |
82.26± |
6.9 |
0.001s |
|
|
Range (min- max) |
51.2- |
75.2 |
69.8 |
-93.3 |
||
|
MCH(pg) |
21.18± |
4.22 |
28.34± |
1.72 |
0.001s |
|
|
Range (min-max) |
13.3- |
26.8 |
23.8- |
31.9 |
||
|
MCHC(gm/dl) |
28.82± |
2.06 |
31.89± |
4.44 |
0.001s |
|
|
Range (min-max) |
24.2- |
30.9 |
10.21 |
-34.9 |
||
|
RBC (count x 1012/L) |
4.58 |
±0.59 |
3.75 |
±0.59 |
0.001s |
|
|
Range (min-max) |
3.17- |
5.57 |
2.9- |
5.24 |
||
|
RDW-CV % |
18.13 |
±1.98 |
13.53 |
±1 |
0.001s |
|
|
Range (min-max) |
14.9- |
22.3 |
11.8- |
15.5 |
||
s=significant, p value reached from unpaired t-test
Table 3: Mean distribution of the study patients by Hematological investigation (n=60)
|
Biochemical test |
Group-I (n=32) |
Group-II (n=28) |
p value |
||
|
|
Mean |
±SD |
Mean |
±SD |
|
|
TIBC (µgm/dl) |
501.5± |
51.7 |
225.8 |
±113.1 |
0.001s |
|
Range (min-max) |
455- |
763 |
112- |
300 |
|
|
Serum iron (µgm/dl) |
32.1, |
±10.6 |
55.4 |
±8.3 |
0.001s |
|
Range (min-max) |
10 |
-57 |
47- |
77 |
|
|
Serum ferritin (µgm/L) |
10.6± |
1.6 |
295.9± |
116.1 |
0.001s |
|
Range (min-max) |
4.8- |
11.9 |
99.1 |
-502.5 |
|
|
Transferrin saturation(%) |
6.4± |
2.3 |
24.5± |
7.3 |
0.001s |
|
Range (min-max) |
2.0- |
11.1 |
29- |
80 |
|
s= significant, p value reached from unpaired t-test
Table 4: Mean distribution of the study patients by Biochemical test (n=60)
|
Ret-He (pg) |
Group-I (n=32) |
Group-II (n=28) |
p value |
||
|
Mean±SD |
25.6± |
2.4 |
32.9± |
4.7 |
0.001S |
|
Range (min-max) |
18.6- |
30.1 |
26.2- |
40.7 |
|
s= significant, p value reached from unpaired t-test
Table 5: Mean distribution of the study patients by Ret-He (n=60)
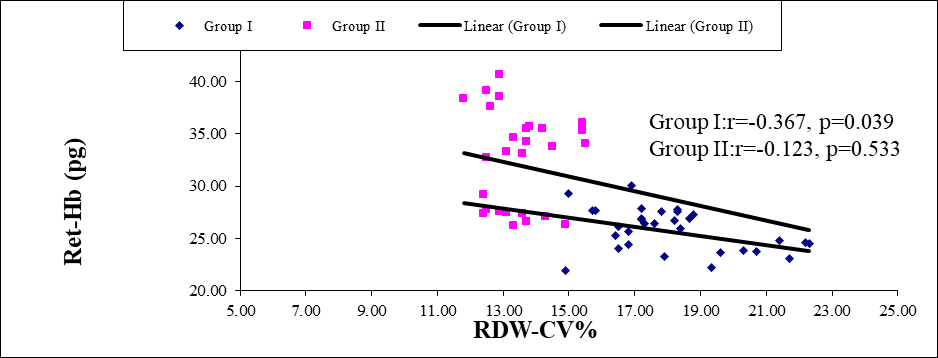
Figure 2: Scatter diagram of group I and group II between Ret-He and RDW-CV(n=60)
Scatter diagram showing negative correlation in group I (r=-0.367; p=0.039) and group II (r=-0.123; p=0.533) between Ret-He and RDW-CV%.
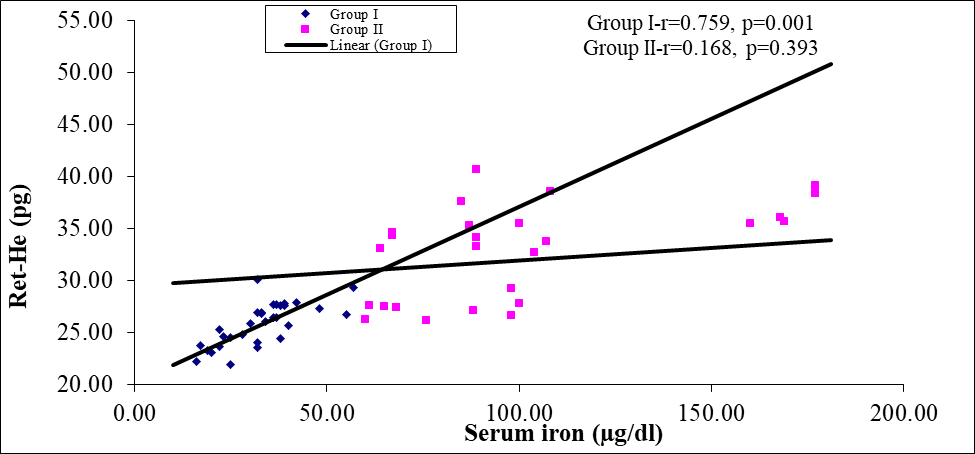
Figure 3: Scatter diagram of group I and group II between Ret-He and serum iron (n=60)
Scatter diagram showing strong positive correlation (r=0.759; p=0.001) in group I and positive correlation (r=0.243; p=0.393) in group II between Ret-He and serum iron.
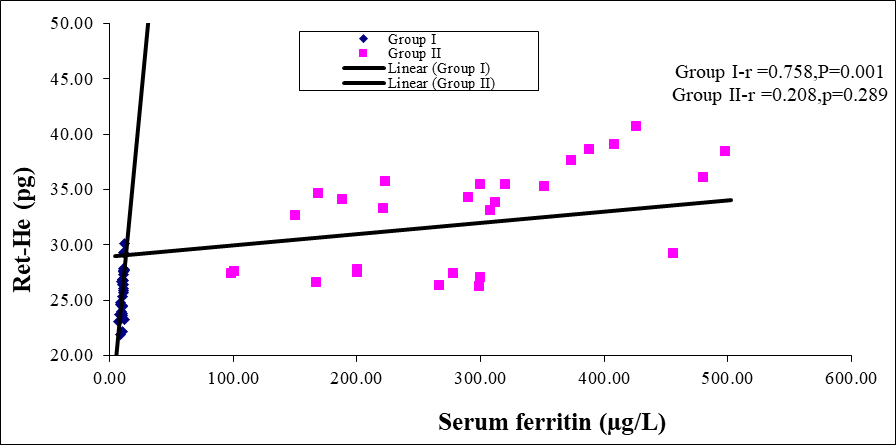
Figure 4: Scatter diagram of group I and group II between Ret-He and serum ferritin (n=60)
Scatter diagram showing strong positive correlation (r=0.758; p=0.001) in group I and positive correlation (r=0.208; p=0.289) in group II between Ret-He and serum ferritin.
Scatter diagram showing negative correlation in group I (r=-0.423; p=0.022) and group II (r=-0.222; p=0.257) between Ret-He and TIBC. Figure 5
Scatter diagram showing positive correlation in group I (r=0.390; p=0.022) and group II (r=0.140; p=0.476) between Ret-He and Tfsat%. Figure 6
|
Ret-He |
Biochemical (serum iron profile) diagnosis Group I Group II |
|
|
IDA Positive (n=32) |
IDA Negative (n=28) |
|
|
Positive (n=39) |
30(True positive) |
9(False positive) |
|
Negative (n=21) |
2(False negative) |
19(True negative) |
Table 6: Comparison between biochemical (serum iron profile) diagnosis and Ret-He test for evaluation of iron deficiency anaemia (n=60)
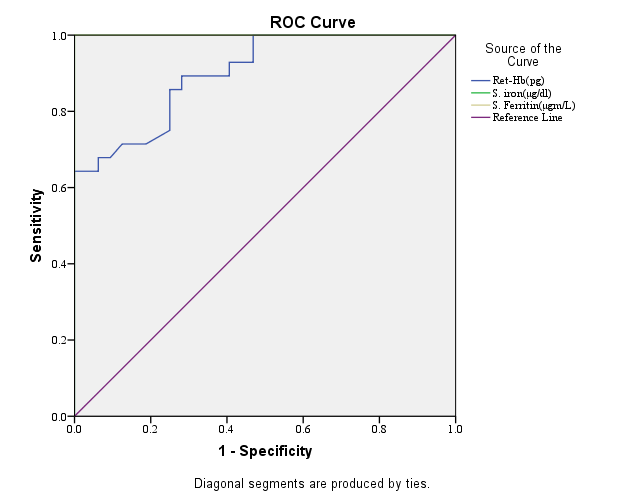
Figure 5: Receiver-operating characteristic curves of Ret-He, serum iron and serum ferritin for evaluation of IDA and anaemia other than IDA patients.
Receiver-operating characteristic curve of Ret-He, Serum iron and serum ferritin for evaluation of IDA and anaemia other than IDA patients (n=60).
|
Validity test |
Percentage |
|
Sensitivity |
93.8 |
|
Specificity |
67.9 |
|
Positive predictive value |
76.9 |
|
Negative predictive value |
90.5 |
|
Accuracy |
81.7 |
Table 7: Sensitivity, specificity, accuracy, positive and negative predictive values of the Ret-He values for evaluation of iron deficiency anaemia
The validity of Ret-He for evaluation of iron deficiency anaemia was correlated by calculating sensitivity, specificity, positive predictive values, negative predictive values and accuracy of 93.8%, 67.9%, 76.9%, 90.5% and 81.7% respectively.
Discussion:
Several studies have indicated that Ret-He measurement in peripheral blood samples is useful for diagnosis of iron deficiency[12],[22],[13],[14].This cross sectional study was carried out with an aim to find out relationship between reticulocyte hemoglobin content (Ret-He) with red cell distribution width (RDW), serum iron and serum ferritin level. A total of 60 anaemic patients from the department of Internal Medicine, BSMMU, Shahbag, Dhaka, during March, 2016 to February, 2017 were included in this study. Among them 32 patients were iron deficiency anaemia which were considered as Group I and 28 patients were anaemia other than IDA which were considered as Group II. In this present study, it was observed that through peripheral blood film and serum iron profile of the study patients, more than a half (53.3%) of the patients had IDA anaemia and 46.7% had anaemia other than IDA. In another study, Schapkatiz E, (2016) found 62% IDA patient and 38% anaemia other than IDA patient[10]. The present study is consistent with this study. In this study, it was observed that 12 (37.5%) patients belonged to age 31-40 years in group I and 10 (35.7%) in group II which are the highest percentage among all ages in the study. The mean±SD age (years) was 35.78±12.19 in group I and 39.82±12.2 in group II. It was observed that no significant (p>0.05) difference in age between two groups. Karlsson T, (2011) and Karagulle M, (2013) found that there was no significant difference (p>0.05) in age between the two groups[15],[3]. It was observed in present study that majority patients were female (81.3%) in group I and male (57.1%) in group II. IDA was significantly (p<0.05) higher in female subject. Schoorl M, (2012) and Ch H, et al., (2008) reported that majority (70%) patients of IDA were female[16[,[23]. The present study is nearer to this study. In the study it was observed that the mean±SD Hb (gm/dl) was 9.3±1.38, mean±SD haematocrit (%) was 31.4±3.75, mean±SD MCV (fl) was 67.39±7.09, mean±SD MCH (pg) was 21.18±4.22, mean±SD MCHC(gm/dl) was 28.82±2.06,mean±SD RBC (count x 1012) was 4.58±0.59, mean±SD RDW-CV (%) was 18.13±1.9 in group I and 10.9±0.76, 37.44±4.45, 82.26±6.9, 28.34±1.72, 31.89±4.44, 3.75±0.59, 13.53±1 in group II respectively. Regarding the hematological investigations, all parameters except RBC count and RDW-CV were significantly higher in group II, however RBC and RDW-CV were significantly higher in group I.Karlsson T, et al., (2011), Schoorl M, (2012), Swart P D R, et al., (2014) performed studies in elderly patients. They have reported that mean±SD Hb, mean±SD MCH, mean±SD MCV were 8.3±2.3, 24.6±4.3, 80.2±10.4 respectively in IDA patients and 100±13, 30.5±3.3, 94.3±9.8 accordingly in ACD patients[15],[16],[21].The current study findings are similar with their study. In the current study, it was found that the mean±SD TIBC (µgm/dl), mean±SD serum iron (µgm/dl), mean±SD serum ferritin (µgm/L) and mean±SD Tfsat (%) were 501.5±51.7, 32.1±10.6, 10.6±1.6, and6.4±2.3 respectively in group I and 225.8±113.1, 55.4±8.3, 295.9±116 and 24.5±7.3 respectively in group II. The difference between two groups was significant (p<0.05).TIBC was significantly (p<0.05) higher in group I, whereas serum iron, serum ferritin and Tfsat were significantly (p<0.05) higher in group II. Karlsson T, (2011) found mean±SD TIBC (µgm/dl), mean±SD serum iron (µgm/dl), mean±SD serum ferritin (µgm/L) and mean±SD Tfsat (%) 414±92.4, 20.9±15.9, 14±10, 8.5±13.2 in IDA patients and 249.7±94.6, 51.7±47.85, 439±416, 22.7±2.2 respectively. These results are nearly consistent with the studies done by Karlsson T, (2011), Fishbane S,et al., (1997), Ullrich C, et al., (2005)[15],[24],[14]. In this study, it was observed that the mean±SD Ret-He (pg) was 25.6±2.4 in group I and 32.9±4.7 in group II. Karlsson T, (2011), Swart P D R, (2014), Karagulle M (2013) determined the mean±SD Ret-He in IDA patients 25.9±3.9, 24.74±4.33, 24.95±3.92 respectively[15],[21],[3]. The observation of the study is consistent with other study. In this present study it was observed that there was a significant positive correlation was found between Ret-He and serum ferritin (r=0.758; p=0.001), (r=0.208; p=0.289), Ret-He and serum iron (r=0.759; p=0.001), (r=0.243; p=0.393), in group I and group II respectively. On the other hand there was a negative significant correlation found between Ret-He and RDW-CV (r=-0.367; p=0.039), (r=-0.229; p=0.242) in group I and group II respectively. The correlation performed by Pearson’s correlation. Karagulle M, et al., (2013) and Brugnara C, et al., (2006) studies found that Ret-He showed a significant positive correlation with serum iron (r=0.648) in group I and a significant negative correlation with [3],[25]. This correlation is similar to this study. In the present study, sensitivity, specificity, accuracy, positive predictive value and negative predictive value in diagnosing iron deficiency anaemia were 93.8%, 67.9%, 81.7%, 76.9%, 90.5% respectively. Fishbane S, et al., (1997), Brugnara C, (2006), Karagulle M, et al., (2013) had found sensitivity and specificity 93.3%, 90.6% and 83.2%, 83% respectively[24][25][3]. Positive predictive value and negative predictive value of Mast A E, et al., (2002) and Fishbane S, et al., (1997) study were 58.6% and 77.6% accordingly[12],[24]. These values were close to our study. Findings of this present study regarding Ret-He are sensitivity 89.3%, specificity 71.9%, AUC 0.901 with cut off value 27.0 pg. Sensitivity, specificity and AUC of serum iron (µgm/dl) are 96.4%, 100%, 1.000 with cut off value 60.5. Having cut off value 12.0, sensitivity, specificity and AUC of serum ferritin are 100%, 90.6% and 1.000 accordingly. Above findings were evaluated by receiver operating characteristic (ROC) curves for diagnosis of IDA. Karagule M et al., (2013) determined a cut-off value of Ret-He 29.3 pg having 90.6% sensitivity, 66.7% specificity, 1.000 AUC by ROC analysis in patients with IDA[3]. Brugnara C, (1999) showed a cut-off value of Ret-He 26 pg having 83% sensitivity, 75% specificity, 1.000 AUC by ROC analysis in patients with IDA[22].Brugnara C, et al. (2006) found receiver operator characteristic (ROC) curve analysis revealed with a Ret-He cutoff level of 27.2pg, with a sensitivity of 93.3%, and a specificity of 83.2% and AUC 0.913[25]. So, the result of this study is similar with others.
Conclusion:
Reticulocyte haemoglobin content assay is a simple, quick and easy method where automated haematology analyzer such as Sysmex XN-2000, Sysmex XT-4000i, Advia are available. Reticulocyte haemoglobin content was lower in iron deficiency anaemia whereasred cell distribution width-CV was the higher. Further multi centered prospective cohort study is recommended after proper exclusion of hemoglobinopathies, specific investigations with large sample size and follow up study is recommended after correction of iron deficiency anaemia.
Conflict of interest: There is no conflict of interest relevant to this paper to disclose.
Funding agency: This research project was not funded by any group or any institute.

Open Access By Aditum Open Access Journals id licensed under Creative Commons Attribution 4.0 International License. Based On a Work at aditum.org