Aditum Journal of Clinical and Biomedical Research
OPEN ACCESS | Volume 8 - Issue 1 - 2026
ISSN No: 2993-9968 | Journal DOI: 10.61148/2993-9968/AJCBR


Ayesha Siddika Anney 1* and Soma Chowdhury Biswas 2
Department of Statistics, University of Chittagong, Hathazari, Chittagong-4331, Bangladesh
*Corresponding Author: Ayesha Siddika Anney, Department of Statistics, University of Chittagong, Hathazari, Chittagong-4331, Bangladesh.
Received: June 11, 2021
Accepted: July 05, 2021
Published: July 26, 2021
Citation: Ayesha S Anney and Soma C Biswas. (2021) “Risk Factors Accessing of Infant Mortality: Cox Proportional Hazard Model vs. Cox Frailty Model.”, Aditum Journal of Clinical and Biomedical Research, 2(5); DOI: http;//doi.org/06.2021/1.1049.
Copyright: © 2021 Ayesha Siddika Anney. This is an open access article distributed under the Creative Commons Attribution License, which permits unrestricted use, distribution, and reproduction in any medium, provided the original work is properly Cited.
Introduction:
Infant (0-11 months) nutritional, health and mortality status is a very concerning issue in Bangladesh. This study aims to find out the risk factors of infant mortality by the application of survival models according to Bangladesh Demographic Health Survey-2014.
Methods:
The study utilized the information on 1503 infants that were born in the five years preceding the survey, 42 did not survive and 1461 were still surviving. To access the risk factors of infant mortality, Cox proportional hazard model was employed and for testing the unobserved heterogeneity among children, Cox frailty model has been considered.
Results:
Mother’s working status, number of antenatal care visits, multiplicity of birth and numbers of living children are significantly associated as the cause of the infant’s death and variability is 0.002401.
Conclusion:
Study results recommended that to improve antenatal care utilization, facilities in the job sector for women and newborn care.
Introduction:
Infant mortality is one of the most important sensorial indicators of the socio-economic and health status of a country. In moderate and high mortality populations, childhood deaths may constitute half of all deaths and differences in levels of child survival between developing and developed countries are very marked, more so than for any other age group (Preston, 1980; Kathryn and Amin, 1992). Child and infant mortality are a widely used indicator of the health status of all population as well as the level of development of a country; also reflects social, economic and environmental conditions in which children (and others in society) live including their health care.” (Reidpath & Allotgey, 2003; Alderman & Behrman, 2004). Like other South Asian countries, Bangladesh has a high risk of infant mortality. According to UNICEF-2018, the infant mortality rate of Bangladesh is 26.9 deaths per 1,000 live births in 2017 (Table 1) [1].
|
|
Bangladesh |
India |
Pakistan |
Bhutan |
Nepal |
Srilanka |
Maldives |
Afganistan |
|
1990 |
99.7 |
88.4 |
106.2 |
89.5 |
97.9 |
17.9 |
68.1 |
120.2 |
|
1991 |
95.9 |
86.2 |
104.4 |
85.9 |
93.4 |
18 |
65.1 |
116.4 |
|
1992 |
92.1 |
84 |
102.6 |
82.4 |
89.1 |
18 |
62.2 |
112.9 |
|
1993 |
83.3 |
82 |
100.8 |
79.1 |
85 |
18 |
59.2 |
109.5 |
|
1994 |
84.5 |
79.9 |
99.1 |
75.8 |
81 |
18 |
56.1 |
106.3 |
|
1995 |
80.8 |
77.8 |
97.3 |
72.6 |
77.2 |
17.8 |
52.9 |
103.3 |
|
1996 |
77.2 |
75.6 |
95.5 |
69.4 |
73.6 |
17.3 |
49.6 |
100.5 |
|
1997 |
73.7 |
73.4 |
93.6 |
66.3 |
70 |
16.8 |
46 |
97.9 |
|
1998 |
70.3 |
71.1 |
91.7 |
63.4 |
66.7 |
16.1 |
42.4 |
95.4 |
|
1999 |
67 |
68.8 |
89.9 |
60.4 |
63.4 |
15.4 |
38.7 |
93.1 |
|
2000 |
64 |
66.6 |
88.1 |
57.6 |
60.3 |
14.7 |
35 |
90.8 |
|
2001 |
61 |
64.3 |
86.3 |
54.9 |
57.4 |
14.1 |
31.3 |
88.4 |
|
2002 |
58.2 |
62 |
84.7 |
52.4 |
54.6 |
13.7 |
27.8 |
86.1 |
|
2003 |
55.6 |
59.9 |
83.1 |
49.8 |
52.1 |
13.4 |
24.6 |
83.6 |
|
2004 |
53.1 |
57.7 |
81.7 |
47.4 |
49.6 |
13.1 |
22.3 |
81.1 |
|
2005 |
50.6 |
55.7 |
80.3 |
44.9 |
47.3 |
15.6 |
19.2 |
78.5 |
|
2006 |
48.2 |
53.7 |
78.9 |
42.6 |
45.1 |
12.3 |
17.1 |
76 |
|
2007 |
45.8 |
51.6 |
77.6 |
40.4 |
43.1 |
11.7 |
15.3 |
73.4 |
|
2008 |
43.5 |
49.6 |
76.3 |
38.3 |
41.1 |
11.1 |
13.8 |
70.8 |
|
2009 |
41.3 |
47.6 |
75 |
36.2 |
39.2 |
10.1 |
12.5 |
68.2 |
|
2010 |
39.1 |
45.5 |
73.6 |
34.4 |
37.4 |
9.7 |
11.3 |
65.7 |
|
2011 |
37 |
43.5 |
72.2 |
32.7 |
35.7 |
9.3 |
10.3 |
63.3 |
|
2012 |
35 |
41.6 |
70.7 |
31.3 |
34.1 |
9.1 |
9.5 |
61 |
|
2013 |
33.2 |
39.7 |
69.1 |
30 |
32.5 |
8.8 |
8.7 |
58.8 |
|
2014 |
31.4 |
37.9 |
67.3 |
28.8 |
31 |
8.5 |
8.2 |
56.8 |
|
2015 |
29.7 |
36.2 |
65.7 |
27.8 |
29.6 |
8.3 |
7.7 |
54.9 |
|
2016 |
28.2 |
34.6 |
64.2 |
26.8 |
28.4 |
8 |
7.3 |
53.2 |
|
2017 |
26.9 |
32 |
61.2 |
25.6 |
27.8 |
7.5 |
6.8 |
51.5 |
Table 1: Infant mortality rate (per 1,000 live births) in South Asian countries (1990-2017), UNICEF-2018.
The early childhood mortality rates obtained for the five years preceding the DHS surveys conducted in Bangladesh since 1993-1994 confirm a declining a trend in infant mortality and a Bangladeshi infant was around two times more likely to die before reaching his/her first birthday in the early 1990s than in 2014 (Figure 1) [2].
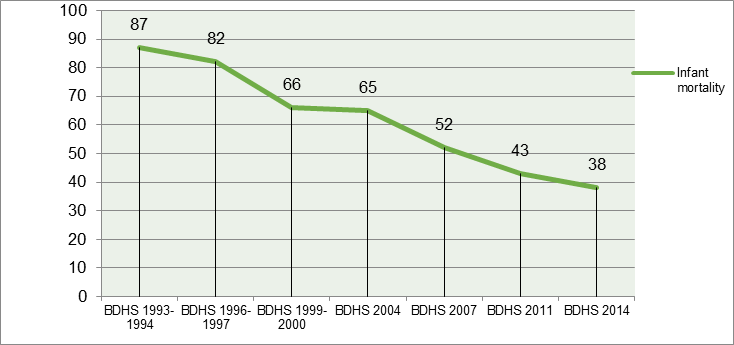
Figure 1: Trends in infant (0-11 months) mortality rates per 1000 live births, BDHS (1993-1994)-BDHS 2014
Bangladesh as a member of the World Health Organization (WHO) and as a signatory of the Alma-Ata declaration in 1978 is executed to achieve the goal of health care as the key approach. In recent years, Bangladesh's health and family planning program has successfully implemented a wide array of fertility and mortality reduction interventions. In 1993, GOB (Government of Bangladesh) started a phase implementation of the Acute Respiratory Infection (ARI) control program. In 2015, when the world began working targeted Millennium Development Goals (MDGs), then to seeking to achieve the early childhood mortality to at least as low as 25 death per 1,000 live births by 2030 is referred as the “Third Sustainable Development Goals (SDGs3)”[3]. Over 46 years, after independence in 1971 the health system of Bangladesh has gone through several reforms and established an extensive health infrastructure in the public and private sectors. Also, the Government of Bangladesh (GOB) has been following the sector-wide approach in the health sector of the country from 1998 and presenting the 4th program- Health, Population and Nutrition Sector Program (HPNSP) (2017-2022) is being implemented. The program is comprised of three components; namely, governance- stewardship of the sector, strong health system and health services to achieve health, population, and nutrition sector targets and health-related SDGs. However, despite all the efforts, health care facilities in Bangladesh remain limited and inadequate. In 2017, 4.1 million infant deaths occurred within their first year of life and have declined from 8.8 million in 1990 globally4. Many socioeconomic factors such as, paternal-maternal education, income status of family etc; some proximate factors like, maternal age at marriage and first birth, birth spacing pattern, total children born to mother, parity, size of child at birth, place of delivery, mode of delivery, ANC (Antenatal care) visits, vaccination are associated with infant mortality. Also, environmental and household factors (region, type of place of residence, type of toilet facility, source of drinking water) can be related to cause of infant deaths. The purpose of this work is to find out the risk factors of infant mortality by survival models; Cox proportional hazard model and Cox-frailty model.
Materials and Methods:
Source of data and variables:
The data used for this study is a secondary data obtained from the Bangladesh Demographic Health Survey- 2014 (BDHS-2014), which is the seventh DHS survey conducted in Bangladesh under the authority of the National Institute of Population Research and Training (NIPORT) of the Ministry of Health and Family Welfare (MHFW) and implemented by Mitra and Associates of Dhaka; which is freely available online and contains information on a wide range about socioeconomic, demographic, hygienic and household variables of the population nationwide2. The BDHS survey has been conducted approximately every five years since 1993-1994. A two-stage cluster sampling was utilized to determine the sample size and included a household survey of ever-married women age 15-49 by conducting face-to-face interviews on 18,000 residential households; expected number of completed interviews was 17,886.
In the study, 1503 infant’s survival information obtained from the birth history data of BDHS-2014. The dependent variable of the study was infant (0-11months) mortality; i.e., probability of dying before reaching his/her the first birthday (<12 months). For this study, child age in month has been computed by subtracting “Date of birth (CMC)” from “Date of interview (CMC)”. The survival status of infant coded as “0= Death” and “1= Alive”. The risk factors/ independent variables/ covariates were recited into three categories; socio-economic factors, demographic/ proximate factors, hygienic and household factors. (Table 2)
|
Background Characteristics
|
Categories |
Total N (%) |
No. of deaths within 5 years of survey (%) |
Log-rank test (Mantel-Cox) c2
|
d.f |
p-value |
|
Region |
1= Dhaka |
264 (17.6) |
3 (1.1) |
8.752 |
6 |
0.188 |
|
2=Chittagong |
282 (18.8) |
5 (1.8) |
||||
|
3= Barisal |
193 (12.8) |
5 (2.6) |
||||
|
4=Khulna |
174 (11.6) |
7 (4.0) |
||||
|
5=Rajshahi |
187 (12.4) |
7 (3.7) |
||||
|
6=Rangpur |
173 (11.5) |
4 (2.3) |
||||
|
7=Sylhet |
230 (15.3) |
11 (4.8) |
||||
|
Type of place of residence |
1=Urban |
484 (32.2) |
8 (1.7) |
3.284 |
1 |
0.070* |
|
2=Rural |
1019 (67.8) |
34 (3.3) |
||||
|
Religion |
1=Islam |
1387 (92.3) |
41 (3.0) |
1.754 |
1 |
0.185 |
|
2=Non-islam |
116 (7.7) |
1 (1.0) |
||||
|
Mother’s educational level
|
0=No education |
201 (13.4) |
9 (4.5) |
5.492 |
3 |
0.114 |
|
1=Primary |
408 (27.1) |
15 (3.7) |
||||
|
2=Secondary |
699 (46.5) |
16 (2.3) |
||||
|
3=Higher |
195 (13) |
2 (1.0) |
||||
|
Mother’s working status |
0=No |
1246 (83) |
30 (2.4) |
2.954 |
1 |
0.086* |
|
1=Yes |
257 (17) |
12 (4.7) |
||||
|
Father’s educational level
|
0=No education |
306 (20.4) |
15 (4.9) |
11.065 |
3
|
0.011** |
|
1=Primary |
470 (31.3) |
17 (3.6) |
||||
|
2=Secondary |
488 (32.5) |
8 (1.6) |
||||
|
3=Higher |
239 (16) |
2 (0.8) |
||||
|
Father’s occupation
|
1= Agricultural worker |
321 (21.4) |
11 (3.4) |
0.609 |
2 |
0.738 |
|
2=Non-agricultural worker |
128 (8.5) |
3 (2.3) |
||||
|
3= Others |
1054 (70.1) |
28 (2.7) |
||||
|
Wealth status of family |
1=Poor |
610 (40.6) |
23 (3.8) |
3.772 |
2 |
0.152 |
|
2=Middle |
286 (19) |
7 (2.4) |
||||
|
3=Rich |
607 (40.4) |
12 (2.0) |
||||
|
Mother’s age at first birth |
1= Age 12-17 years |
626 (41.7) |
15 (2.4) |
0.953 |
2
|
0.621 |
|
2= Age 18-29 years |
866 (57.6) |
27 (3.1) |
||||
|
3= Age 30+ years |
11 (0.7) |
0 (0) |
||||
|
Number of ANC visits |
0=No visit |
281 (18.7) |
18 (6.4) |
14.770 |
1 |
0.000*** |
|
1= At least once |
1222 (81.3) |
24 (2.0) |
||||
|
Place of delivery
|
1=Home |
864 (57.5) |
24 (2.8) |
0.202 |
1 |
0.653 |
|
2=Any other medical facilities |
639 (42.5) |
18 (2.8) |
||||
|
Number of living children |
1= 1 or 2 children |
1147 (76.3) |
39 (3.4) |
6.291 |
1 |
0.012*** |
|
2= 3 or more |
356 (23.7) |
3 (1.0) |
||||
|
Total children ever born |
1= 1 child |
625 (41.6) |
18 (2.9) |
0.329 |
2 |
0.848 |
|
2= 2 or 3 children |
698 (46.4) |
20 (2.9) |
||||
|
3= 4 or more |
180 (12) |
4 (2.2) |
||||
|
Preceding birth interval |
1= 1st child |
633 (42.1) |
23 (3.6) |
3.302 |
2 |
0.192 |
|
2=Interval < 48 months |
344 (22.9) |
7 (2.03) |
||||
|
3= Interval >= 48 months |
526 (35) |
12 (2.2) |
||||
|
Currently breastfeeding |
0=No |
77 (5.1) |
42 (54.5) |
723.451 |
1 |
0.000*** |
|
1=Yes |
1426 (94.9) |
0 (0) |
||||
|
Birth order number |
1=1st birth order/rank |
629 (41.8) |
20 (3.1) |
1.014 |
2 |
0.602 |
|
2=2nd birth order /rank |
466 (31.0) |
13 (2.8) |
||||
|
3= 3rd order or more |
408 (27.1) |
9 (2.2) |
||||
|
Multiplicity of birth |
1=Single birth |
1483 (98.7) |
38 (2.6) |
120.881 |
1 |
0.000*** |
|
2=Multiple birth |
20 (1.3) |
4 (20) |
||||
|
Child size at birth
|
1=Average/Large |
1408 (93.7) |
36 (2.6) |
4.247 |
1 |
0.039** |
|
2=Very small (<= 2.5 kg) |
95 (6.3) |
6 (6.3) |
||||
|
Sex of child |
1= Male |
794 (52.8) |
26 (3.3) |
1.791 |
1 |
0.181 |
|
2= Female |
709 (47.2) |
16 (2.3) |
||||
|
Exposure to mass media |
0=No |
757 (50.4) |
26 (3.4) |
2.087 |
1 |
0.149 |
|
1=Yes |
746 (49.7) |
16 (2.1) |
||||
|
Sex of household head
|
1=Male |
1383 (92) |
41 (3) |
1.738 |
1 |
0.187 |
|
2=Female |
120 (8) |
1 (0.8) |
||||
|
Source of drinking water |
1= Tube-well water |
1142 (76) |
34 (3) |
0.356 |
2 |
0.837 |
|
2= Piped water |
110 (7.3) |
2 (1.8) |
||||
|
3= Others |
251 (16.7) |
6 (2.4) |
||||
|
Type of toilet facility |
1= Pit-toilet latrine |
673 (44.8) |
17 (2.5) |
1.896 |
3 |
0.594 |
|
2= Flush toilet |
243 (16.2) |
5 (2.1) |
||||
|
3=No facility |
32 (2.1) |
1 (3.1) |
||||
|
4=Others |
555 (37) |
19 (3.4) |
[Note: ANC: Antenatal care; * p<0.10, **p<0.05 and ***p<0.01]
Table 2: Summary statistics of infant according to selected variables and Log-rank test (Mantel-Cox) for infant mortality, BDHS-2014
Methods:
Kaplan-Meier estimate, Log-rank test, Bonferroni correction and Log-minus-log plot
The Kaplan-Meier procedure (1958) is used to analyze data based on the survival time. It is a most common method used in survival data analysis and also known as product limit method. The K-M (Kaplan-Meier) estimate of survival time t is shown as, S(t)= tj<t, j=1knj-djnj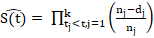 ; j=1, 2, 3, ……. , k.
Where, tj = Total set of failure times recorded.
nj = The number of observations/individuals at risk at the survival time t.
dj = Number of failures or deaths at time tj .
Also, the hazard function h(t) is defined as the event/failure/death rate at time t conditional or surviving up to or beyond time t.
The Log-rank test is the most popular test for testing the equality of survival or hazard functions. Then the hypothesis will be,
H0: h1t=h2t=…= hk(t) ; for all t≤T
Or, H0 = All survival functions are the same.
The Cox-Mantel Log-rank test statistic is, ᵡCM2= j=1kOj-Ej2Ej 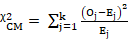 ᷉ ᵡG-12
 .
.
Where, G is the number of groups of individuals.
Oj = doj
= doj = Number of deaths observed for the group 0 at the j-th death time.
Ej = djn0jnj
 = Number of deaths expected for the group 0 at the j-th death time.
And, j=1, 2, 3, ……., k.
The Bonferroni correction is an adjustment made to p-values when several dependent or independent statistical tests are being performed simultaneously on a single data set. To perform a Bonferroni Correction, divide the critical p-value (


Open Access By Aditum Open Access Journals id licensed under Creative Commons Attribution 4.0 International License. Based On a Work at aditum.org
