Aditum Journal of Clinical and Biomedical Research
OPEN ACCESS | Volume 8 - Issue 1 - 2026
ISSN No: 2993-9968 | Journal DOI: 10.61148/2993-9968/AJCBR


S. Jeevananda Reddy
Formerly Chief Technical Advisor – WMO/UN & Expert – FAO/UN Fellow, Telangana Academy of Sciences [Founder Member] Convenor, Forum for a Sustainable Environment Hyderabad, TS, India.
*Corresponding Author: S. Jeevananda Reddy, Formerly Chief Technical Advisor – WMO/UN & Expert – FAO/UN Fellow, Telangana Academy of Sciences [Founder Member] Convenor, Forum for a Sustainable Environment Hyderabad, TS, India.
Received: July 07, 2021
Accepted: July 14, 2021
Published: July 20, 2021
Citation: S. Jeevananda Reddy. (2021) “Pollution is the “HALL MARK” of Global Warming.”, Aditum Journal of Clinical and Biomedical Research, 2(5); DOI: http;//doi.org/07.2021/1.1044.
Copyright: © 2021 S. Jeevananda Reddy. This is an open access article distributed under the Creative Commons Attribution License, which permits unrestricted use, distribution, and reproduction in any medium, provided the original work is properly Cited.
On the one hand UN & IPCC postulating on global warming and its impact on nature and on the other with the progression of time, new theories are emerging on the sources of greenhouse gases emission. Also, hundreds and thousands of reports a new norm on hypothetical “climate risk” related issues. Most of them were attributed to global warming-carbon dioxide; but so far there is no scientifically defined value for “climate sensitivity factor” that links them and thus used “trial and error process” and arrived at wide-range of values. Same is the case with trend in surface and satellite data series. That is to say, “no unique value for the so-called global warming and thus they used the word climate change instead of the word global warming”. The major source of carbon dioxide is looked at fossil fuel use but now it appears fossil fuel concept is replaced by Water. Rivers, Reservoirs, Hydro-power Plants that comes under water, though they drastically bring down the temperature – we all know the lake-breeze concept, while solar-wind systems raise the temperature and advection plays the major role. Same is the case with transport vehicles. With improved vehicle & fuel technologies, it is safer over the electric vehicles that generate large quantity of toxic battery waste. The whole lot of exercises by UN Agencies appears to be to show that there is a danger of carbon dioxide increase in the atmosphere through fossil fuel use with long life and to save the world from it needs contributions for “Green Fund Basket of $100 billion per year for five years”. However, we are increasing air, water, food/nutrition pollution in the process of bringing down carbon dioxide a non-pollution entity; we are neglecting natural variability in climate parameters & natural disaster events and pollution free traditional agriculture systems, etc. Why young activists/NGOs are not showing interest on pollution that directly affect the mankind in several ways is a big question? The answer is there is no green fund!!!
1. Introduction:
There is a spurt in reports relating to climate crisis with the so-called raising global average temperature. However, we must keep in mind the fact that this average is not global warming, but global warming is only a part of the trend. Also, major part of the trend is associated with human induced through adjusting historical temperature data series. Based on the adjustments several trends are in circulating in the media based on the individual groups’ quantity & quality of adjustments incorporated to the original data. US raw data showed no trend but presented natural variability of 60-year cycle (Reddy, 2016). In addition to surface data series, satellite data series are also created, though they are better in terms spatial coverage, but they also followed surface data correction pattern. So far nobody has come up “which data series are reliable”. In addition to these observed data series, several groups are working on model predicted trends by spending huge sums along with huge power consumption are far beyond the reality. With this type of information, groups are coming up with sensational reports relating to impacts. The latest some such reports are presented and discussed for their validity. In this connection also discussed the latest Draft UN Report [23rd June 2021].
2. Draft UN Report:
The draft UN Report of 23rd June 2021 appears to be qualitative in nature with hypothetical-heuristic projections and with the associated inferences, with the limit being the sky. Carbon dioxide is termed as “pollution”. The important point is “pollution” has no cumulative impact and has life for one day only; while “greenhouse gases like carbon dioxide” has long life and accumulates over long period of time and thus not a pollution. We inhale air and use oxygen and release carbon dioxide into the atmosphere.” Also, in the case of coastal zones global warming groups have been mixing local-regional environmental issues that are associated with human activities with the global warming. Same is the case with heat waves and cyclonic activity (Reddy, 2019a).
WMO, IPCC & UNFCCC defined climate change wherein global warming is not climate change. Climate change is a vast subject and global warming is only a small component of climate change. Also, global warming is not global in nature but average of wide-ranging local conditions around the world which are affected by natural variability in climate, climate systems, general circulation patterns, etc. which are clearly evident in Indian temperature regime (Reddy, 2020a). In the last three years we have been seeing in USA how the “Jet Stream” played havoc through rapid shift in warm and cold zones – north to south, east to west and vice-versa. They are normal to that zone of USA. With all these, UN agencies are more worried on getting contributions to Green Fund for sharing. Now they are worried on hydro-power share going up. India’s share is already around 25% of total power generation. Now with the new Hydro-power plan China may cross 50% of its total power generation and so is the case with Brazil. So, now they are talking on they produce more greenhouse gases.
The entire draft UN Report runs around global warming, a fictitious word as it is an average of temperature around the world under local existing conditions that have no role at global level.
The draft report claims that there are at least four main takeaways, which may be subject to minor changes in the coming months as the IPCC shifts its focus to a key executive summary for policymakers. The first is that with 1.1oC of warming clocked so far, the climate is already changing. A decade ago, scientists believed that limiting global warming to 2.0oC above mid-19th century levels would be enough to safeguard our future. That goal is enshrined in the 2015 Paris Agreement, adopted by nearly 200 nations who vowed to collectively cap warming at "well below" 2.0oC — and 1.5oC if possible. On current trends, we're heading for 3.0oC at best. Earlier models predicted we were not likely to see Earth-altering climate change before 2100. However, the fact is that under linear trend the global warming component is only 0.45oC by 2100 from 1951 [Reddy, 2008, 2016 & 2019a]. Also, countries signed Paris Agreement in 2015 with a fond hope to get share in Green Fund!!!
Crushing climate impacts to hit sooner than feared
The report details the sobering consequences of humanity's greenhouse gas “pollution”. Climate change will fundamentally reshape life on the Earth in the coming decades, even if humans can tame planet-warming greenhouse gas emissions. Species extinction, more widespread disease, unliveable heat, ecosystem collapse, cities menaced by rising seas—these and other devastating climate impacts are accelerating and bound to become painfully obvious before a child born today turns 30. But dangerous thresholds are closer than once thought, and dire consequences stemming from decades of unbridled carbon “pollution” are unavoidable in the short term. "The worst is yet to come, affecting our children's and grandchildren's lives much more than our own." In all these pronouncements, there is nothing new, but all these are routinely used heuristic statements by UN Agencies. Greenhouse gases/carbon dioxide is not a pollution but part of air.
Impacts on nature
Climate change is putting many species and ecosystems under severe threat.
Climate change threats to life on the Earth are systemic, interconnected and on a scale unprecedented in human history. Here are some of the report's findings on impacts on nature:
Natural systems: The report warns that after previous drastic climate shocks like the one currently facing the planet, the recovery of ecosystems, food webs and biodiversity took millions of years and involved the emergence of entirely new species. This includes:
Hunger, disease and drought will afflict tens of millions of more people within decades, warns that lays bare the dire human health consequences of a warming planet. Life on the Earth can recover from a drastic climate shift by evolving into new species and creating new ecosystems. Humans cannot.
The UN report warns of the cascading impacts that simultaneous crop failures, falling nutritional value of basic foods, and soaring inflation are likely to have on the world’s most vulnerable people. Depending on how well humans get a handle on carbon emissions and rising temperatures, a child born today could be confronted with multiple climate-related health threats before turning 30, the report shows. The IPCC’s 4,000-page draft report, scheduled for release next year, offers the most comprehensive rundown to date of the impacts of climate change on our planet and our species. It offers a distressing vision of the decades to come malnutrition, water insecurity, pestilence. IPCC warns that unless drastic and immediate action is taken to limit greenhouse gas emissions and keep global temperatures from rising further, life on the Earth is poised for a catastrophic reckoning. It predicts that up to 80 million more people than today will be at risk of hunger by 2050. Across Asia and Africa, 10 million more children than now will suffer from malnutrition and stunting by mid-century, saddling a new generation with life-long health problems – despite greater socio-economic development.
A new report by leading international scientists and presented to the UN reveals 10 important insights on the climate over the last year “that can help drive collective action on the ongoing climate crisis and help build momentum for a successful outcome of this year’s UN Climate Change Conference COP26 in Glasgow in November”. In the 10 New Insights in Climate Science 2020 report, the authors outlined some of 2020’s most important findings within the field of climate science, ranging from the need for aggressive greenhouse gas emission cuts to meet the goals of the Paris Agreement, to the growing use of human rights litigation to catalyse climate action. This year’s top insights in climate science are:
All these are hypothetical-qualitative statements. Climate is dynamic. Climate change was there in the past, is there now and will be there in future. This is beyond human control. We need to adapt to them.
All these runs like a “Detective Novel” but not based on factual information. What people and governments need is to tell them real cause and effect scenario to create appropriate action plans? Unfortunately, this is lacking in UN Report and as well in IPCC 400-page report. Here the major issue relates to natural variability in rainfall, which is location/region specific.
The warming planet expands the habitable zones for mosquitoes and other disease-carrying species. These are nothing to do with global warming and some of them fall from the sky (Reddy, 2019b & c, 2021a, b & c).
In this connection, let us see “Does Global Warming Have a Part to Play?”:
Establishing a direct link between climate change and a specific weather phenomenon can be complicated, experts say, but suggest that global warming can lead to an increase in such events. Some evidence towards that may already be at hand. However, for a heat wave to strike, India Meteorological Department (IMD) says, there has to be prevalence of hot dry air, that is, “there should be a region of warm, dry air and appropriate flow pattern for transporting hot air over the region” -- Reddy & Rao (1978) presented a schematic concept for heat & cold waves in summer & winter, respectively in India. Here the High-Pressure belt hovering over Nagpur area plays the critical role along with other systems over different parts on the way of heat or cold waves --. That, along with an absence of moisture in the upper atmosphere, which enables temperature rise, and a practically cloudless sky provide the recipe for a heat wave. Last but not the least, there has to be “anti-cyclonic flow over the area” which prevents winds from blowing in.
Experts are blaming the heat dome [similar to high pressure belt mentioned above] over North America for this spell of extreme temperature in a region that is hardly used to experiencing such sweltering weather. The latter is being particularly linked to the high death toll in areas where houses are built to trap heat and dwellings are not known to have fans or air-conditioning. It is this kind of cascading effect that can serve to explain how the heat dome is causing such terribly high temperatures. Several factors have to come together for the heat dome effect to come into play. First, of course, are high temperatures. We know that when air heats up, it tends to rise. However, there is a high-pressure zone over Canada that is not letting the hot air rise. Rising hot air generally creates a vacuum that winds from the sea rush in to fill. But in this case a temperature gradient from west to east in the Pacific Ocean is first blowing the hot air eastwards, which then is trapped by northern shifts of the jet stream. Jet streams are currents of cold, fast winds that move high in the atmosphere. This jet stream moves the hot air over north-western North America and, as it is pushed down by the high temperature, heat dome conditions are created.
However, in China to counter summer heat waves and winter cold waves created a system known as Feng Shu, which means “wind and water”. In winter cold winds from the North with yellow pollen. To protect from such winds, they build dwellings by closing the Northern walls or south side of a hill/mountain. In summer the Sun’s Rays from the South create heat wave conditions. To save from the heat, dwellings have a canal to pass in front of the houses filled with water.
Wildfire Ravages Canada Causing 12,000 Lightning Strikes in a Day [4th July 2021]:
The Canadian military was on standby to help evacuate towns and fight more than 170 wildfires fuelled by a record-smashing heatwave and tinder-dry conditions as the government in Ottawa warned of a “long and challenging summer” ahead. At least 174 fires were active in the western province of British Columbia, 78 of them sparked in the last two days, officials said. Most were caused by intense lightning storms. The fires were north of the city of Kamloops, 350 kilometres (220 miles) northeast of Vancouver. A report says 12,000 lightning strikes, roughly, “Many of those lightning strikes were hitting near communities, (as) was seen in the Kamloops area.” While the immediate blame for the scorching heat has been placed on a high-pressure “heat dome” trapping warm air in the region, climate change is making record-setting temperatures more frequent. Three wildfires in drought-hit northern California have scorched nearly 40,000 acres (16,200 hectares), including a popular tourist lake preparing to welcome visitors for the July 4 holiday weekend. Evacuation orders were in place along stretches of Shasta Lake.
3. Do the Hydro-power plants contribute to warming or cooling?
When climate researcher Dailson Bertassoli went to measure greenhouse gas emissions at the Belo Monte hydropower plant in Brazil (Figure 1a) – the Amazon River basin & land-use map is given in Figure 1b, the first thing he noticed was the bubbles. Developers have built hundreds of hydroelectric plants in the Amazon basin to take advantage of the allegedly "green" energy generated by its complex of rivers. But climate researchers now know hydropower is not as good for the environment as once assumed. Though no fossil fuels are burned, the reservoirs release millions of tons of methane and carbon dioxide as vegetation decays underwater. The results to levels prior to the reservoirs being filled, finding a threefold increase in greenhouse gas emissions. "Once you have the flooding of dry land, the organic matter that was trapped in the soil starts to degrade." These were the source of the bubbles. "Instead of a natural river, we now have a reactor that favours the production of methane." Environmental groups protested the loss of the forest that had to be cleared for the site while indigenous groups resisted the loss of flooded land and redirected or siphoned natural river flow. A 2019 study by the Environmental Defence Fund found that some of the world's hydropower plants are carbon sinks -- meaning they take in more carbon through photosynthesis by organisms living in the water than they emit through decomposition.
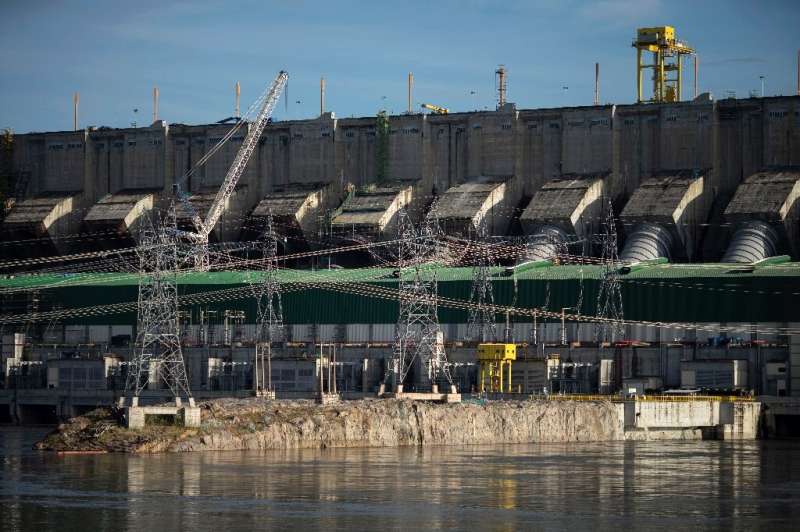
View of the Belo Monte Hydroelectric Power Plant in Altamira, Para State, Brazil.
Figure 1a: Belo Monte Hydropower Plant in Brazil

Figure 1b: Amazon River basin and land use maps
I travelled over northeast Brazil to visit agriculture research centres; and visited Fortaleza [visited gold plated Church] in 1983 but we were not allowed to go near the Amazon forest areas on health hazard grounds. Fortaleza has a long time series of rainfall. The annual average rainfall analysis showed 52-year cycle and its sub-multiples [Reddy, 1984). The same cycle was observed in onset dates of southwest Monsoon over Kerala [Reddy, 1977], around the same latitude of Fortaleza but in the Northern Hemisphere while Fortaleza is in the Southern Hemisphere. This natural cycle in rainfall may have influence on the power production over years.
3.2. Yarlung Tsangpo Dam:
In November of 2020, the Chinese state-owned media announced plans for the construction of a series of new hydro electrical power plants in the foothills of the Himalayas. Billed as potentially the world’s biggest (once complete), the dam is set to be a massive engineering undertaking and a very controversial one too. The Yarlung Tsangpo Dam project will be, it is been announced, a 60-gigawatt mega-dam that may, so it is claimed, bigger than the mighty Three-Gorges Dam. China’s New Yarlung Tsangpo Dam Hydro-power project could dwarf the Three Gorges Dam Hydro-power project – called them as environmental disaster. The selected site is on the Yarlung Tsangpo River (known as the Brahmaputra in India) (Figure 1c), which is one of the world’s highest major rivers.
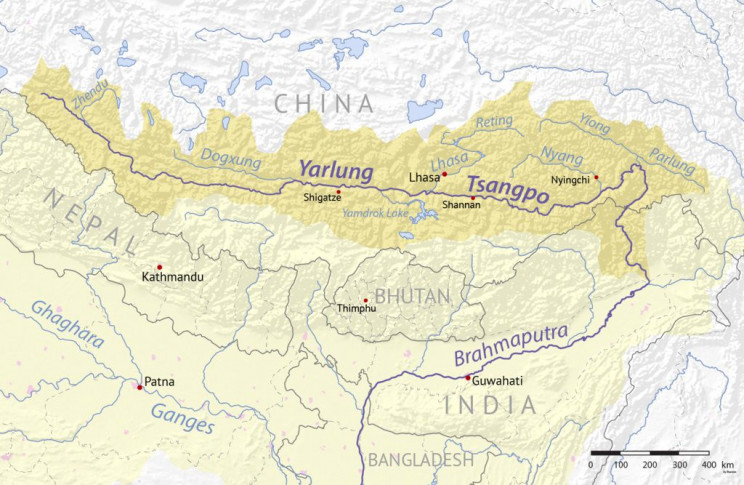
Figure 1c: The Yarlung Tsangpo River (known as the Brahmaputra in India)
From its source in the glaciers of the Manasarovar Lake region of the Tibetan Plateau, the river begins at heights of over 16,404 feet (5km) and snakes its way from west to east through the Himalayan mountain range. The river runs along, roughly speaking, a massive geological rift created by the impact of the Eurasian plate, and cuts through the Tibetan Plateau until it meets the point where the Himalayas, the Nyenchen Tanglha, and Hengduan mountains meet. From here, it pushes its way between the Gyala Peri and Namcha Barwa peaks to form the world’s deepest gorge, then makes its way through Arunachal Pradesh (India) and flows southwest through the Assam Valley in the south through Bangladesh (where it is called the Jamuna) and to the vast Ganges Delta, where it merges with the river Ganges to become the Meghna river, before emptying into the Bay of Bengal. At one point in the river’s course, it plunges some 8.858 feet (2,700 meters) through the Yarlung Tsangpo Grand Canyon, forming an enormous gorge more than twice the depth of the Grand Canyon in the United States. However, I caution them on fluctuations in water availability. Brahmaputra River follows 60-year cycle similar to Chinese & Indian Astrological cycle. This was evident from the Tree Rings study of 1309 to 2004.
The plan is to build eleven hydropower stations on the river. Three of these will be along the middle reaches from Sangri to Gyaca, and the other nine in the gorge up to the Great Bend. In 2010, work started on one of the three planned dams on the Sangri-Gycaca section. What’s more, it is not only China that is interested in building dams on the river. India has also proposed hydropower plants along the Yarlung Tsangpo and its tributaries on a large scale. Public and private proposals include up to 160 huge dams along its course, that should be able to harvest around 57 gigawatts of power in the country’s North-East. Owing to the location, and the project’s proposed scale, the Chinese dams could, in theory, produce as much as three times the power of the Three Gorges dam. Proposals for the project date back to the 1990s, when the government conducted a series of hydropower development surveys of the river. While the Three Gorges Dam required the relocation of around 1.4 million people, the area around the Yarlung Tsangpo is relatively sparsely populated, so the human cost of the proposed dam should be considerably less. It is important to note, however, that the new dam is not the only one on the river. To date, various medium- to small-sized dams are already in place.
Towards the end of the 1990s, the gorge was recognized as the world’s deepest. In the 249 miles (400 kilometers) from the top of the gorge, the river twists around the mountain of Namcha Barwa (known as the Great Bend) and loses more than 6.562 feet (2,000 meters) in altitude, forming several waterfalls and giving up huge energy potential as it goes. “Hydropower experts say a tunnel that cuts the river’s natural loop could carry 2,000 cubic meters of water a second, with a drop in altitude of 9186 feet (2,800 meters) – enough to power a 50-gigawatt hydropower station that could provide 300 billion kilowatt-hours of electricity a year. It would be the largest hydropower project in human history – about three times the size of the Three Gorges Dam.”
However, in 1950s, a magnitude 8.0 earthquake rocked the area, causing many secondary landslides that inundated some parts of the region downstream. In early 2000, another huge landslide at Yi’ong caused the formation of a four billion cubic meter barrier lake. Two months later, the barrier failed, resulting in floods that affected millions of people. From an environmental point-of-view, this area is also likely to be seriously impacted. For example, the effect of long-term climate change on the Tibetan Plateau is currently still something of an unknown quantity. Any perturbation in this supply could have dire consequences for people who rely on this water to survive as the river crosses various international boundaries.
3.3. Three Gorges Dam:
The Three Gorges Dam (Figure 1d) Project (TGP) is one of the world’s biggest hydropower complex projects, located in the Xilingxia Gorge, one of the three gorges of the Yangtze River, in Hubei province, China.
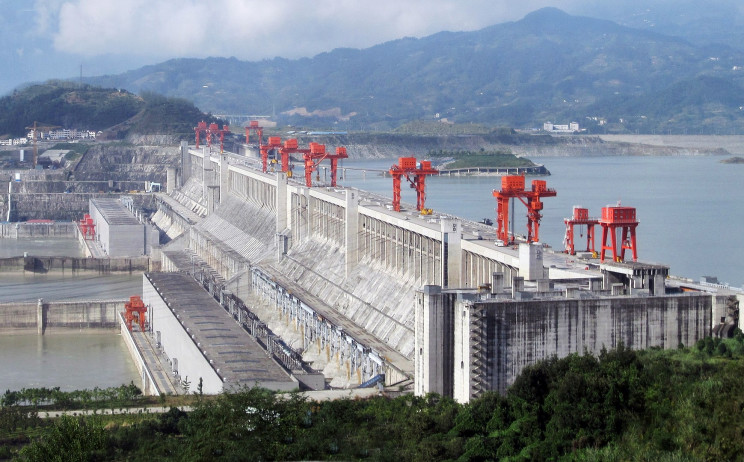
Figure 1d: Three Gorges Dam Hydro Electric Power Plant, China
The gorge controls approximately one million square kilometres of drainage area and averages a runoff of 451 billion cubic metres annually. China Three Gorges Corporation (CTGPC) acts as the legal entity for TGP and is responsible for the construction, operation and financing of the project. Construction on the Three Gorges Dam was completed in 2008. The dam stands 185m tall and 2,309m wide, making it one of the world’s largest hydro plants, well ahead of Brazil’s 12,600MW Itaipu installation. A total of 32 main power generators operate off the dam, which includes 12 sets on the right bank and 14 sets on the left installed in 2006 and 2008 respectively. The generators became operational in October 2008 and generated a total of 18,300MW. Another six generators were added to the underground power plant of the project. The first three became operational in June 2011. The third generator unit (Unit 30) completed a 72-hour test run in July 2011. The first underground unit (Unit 32) began operations in May 2011 and the second (Unit 31) commenced commercial operations in June 2011. In 2012, all 32 hydro units were commissioned to generate a total of 22,500MW output.
The first 14 generators became fully operational in October 2006, generating 9,800MW at a water level of 156m. The first (No.22) of the 12 generators became operational on 11 June 2007 and the final generator (No.15) was brought into operation on 30 October 2008. All 24 generators and two power generators were switched on in June 2009. They produced 16,100MW of power, less than the maximum capacity of 18,300MW. The plant reached its full capacity for a short duration in August 2009 due to elevated upstream water levels and river flow during floods.
The long-term ecological effects of the Three Gorges Dam were described as ‘possibly catastrophic’. The dam will disrupt heavy silt flows in the river and could cause rapid silt build-up in the reservoir, creating an imbalance upstream and depriving agricultural land and fish downstream of essential nutrients. These problems would also hit the plant’s turbines and millions of farmers and fishermen. China referred to the detailed plans as improving the lives of those affected, but residents complained about the resettlement funds and job retraining promises being denied. Farmland that will be flooded is more fertile than the higher ground, and approximately 1,600 factories will be submerged.
With such huge Hydro-power projects there is no way to achieve “zero emissions” in the next few centuries!!!
4. Night temperatures dominates Indian temperature scenario:
Figure 2 [a, b, c, d & e] were taken from http://berkeleyea...ns/india, respectively representing history of temperature measuring met stations, change in mean daily temperature, change in mean maximum daily temperature, change in mean minimum daily temperature and change in mean daily diurnal range in temperature over India.
Average minimum temperature (Figure 2c) showed steep rise. This is associated with urban heat-island effect. The maximum temperature (Figure 2d) up to 1990 showed trough like shape with no increase associated with rural cold-island effect but after 1990 up to 2010 showed an increasing trend and there onwards it presented no change which is around 0.45oC. Figure 2e presents the diurnal range which showed no change up to 1900 and there onwards presented a sharp decline up to 1980 by around 1.35oC. From 1980 onwards showed a rise until around 2010 and there onwards showed a reduction, wherein the difference is 0.45oC. These don’t show the role of global warming process on Indian temperature.
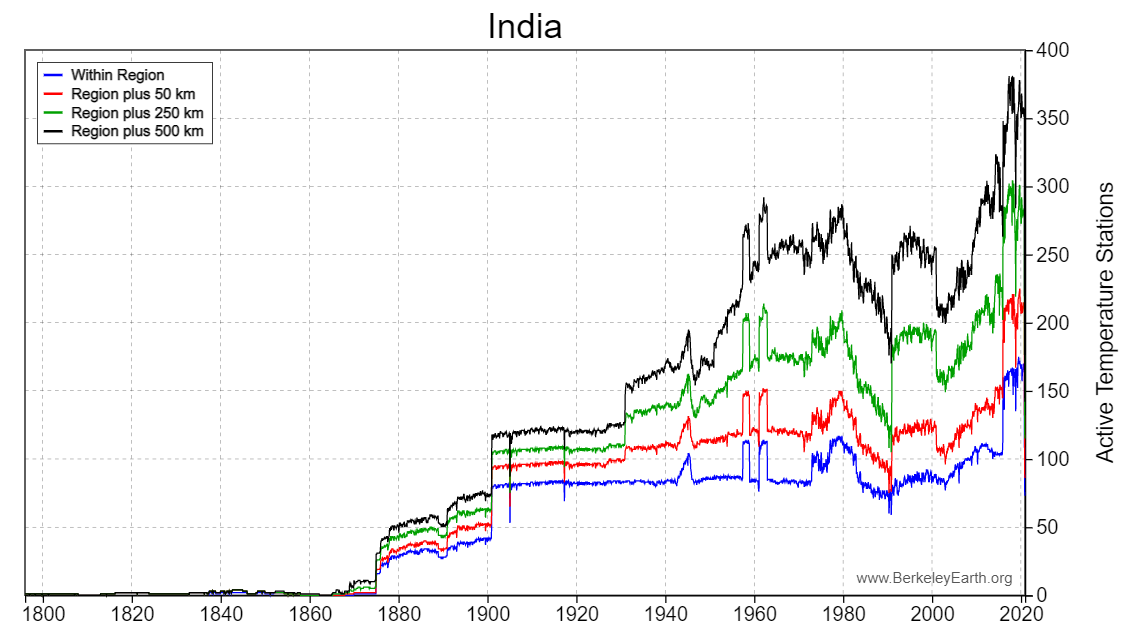
Figure 1a: History of temperature stations in India

Figure 1b: Mean daily temperature of India

Figure 1c: Mean of daily low [minimum] temperature in India
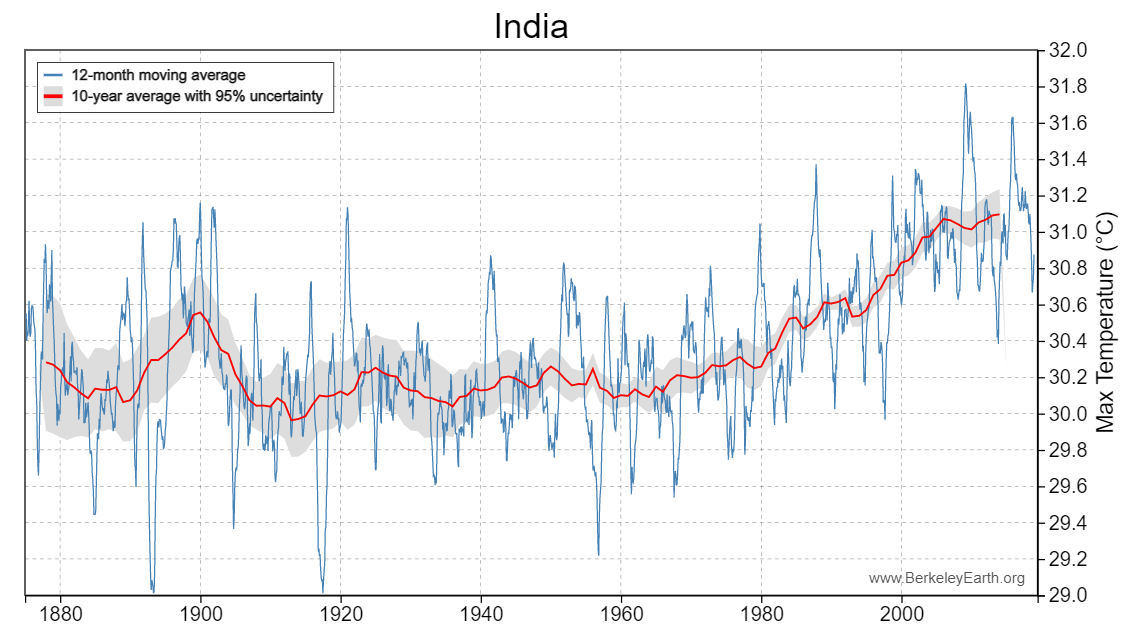
Figure 2d: Mean of daily high [maximum] temperature in India
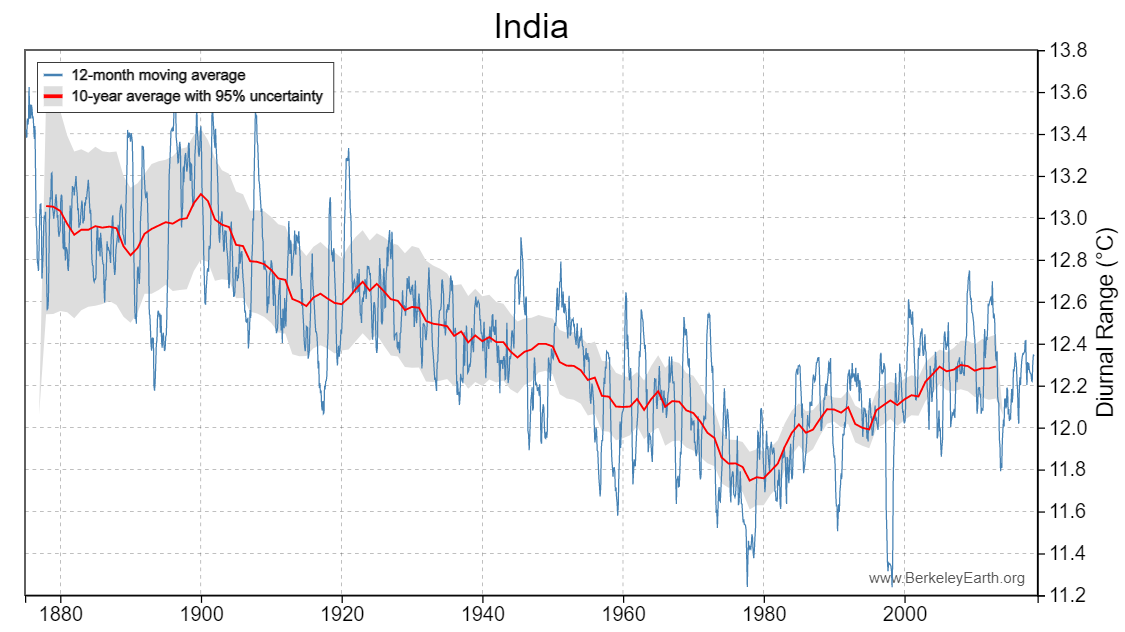
Figure 2e: Change in diurnal daily temperature range in India
Air pollution and associated urban heat-island effect plus cold-island effect with irrigated agriculture and reservoirs that relate to changes in land use pattern and not greenhouse factor. The Hydro-power projects, however, act as “cold-island factor” that bring down the temperature drastically. Unfortunately, such state in climate is not taken in to account while deriving global average temperatures. UN & IPCC must look into such results before making too many hypothetical-qualitative predictions.
5. Discussion of resent reports”
The basic fact of climate change is “The Earth’s climate is dynamic and it is always changing through the natural cycles. What we are experiencing now is part of this system only. It is beyond human control. We need to adapt to them. Our fore fathers adapted to this but the modern man to meet his greed destroyed this system and brought in the new concept of global warming to divert from the real issues that humans are facing as in that also they are the main beneficiaries”. Reports relating global warming issues have been flooding the media as the date for COP26 nearing. Let me present few of them:
A new research on climate change is making clear that while the worst consequences of rising global temperatures may still be years away, the crisis caused by man-made greenhouse gas emissions has already begun.
For years, climate change deniers cast doubt on what they regarded as “doom and gloom” global warming predictions, arguing that forecasting future changes based on an increase in the concentration of carbon dioxide in the Earth’s atmosphere was little more than idle speculation. But with each passing year, global average temperatures have continuing climb, in tandem with carbon dioxide levels measured on the so-called Keeling curve – “The measurements, called the Keeling curve after Charles David Keeling, the scientist who began tracking carbon dioxide there in 1958, is global bench mark for atmospheric carbon levels”. Along the way, another disconcerting reality has come into view: The effects of climate change that were long predicted by scientists are now being witnessed and confirmed by multiple peer-reviewed studies;
As global warming causes more lake heat waves, species threatened, mass fish die-offs predicted
The Earth's surface is splotched with 117 million lakes. Some are scarcely more than ponds, while others are so big they can be seen from space. Lake Baikal in Siberia is one of the World's largest with 395 miles long; 49 miles wide and just over 1 mile deep is home to 2,500 species, including the Baikal seal "Earth's only species of freshwater seal”. Lakes and rivers occupy just 1% of the Earth's surface but are incredible hotspots for biodiversity, sheltering 10% of all species globally. Particularly in older and deeper lakes, life has had millions of years to evolve and adapt to the peculiarities of that habitat, giving rise to unique forms. But since 1970, numbers of freshwater vertebrates, including birds, fish, amphibians, reptiles and mammals, have declined by a staggering 83% through the extraction of lake water, pollution, invasive species and disease.
In a new study researcher examined 393 lakes worldwide between 1981 and 2017 and found their temperatures rose by 0.39°C every decade, while dissolved oxygen fell by 5.5% at the surface and 18.6% in the depths. It's in these cooler, deeper parts of lakes where trout, burbot and salmon usually thrive thanks to sufficient oxygen, especially in the summer. Largely due to warming air temperatures, 68% of the lakes in the study had lost this important niche to rising temperatures and falling oxygen levels.
A study published this week in Nature Climate Change in which researchers from several universities used data collected from 43 countries concluded that 37% of heat-related deaths between 1991 and 2018 can be attributed to climate change.
The study said that the number of people in the U.S. who die annually from heat death caused by climate change is approximately 1,100;
Ice sheets and ocean currents at risk of climate tipping points can destabilise each other as the world heats up, leading to a domino effect with severe consequences for humanity.
Tipping points occur when global heating pushes temperatures beyond a critical threshold, leading to accelerated and irreversible impacts. An example of the complex chain of interactions the researchers tracked is the melting of the Greenland ice sheet. This releases fresh water into the ocean and slows down the AMOC, which is driven partly by dense, salty water being pulled down towards the ocean floor. A weaker AMOC means less heat is transported from the tropics towards the North Pole, which in turn leads to warmer waters in the Southern Ocean. This can then destabilise ice sheets in Antarctica, which pushes up global sea level and causes more melting at the edges of the Greenland ice sheet. However, the chance of a cascade of tipping points leading to a runaway greenhouse effect, where the planet gets ever hotter even if humanity stops carbon emissions is extremely unlikely.
Sea ice across much of the Arctic is thinning twice as fast as previously thought, researchers have found. Arctic ice is melting as the climate crisis drives up temperatures, resulting in a vicious circle in which more dark water is exposed to the sun’s heat, leading to even more heating of the planet. The faster ice loss means the shorter north-eastern shipping passage from China to Europe will become easier to navigate, but it also means new oil and gas extraction is more feasible.
Calculating the thickness of sea ice from satellite radar data is difficult because the amount of snow cover on top varies significantly. Until now, the snow data used came from measurements by Soviet expeditions on ice floes between 1954 and 1991. But the climate crisis has drastically changed the Arctic, meaning this information is out of date. The new research used novel computer models to produce detailed snow cover estimates from 2002 to 2018. The models tracked temperature, snowfall and ice floe movement to assess the accumulation of snow. Using this data to calculate sea ice thickness showed it is thinning twice as fast as previously estimated in the seas around the central Arctic, which make up the bulk of the polar region.
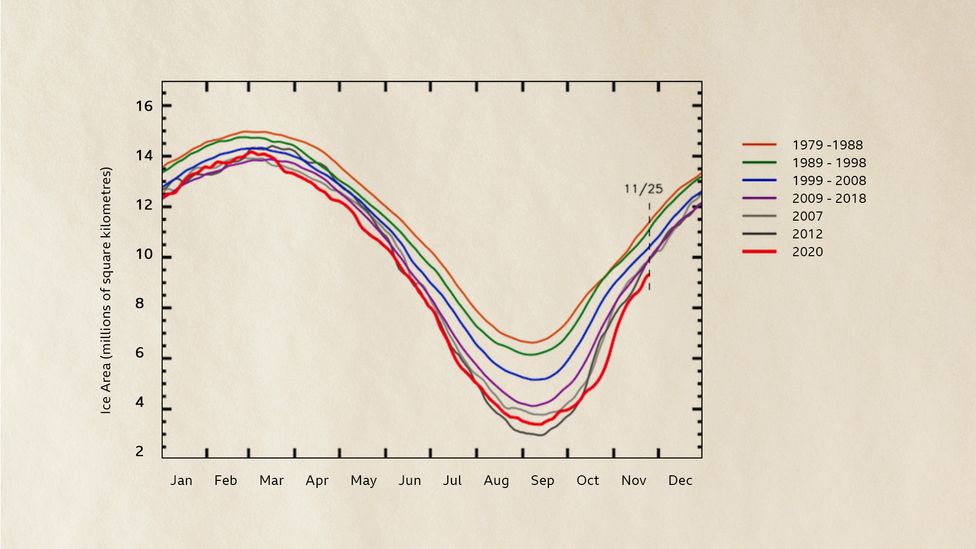
The Arctic sea ice has been diminishing rapidly since detailed records began in the 1970s, in a feedback cycle of warming and melting (Credit: NSIDC/BBC)
Figure 3: Seasonal variation in Arctic Sea ice under different years/periods
Figure 3 presents the seasonal March of Arctic Sea ice. Maximum and minimum are reached in March and September, respectively. That means summer melting is compensated in winter and thus no contribution to ocean waters rise or fall except seasonal changes and natural cyclic variation as seen in temperature. The difference between years/period of years is very small in March [no human activity impact] compared to September [human activity impact]. It is nothing to do with global warming but presents a change in seasonal variation & associated human impact. However, in the Antarctica this is opposite.
According to NOAA, the frequency and damage costs of major weather events have been increasing as global temperatures continue to rise.
2020 set a new record for events, with 22 billion-dollar weather and climate disasters — shattering the previous annual record of 16 events in 2011 and 2017. 2020 was the sixth consecutive year in which 10 or more billion-dollar disaster events occurred in the U.S. There were 13 severe storms, seven tropical cyclones, one drought, and one wildfire event in 2020, for a total cost of $95 billion. These events resulted in the deaths of 262 people. A study published in May by Nature Communication found that $8 billion in damages during Hurricane Sandy in 2012 was attributable to an increased storm surge that resulted from climate change. In March, the reinsurance firm Swiss Re Institute released a report detailing the mounting economic costs of the climate crisis.
2020 will be remembered for the global health and economic crisis triggered by the COVID-19 pandemic. But while COVID-19 was a stress test for society and the economy, it has an expiry date — climate change does not. In fact, climate change is already becoming visible in more frequent occurrences of secondary perils such as flash floods, droughts and forest fires. Natural disaster risks are increasing, and climate change will significantly exacerbate them. This underlines the urgency to better protect our communities against catastrophic losses while dramatically reducing carbon emissions. Unless mitigating measures are taken, such as greening the global economic recovery, the cost to society will increase in the future.
A study published in April 2021 in the Journal of Nature found that the majority of the world’s glaciers were melting faster thanks to climate change.
As a result, roughly 328 billion tons of meltwater was being added to the world's oceans each year. While annual sea-level rise continues to be measured in millimetres, the trend line is going in a worrisome direction. Already, coastal communities in the U.S. have been forced to make hard choices about relocating residents or building extensive barriers to try to keep the ocean from encroaching further. Should the deterioration of the Thwaites Glacier continue, those responses would quickly become inadequate.
The footprints of climate change are evident in the Himalayan and Karakoram mountain ranges.
Increased glacial melt, hazardous events, changes in snowfall patterns are all combining to alter the water supplies of downstream countries which depend on rivers emerging from the Himalayan and Karakoram mountain ranges. New research released in the journal SCIENCE, emphasizes that total glacier melt, and seasonality of flow are projected to increase until the 2050s, with some exceptions and large uncertainties. Glacier meltwater, and climate change impacts on glaciers, are more crucial for the Indus basin in comparison to the Ganges and Brahmaputra basins which are predominantly fed by monsoon rains. The climate impacts on these two river basins are more due to the changing rainfall patterns. Among the knowledge gaps researchers identified is a lack of accurate representations of glacier volumes, a detailed understanding of precipitation gradients in the region, and critical studies on permafrost, sublimation, glacier dynamics, and black carbon; and the role of debris cover. The Himalayan-Karakoram river basins cover an area of 2.75 million sq. km and have the largest irrigated area of 577,000 sq. km, feeding five megacities — Delhi, Dhaka, Karachi, Kolkata and Lahore — with populations greater than 94 million, and the world’s largest installed hydropower capacity of 26,432 MW. While climate change is causing rapid deglaciation and altering the river stream flows in the Himalaya-Karakoram ranges, it is also contributing to mountain hazards happening more frequently, and the greater magnitude of the latest Chamoli disaster is an argument in favour of avoiding further developments in the fragile mountains of the Himalaya.
The World Bank reports that black carbon deposits due to human activities are accelerating glaciers and snow melt in the fragile Himalayan ranges and are changing temperatures and precipitation patterns. Recent evidence suggests that in addition to changing temperatures and precipitation patterns, anthropogenic black carbon (BC) deposits — soot — are further accelerating glacier and snow melt in these mountain ranges. On June 7, 2021 a new study states that “will soon be helping in the accurate estimation of black carbon over the Himalayas, which is a key contributor to global warming and improvement in the weather and climate predictions.” The researchers have derived the values of MAC, an essential parameter that is used for obtaining Black Carbon mass concentrations have calculated the annual mean value of MAC (5.03 ± 0.03 m2 g- 1 at 880 nm) and found it to be significantly lower than the constant value (16.6 m2 g- 1 at 880 nm) used earlier. Whether it is accurate or not, here the basic question is, will this go against Jet Stream prevailing in this zone? Western Disturbances [heat waves in summer and cold waves in winter] will counteract and also, it is reported that this diverted towards Delhi.
Deadly rock-and-ice avalanche in Himalayas could be ‘precursor’ to more climate havoc [Vishwam Sankaran, 11 June, 2021]: An avalanche of rock and ice set off the chain of events that severely damaged two hydropower plants and left more than 200 people dead or missing in Uttarkhand, India in February, according to a new study. While earlier research had ruled that the disaster was caused by a massive rockslide, dismissing speculation that it was triggered by a glacial lake bursting. According to an international team of over 50 scientists the findings highlight the increasing risks to people in the Himalayas due to both global warming and ever-increasing development projects. The results of their analysis, published in the journal Science, revealed that a massive avalanche containing nearly 27 million cubic metres of rock and ice, weighing about 60 million tonnes, cascaded down the steep northern face of Ronti Peak on 7 February just before dawn, triggering massive flash floods in the region. While several factors are linked to the rock and ice breaking off in the first place, scientists say the role of climate change cannot be ruled out. Based on the study, the scientists caution that large-scale development in such mountainous regions of the world, such as hydroelectric power projects, must account for current and future social and environmental conditions while mitigating risks to infrastructure, personnel and downstream communities. Here they speculated on the role of global warming. In fact in the past two decades recorded heavy snow fall that helped cooling the temperature. Construction of dams in fragile area and sometimes heavy down pours disasters occur. We don’t look at it as we are interested to support greedy.
With the risk of wildfires growing with every passing day in states like California, which receives only minimal precipitation during the summer months, temperatures last week continued to trend 3 to 6 degrees above normal.
While wildfires are a natural part of California’s landscape, the fire season in California and across the West is starting earlier and ending later each year”. Change is considered a key driver of this trend. Warmer spring and summer temperatures, reduced snowpack and earlier spring snowmelt create longer and more intense dry seasons that increase moisture stress on vegetation and make forests more susceptible to severe wildfire. Hotter, drier conditions driven by climate change are contributing to unparalleled risk of catastrophic wildfire across landscapes. “With continued dry conditions and ever-present climate change, California is facing another difficult and dangerous wildfire year. While the 2018 fire season in California remains the deadliest and most destructive on record, with 97 civilians and six firefighters killed and over 24,000 buildings destroyed, the trend line for the number of acres burned by wildfires in the state continues to rise.
Numerous studies have concluded that warmer temperatures are worsening wildfires in several areas of the world. Research published in September found increased risk of wildfires in the “western U.S. and Canada, southern Europe, Scandinavia and Amazonia,” due in part to drier vegetation resulting from higher global temperatures. “In terms of the trends we’re seeing, in terms of the extent of wildfires, and which have increased eight to ten-fold in the past four decades, that trend is driven by climate change. California and much of the American West face mega-drought brought on by climate change [David Knowles, Senior Editor, 8 June, 2021]: Thanks in part to rising temperatures due to climate change, “extreme” or “exceptional” drought conditions are now occurring in 74% of the state of California, while 72% of the Western U.S. is classified as experiencing “severe” drought, according to data from the U.S. Drought Monitor (Figure 4).
Rapid deforestation puts Pakistan's climate policies in jeopardy [9 June 2021: Pakistan remains largely prone to challenges that have thwarted its efforts to create a climate-friendly government. Of all the challenges, rapid deforestation remains one of the gravest issues faced by the country even today. Pakistan has suffered a significant loss to climate change in two decades from 1998 to 2018, where 9,986 people lost their lives and USD 3.8 billion was reported in economic losses. Pakistan loses 27,000 hectares of natural forest area annually. Since 1947, Pakistan's total forest cover has dropped from 33% to 5% and tree cover in the country was a mere 0.74% of total land area in 2010. In 2020, Pakistan lost 69.2 hectares of tree cover, equal to 19.6 kilotons of carbon dioxide emissions. Dependency on firewood, urbanisation, and commodity-driven demands are leading factors in deforestation. In Pakistan, around 68% depends on firewood, and the other two factors have contributed to 15% of tree cover loss from 2001 to 2019. In 2019, during a case, the Lahore High Court (LHC) observed that Pakistan had the highest deforestation rate in the world.
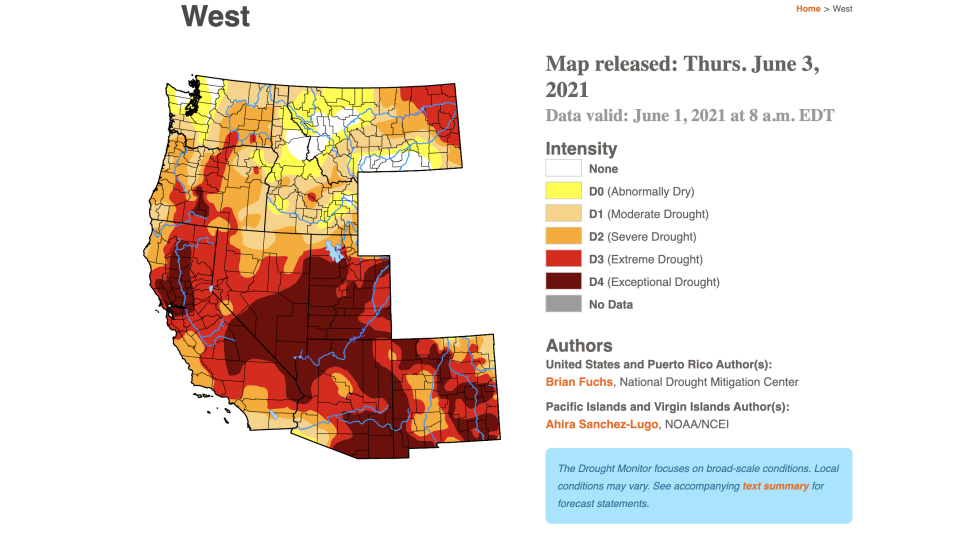
A map provided by the U.S. Drought Monitor shows the extent of severe drought now gripping the Western portion of the country. (U.S. Drought Monitor)
Figure 4: The extent of severe drought [Western USA]
Let us see Indian Scenario: Figure 5a presents the number of fire alerts during January 1, 2003 to May 28, 2021. The last four years showed sudden spurt in forest fire alters in India. They are in line with poor governance to meet the vested interests – land grabbers. This is nothing to do with climate. This is so with many countries. During 2009 and 2002 drought years with 0.81 & 0.78 of average annual rainfall the temperature has gone up by 0.9 & 0.7oC (Figure 6) (Reddy, 2016).
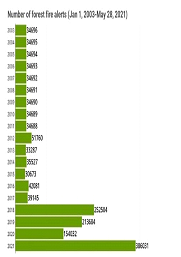
Source: Forest survey of India
Figure 5a: Number of forest fire alerts in India
In the last couple of years, forest fires have destroyed the green cover in Karnataka. Such fire incidents were at their peak in the year 2019 as the Bandipur National Park razing 15,000 acres was ablaze. Belagavi, Chamarajanagar, Mysuru, Kodagu, Dakshina Kannada, Uttara Kannada, and Shivamogga are the worst-hit districts of Karnataka. Mostly these fires are either on ground or are bush fires. Therefore, the ground vegetation is highly affected by it and revives only during the next rain. Forest departments of various districts have no data on the human and animal casualties in such fire incidents.
People believe that, unlike other locations, forest fires in Karnataka are not natural, instead are man-made with ulterior motives. But there are several people who are contributing their bit in reviving the dense forests in the state. A Bengaluru-based entrepreneur’s initiative recently came into the limelight when he converted a 21-acre barren land into a dense forest in 10 years (Figure 5b). He bought the land in Sagar and planned to add forest cover in the region. With assistance from the renowned environmentalist Akhilesh Chipli, the entrepreneur converted the barren land into a forest cover.
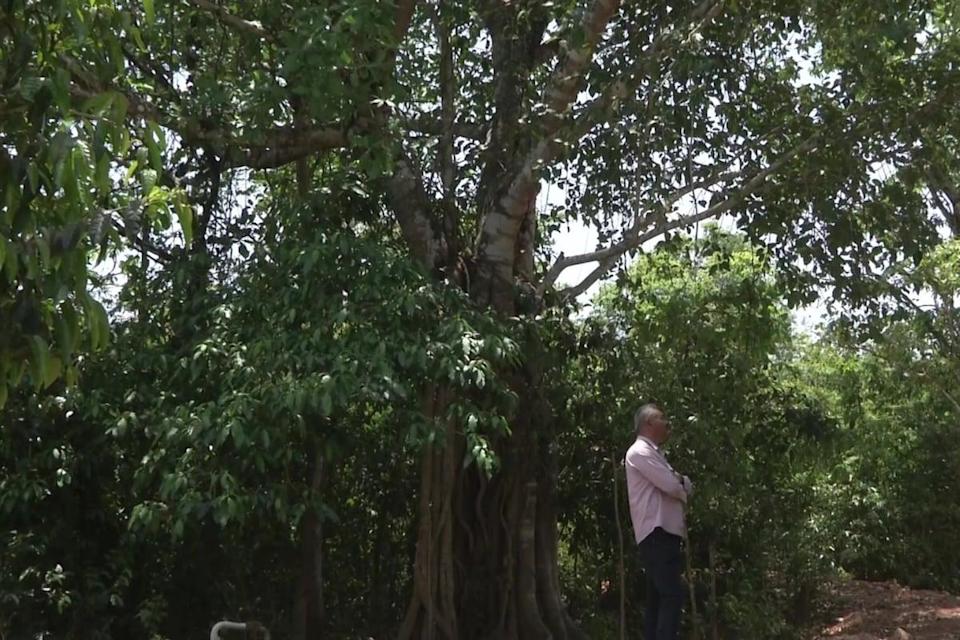
Figure 5b: 21 acres of barren land in to dense forest in Karnataka State in India
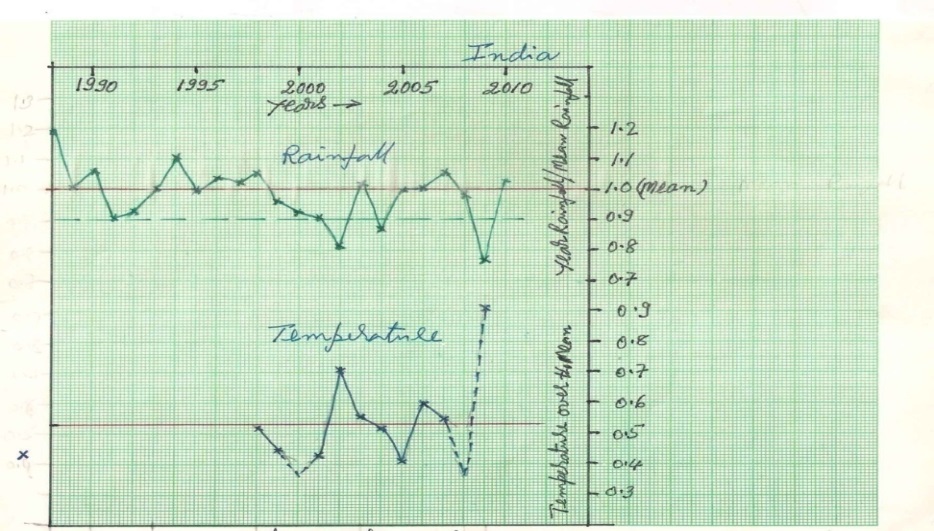
Figure 6: Annual temperature and rainfall march with respect to respective averages
Polish government faces court action over failure to tackle climate crisis [Isabella Kaminski, 10 June 2021].
Five Polish citizens are taking their government to court over its failure to protect them from the impacts of the climate crisis. They say the state has breached their rights to life, health and family life by delaying action to cut national carbon emissions and propping up the coal industry. The first three cases were filed on Thursday in regional courts across Poland by Monika Stasiak, Małgorzata Górska and Piotr Nowakowski. Nowakowski, who lives in a forest in Wielkopolska, is worried that stronger storms and forest fires are increasingly threatening his home and safety. Stasiak and Górska both run tourism businesses in different parts of Poland that have been affected by changing rainfall patterns in very different ways: one has suffered from intensive drought and the other flash flooding.
Ardern says climate crisis is ‘life or death’ as New Zealand landmark report calls for sweeping changes [Tess McClure in Christchurch, 9 June 2021].
New Zealand has been handed a new vision for dramatic reduction of its greenhouse gas emissions – including reduced animal numbers on farms, no new household gas connections by 2025, and a dramatic shift to electric cars in the next decade. The Prime Minister, Jacinda Ardern, said the climate crisis was a matter of “life or death” as she spoke at the release of a new roadmap for the government’s response to global heating.
Banks tested on climate crisis risks [8 June 2021].
Britain's banks and insurers will be tested on how well-prepared they are to cope with climate change emergencies. The Bank of England will examine the risks rising temperatures and sea levels could pose for the UK's big banks and insurers. It will put 19 firms through stress tests involving three climate scenarios projected over the next 30 years. The Bank said the tests will help it "understand the risks presented by climate change" to the economy. Banks will be tested for the first time and assessed on their credit books. They were due to be tested last year but the Bank of England put the process on hold during the pandemic. Insurers will be assessed on the risks to their assets and liabilities but were tested last year.
From all these reports it is clear that the word “climate change” is used as de-facto global warming and they are shy of using the word “global warming”.
They presume that there is global warming and thus said effect. None of them really studied on reality of global warming in terms of the local variations for which their studies were made. In fact, the projects based on surface data and satellite data by different groups are quite different. Then which data they are using is another big question. However, the important point is for local issues “global” warming is used. In fact, for local issues local temperature must be used. However, the basic objective of all these can be understood from the below report.
We can smell the rat “Rich countries falling short on vow to help poorer ones.
Rich countries are falling behind on their pledges to help the poor world tackle the climate crisis, new research has shown, on the eve of a meeting of the finance ministers of the G7 industrialised economies. Care found, in a report called Hollow Commitments: An Analysis of developed countries’ climate finance plans, that most G7 countries have still made no new commitments on climate finance, despite a pledge by the developed world made in 2009 to provide $100bn (£70bn) a year to developing countries by 2020, which has not been met.”
All hot air: UK commits to climate action but not to new funding [Fiona Harvey & Toby Helm, 13 June, 2021: Boris Johnson has set out his intention to “build back better for the world”, to protect the natural environment and wildlife, and tackle the climate crisis, at the G7 summit in Cornwall. But he committed no new funds to the initiative, and other G7 leaders showed little sign of coming forward with the cash commitments that campaigners said were needed to help developing countries cope with the climate emergency.
The G7 summit was intended to be an important staging post on the way to vital UN climate talks later this year, called COP26, to be hosted by Johnson in Glasgow. The world’s wealthiest democracies – the UK, the US, Japan, Canada, Germany, France, Italy and the EU – reaffirmed their intention of holding global heating to no more than 1.5C. Along with their commitments on emissions, they were also expected to increase financial assistance to the developing world, to help poor countries cut their greenhouse gas emissions and cope with the impacts of extreme weather. They said the “build back better” plan was vague and little more than a label, containing few concrete measures. Green laid the blame for the failure to announce new finance squarely on the government’s decision to slash overseas aid, which has taken the pressure off other countries to come up with new finance for the developing world.
6. Extremes Weather: Natural or Manmade:
As part of misinformation campaign “Scientists have warned for years that a warming planet would cause more extreme storms”. If global warming continues unchecked, summer monsoon rainfall in India will become stronger and more erratic. This is the central finding of an analysis by a team of German researchers that compared more than 30 state-of-the-art climate models from all around the world. The study predicts more extremely wet years in the future - with potentially grave consequences for more than one billion people's well-being, economy, food systems and agriculture”.
Climate change leads to higher chance of floods, extreme rainfall [13 June, 2021, London/UK]: During a recent study, climate experts at the Newcastle University found that, without urgent action, climate change will continue to cause an increase in the intensity of extreme rainfall that might lead to severe flooding. An international research team has concluded that increases in extreme rainfall and associated flooding are projected to continue as global temperatures continue to rise. Efforts to limit warming to +1.5C will help limit changes in extreme rainfall, though some societal adaptations will still be required -- a new Science Brief Review, published on 7 June 2021.
Such reports have been appearing daily in media with little basic science. These are not based on realistic studies, but inferences are made from the air without analysing historical facts published around the world by meteorological departments and researchers. In fact, I collected the data in 70s and found the data series are following natural variability with no trend (Reddy, 1993 [2019a], 2000, 2002 & 2008). Let me present few facts to explain this.
Recently scientific groups studied tree rings for 7 centuries [1309-2004] to characterize water flows in Brahmaputra River. They identified two dry periods. They coincided with dry periods in all-India annual rainfall (Figure 7a). 1985 to 2014 the data was taken from Central Water Commission (CWC) and before that from IITM/Pune booklet. In this figure we can see two 60-year cycles completed and the third cycle started in 1987/88 [starting 30-year period is above the average. Two dry periods identified in tree rings were those seen the dry 30-year periods in the 2nd cycle and prior to start of 1st cycle. Also, Godavari River water flows also followed this 60-year cycle pattern (Figure 7b). The data was taken from Bachawat Tribunal.
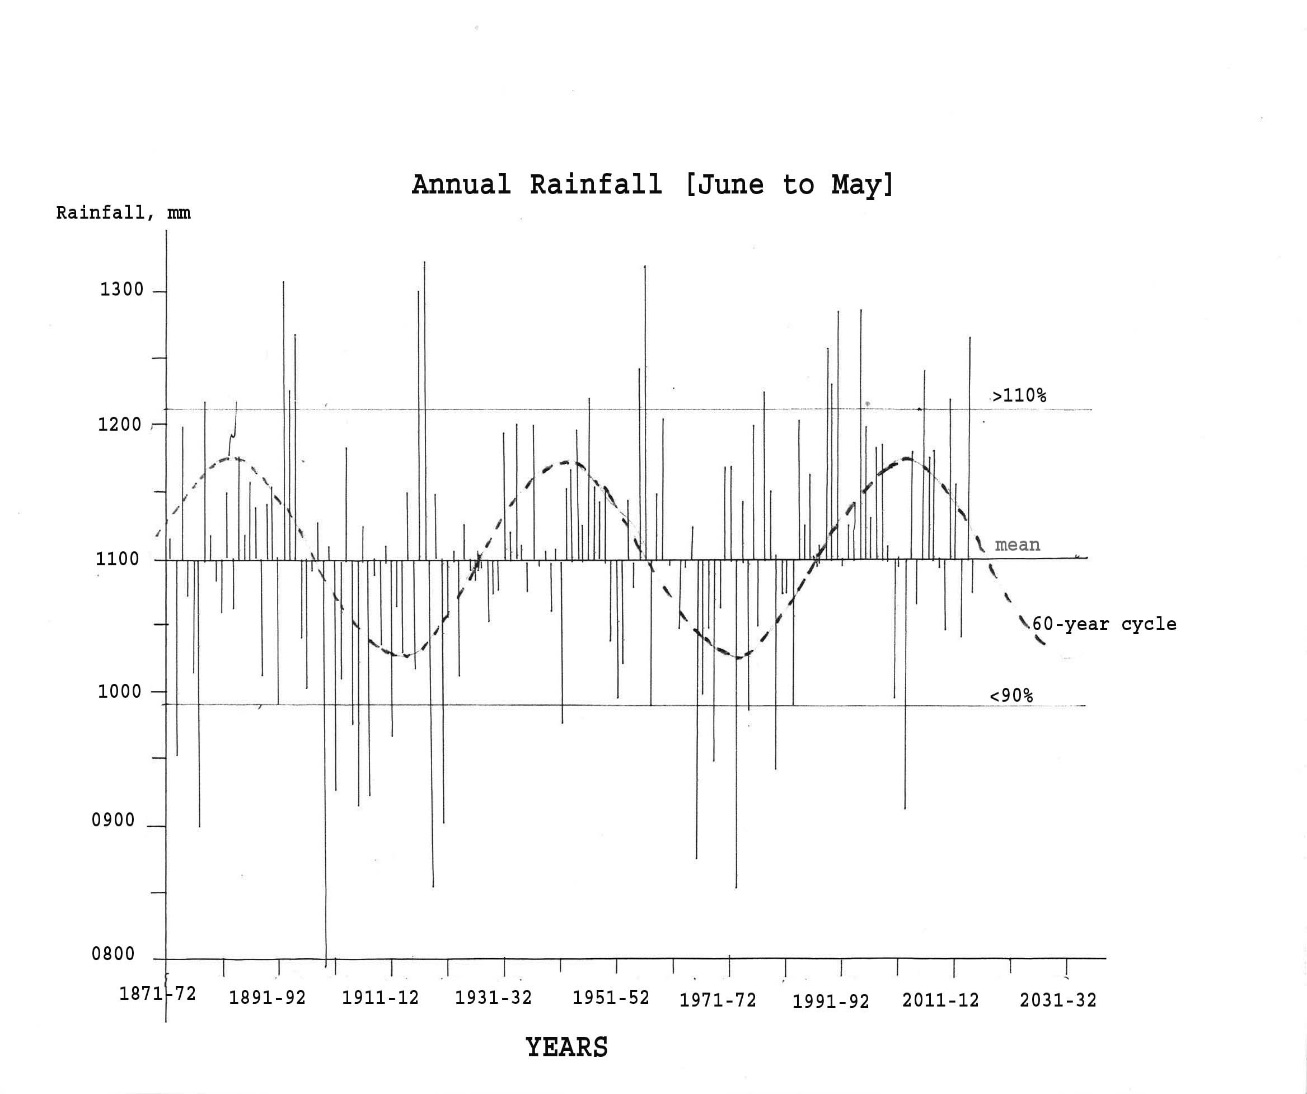
Figure 7a: All-India Annual Rainfall time series
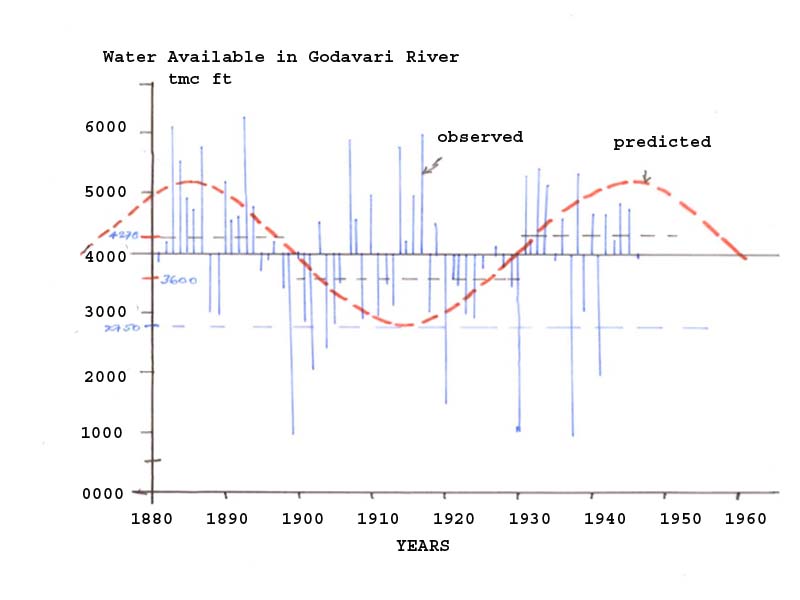
Figure 7b: Water availability in Godavari River time series [Bachawat Tribunal data]
WMO reports on 2nd June 2021 that last La Nina cycle ended in May 2021, taking its cooling effects with it and predicting warmer temperatures would follow in the northern hemisphere. La Nina refers to the large-scale cooling of surface temperatures in the central and eastern equatorial Pacific Ocean, occurring every two to seven years. "La Nina has a temporary global cooling effect, which is typically strongest in the second year of the event. This means that 2021 has got off to a relatively cool start "by recent standards". The effect has widespread impacts on weather around the world" typically the opposite impacts to the El Nino phenomenon, which has a warming influence on global temperatures. La Nina conditions have been in place since August-September 2020, according to atmospheric and oceanic indicators. The phenomenon appeared to have peaked in October-November as a moderate strength event. La Nina "ended in May" and neutral conditions "meaning neither El Nino nor La Nina being in effect" are likely to dominate the tropical Pacific in the next few months. There is a 78% chance of neutral conditions in the tropical Pacific until July, decreasing to 55 percent by August-October.
But La Nina's temporary global cooling effects were not enough to prevent 2020 from being one of the three warmest years on record. "All naturally-occurring climate events now take place in the context of human-induced climate change, which is increasing global temperatures, exacerbating extreme weather and impacting seasonal rainfall patterns," said the WMO. The WMO said air temperatures over land were forecast to be warmer than average from June to August "over almost the whole northern hemisphere". This is due to the end of La Nina and widespread above average sea-surface temperatures caused by to global warming. "This should not lull us into a false sense of security that there is a pause in climate change." The Mauna Loa Observatory in Hawaii is used as a benchmark reference station for measuring carbon dioxide levels. The monthly average for April was 419.5 parts per million, up from 416.45 ppm in April 2020. Carbon dioxide concentrations remain at record high levels and so will continue to drive global warming. There is a 90% likelihood of at least one year between 2021 and 2025 becoming the warmest on record. This would dislodge 2016 a strong El Nino year.
1 June marks the start of the annual Atlantic hurricane season, which runs until to 30 November. Last year saw a record-breaking Atlantic season, with 30 named tropical storms, including 13 hurricanes and six major hurricanes. WMO spokeswoman Clare Nullis said that another above-normal season is expected this year, given that El Nino, which tends to suppress hurricane activity, is absent. The US National Oceanic and Atmospheric Administration is predicting 13-20 named storms this year, of which between six and 10 could become hurricanes; as many as five of those could become major hurricanes. The 2020 Atlantic storms led to at least 400 fatalities and cost $41 billion in damages.
7. Tip of the Iceberg:
UK climate tsar urges companies to join 'Race to Zero' campaign [Simon Jessop, 3 June 2021] and commit to science-based emissions-reduction targets, ahead of global climate talks in November. To make bold commitments, governments need to know that they will be welcomed and not resisted by business, so we're urging all companies and all investors to join the race to zero campaign ahead of COP26". COP26 will be held in the Scottish city of Glasgow from Nov. 1 to 12. The Race to Zero campaign brings together a coalition of net zero initiatives from across the world under one umbrella, aiming to accelerate action heading into COP26. Representing 708 cities, 24 regions, 2,360 businesses, 163 investors and 624 higher education institutions, its members cover 25% of the world's CO2 emissions, the campaign website showed. Net zero pledges now cover more than 70% of the world's economy. By joining the initiative "a gold standard", businesses would commit to reach net zero emissions across their operations by 2050 at the latest, using science-based targets. These are robust and rigorous targets based on the science that show net zero are not some vague aspiration for a distant point in the future but a concrete plan for the here and now. We're at a critical point in the fight against climate change. A climate action that is not in line with the Paris agreement is simply not enough. With more countries joining the net zero campaign, businesses would ultimately have to shift to greener practices or "fade away. Joining race to zero ahead of COP26 can keep you ahead of the curve and being part of this campaign can save you money by encouraging you to work more efficiently.
In September 2020, four children and two young adults from Portugal filed the first-ever case for climate change in the European Court of Human Rights (ECHR). They moved the court seeking action against 33 European countries, which ‘had not done enough to prevent the impacts of climate change from violating their citizens’ human rights. The case was filed three years after the Portugal wildfires (following which the country experienced record-breaking hot summers) and has already been granted a priority status by ECHR. This case is unique for several reasons. For starters, it is one of the few cases to be fast-tracked by the ECHR, and if the court rules in favour of the Portugal youths, 33 European countries will be legally bound to make deep emission cuts. Secondly, it is one of the few cases that address the cross-border impact of emissions of different countries and can therefore pave the way for international climate laws in future.
An International non-profit organization, “Save the Children”, volunteered to be a third-party intervenor in the case earlier this year.
In recent years, we have seen several climate change cases in court, and many of them have been filed by youths. On April 29, 2021, Germany’s apex court ruled in favour of young activists in a landmark climate case. The ruling stated that certain aspects of the climate protection legislation of the country are unconstitutional because it unfairly places too much burden on the younger generation for the reduction of greenhouse gas emissions. A report stated, “Between 1986 and 2020, 1,727 litigation cases were documented worldwide: 1,308 in the U.S. and 419 in other jurisdictions and regional and international courts. Importantly, more than half of the total recorded cases have been brought since 2015 – After Paris Agreement.” “To date, the majority of cases have been brought against governments, but the number of lawsuits against corporate entities – particularly carbon majors – is on the rise,” the report added. Recently, a Dutch court ordered the Shell group to cut their carbon dioxide emissions by a net 45% by the end of 2030. To reach this decision, the court referred to international treaties like the Paris Agreement on climate change and human rights law to interpret the standard of care. An article published in The Wire claimed that “Even though the agreement doesn’t legally bind the corporations, the court made Shell directly responsible by endorsing the universal status of the Paris Agreement.”
Environment campaigners in Italy are suing the government for failing to sufficiently tackle the climate crisis in what is the first legal action of its kind in the country.
The 203 plaintiffs will submit their lawsuit to Rome’s civil court on 5th June 2021. They want the court to order the government, led by the Prime Minister, Mario Draghi, to adopt more ambitious climate change policies as well as significantly increase its carbon emissions reduction target. “We are asking the court to recognise that the Italian government is not complying with respect to its obligation to protect the population from climatic change and we also want the court to order Italy to set an emissions-reduction target for 2030 that is three times what it is today.” In 2019, Italy set itself a 33% target for carbon emissions reduction by 2030.
These types of suits are frivolous on the name of young by international NGOs financed by vested groups. Sunday Special on page 12 of “The Times of India” dated 6th June 2021 exposed one such case “Is India’s Greta Thunberg a pawn in the hands of an unscrupulous father?” It starts “young climate activist Licypriya Kangujam reinvented herself as oxygen messiah – oxygen relief or façade? --. Her father’s arrest for fraud has raised questions about her Covid fundraising as well as her green credentials – Given awards from dad’s NGO”.
The repeated cyclones that hit both coasts of India the past year are obviously a sign of that. How can disaster management methods cater better to the poor? Here we should not forget the fact that these affect rich and poor.
Most of the international climate change agreements/treaties signed by different countries are not legally binding. How can countries be made more accountable to reduce their emission rates? Instead of harping on this why not ask to bring down the population. Also, new reports say hydro-power projects counter the net zero emission scenario – though they bring down temperature drastically. Then what???
In this nobody talks on the main factor of Science “Climate Sensitivity Factor”. Without this it is futile waste of money & energy except it serves to share the Green Fund.
Courts should ask the petitioner, what is climate change? How the carbon dioxide is going to affect climate? How the global average condition of temperature is going to affect local/regional climate?
9. Summary & conclusions:
The rhetoric by NGOs who get funds/financial assistance makes loose statements such as: “To ensure accountability of rich countries, it is essential that they stand up to their financial commitments — contribute to and replenish the Green Climate Fund, and support technology transfer to the poorer nations. Nations must realise that climate change is affecting everyone and each country: while cyclones ravage one region of the world, wildfires rage in other parts. Nations must understand the enormous cost that they are incurring as a result.
The IPCC points out that 50 million people are at risk of hunger due to changing climate. Millions are affected by extreme weather, and there is an increased toll on countries that already have a high burden of poverty and infectious diseases. Obviously, our disaster management plans must prioritise the poor and the vulnerable. We have to establish more efficient systems and models of predicting weather, climate and disasters.” There is a spurt in international court cases filed by “Young-Turks” with zero knowledge on climate and climate change bread by notorious NGOs. It is a death of “SCIENCE”.
They must accept that “climate change” is a clear and present danger and has to be met collectively -- this is true if we use climate change as climate change but not as de-facto global warming. Climate change was there in the past, there now and will be there in the future. This is beyond human control. We develop adaptive measures instead of harping on begging. In the above para and texts presented above in the article climate change refers to de-facto global warming only, A MISNOMER concept.
Global warming, a fictitious index which has no cause and effect except trial and error process, received wide publicity at huge cost. In fact, population growth linearly related to carbon dioxide (CO2) in the atmosphere since 1960. No nation is concentrating on reducing the population or limiting the population, but they are looking at greenhouse gases (CO2) reduction as they can get a share in green fund. Also, they are not looking at limiting wasteful use of energy/energy conservation technologies.IT sector is the major consumer of energy under inefficient systems.
To minimize greenhouse gases release into the atmosphere proposed renewable energy systems (solar & wind) that generate huge quantity of waste and their life is short-lived. In fact, they directly increase the temperature. Fossil fuel-based energy systems presumed that indirectly increase temperature through CO2. Even hydro-power projects including water storages in Dams are categorized under carbon emitting industry forgetting the fact that they directly contribute to lowering the atmospheric temperature – cooling effect --. Also, to get share in green fund nations are showing increased areas under new forest cover but destroying the native existing biodiversity rich forests. In fact, there is no reliable quantitative value for climate sensitivity factor that links to increase in CO2 in the atmosphere to rise in temperature. However, the energy from the Sun is constant superposed on it the sunspot cycle. Many things such as volcanic activity, earthquakes, cyclonic activity (that has a cyclic pattern), etc. are happening in the nature that are affecting incoming solar radiation and radiation balance at the Earth’s surface and thus temperature; and yet the temperature is shown increasing trend every year (Reddy, 2021d) which is attributed to raise of carbon dioxide in the atmosphere, a false alarm that is creating fictitious global warming. This is linked to climate crisis. Propaganda machine to collect and share billions of dollars “green fund”; and at the same time protecting multinational companies’ interests.
According to the new theory, water is more dangerous than fossil fuels. Water includes rivers, dams & hydro-power plants. Under this scenario will the UN Report or IPCC Report, what purpose they serve. In fact, they serve lowering the temperature wherein Lake Breeze plays an important role; while solar wind increase the temperature wherein advection plays an important role.
Unfortunately, in this “green fund” based propaganda has been mosque the real issues that affect population all over the world, namely pollution [air, water, soil & food], adulteration of food, wastage of food and to that extent inputs used to produce that, etc. There is a need to change the attitude of UN Agencies in this scenario. The UN & IPCC Reports serve nobody except themselves. The fact is among the five coldest places on the Earth, four are in Arctic zone [Denali in Alaska, Klink Research Station in Greenland, Verkhoyask in Russia & Snag Yokon in Canada] and one in Antarctic zone [Dome Fuji in Antarctica]. In China to encounter heat & cold waves as part of Chinese Ancient Astrology, Feng Sue concept was developed.
Acknowledgements:
The author expresses his grateful thanks to those authors whose work was used for the continuity of the story.


Open Access By Aditum Open Access Journals id licensed under Creative Commons Attribution 4.0 International License. Based On a Work at aditum.org