Aditum Journal of Clinical and Biomedical Research
OPEN ACCESS | Volume 8 - Issue 1 - 2026
ISSN No: 2993-9968 | Journal DOI: 10.61148/2993-9968/AJCBR


S.Jeevananda Reddy
Formerly Chief Technical Advisor – WMO/UN & Expert – FAO/UN Fellow, Telangana Academy of Sciences Convenor, Forum for a Sustainable Environment Hyderabad, TS, India.
*Corresponding Author: S.Jeevananda Reddy, Formerly Chief Technical Advisor – WMO/UN & Expert – FAO/UN Fellow, Telangana Academy of Sciences Convenor, Forum for a Sustainable Environment Hyderabad, TS, India.
Received: May 31, 2021
Accepted: June 07, 2021
Published: June 16, 2021
Citation: S.Jeevananda Reddy. (2021) “World Environment Day [WED] – 2021: A Note.”, Aditum Journal of Clinical and Biomedical Research, 2(5); DOI: http;//doi.org/06.2021/1.1046.
Copyright: © 2021 S.Jeevananda Reddy. This is an open access article distributed under the Creative Commons Attribution License, which permits unrestricted use, distribution, and reproduction in any medium, provided the original work is properly Cited.
United Nations ritualistically organizes several Programmes by spending huge sums of dollars, United Nations Environment Programme [UNEP] annually organises one such programme, namely “World Environment Day” with a specified theme. The whole programme runs around post-mortem of events under the given theme. The theme of 2021 is “Ecosystem Restoration”, which includes growing trees, greening cities, rewilding gardens, changing diets, cleaning up rivers and coasts. All these relate to one factor, namely population growth. Its impact under Covid-19 put global economy in to “doldrums”. However, instead of talking this vital issue, United Nations agencies have been running around the bush with zero outcome. Also, at the same time haven’t put emphasis on getting right solution on “climate sensitivity factor” that links the carbon dioxide with temperature.
Introduction:
United Nations organizes several programmes ritualistically every year by spending huge sums of dollars with zero achievements. One such programme is World Environment Day [WED] celebrated on 5th June with a specific theme. United Nations Environment Programme [UNEP] annually organises this event. The theme of WED-2021 is “Ecosystem Restoration”. This is also made UN “Decade on Ecosystem Restoration”. Ecosystem Restoration includes growing trees, greening cities, rewilding gardens, changing diets, cleaning up rivers and coasts – and thus can make “peace with nature”.
However, in reality like the word “Global Warming”, the word “Ecosystem Restoration” is a misnomer. At the most we can do post-mortem only as all these directly and indirectly relates to population. Unfortunately, countries stopped focussing on the theme of controlling population growth but looking at post-mortem actions to pocket funds. This way they are also killing the science. Its impact under Covid-19 put global economy in to “doldrums”. The governments around the world must take a pledge that they control population growth to stop the destruction of ecosystems/nature and make peace with nature. Is UN ready to act on this?
Recent days all over the world, weather and climate is misrepresented to serve the vested interests. Weather extremes were there in the past; they are there now and will be there in future. However, the impact is different basically because of growth in population and accordingly land use changes; sometimes meet the greed of unscrupulous people, more particularly in urban areas. “Peddabala Siksha” a treatise in local language to educate commoners on different issues faced by them is also discusses the weather associated with “Rutuvulu & Karties” and associated health hazards but now the global warming groups started attributing them to global warming. Stan Cox in 2006 in fact brought out a book “Sick Planet: Corporate Food & Health”, that explains the realities related to health hazards. Human greed is creating new health hazards.
Results & Discussion:
Part-I: Ecosystems:
Population change versus carbon dioxide:
Since 1950 the population is growing non-linearly (Figure 1), expected to reach 9.0 billion by 2050. Same is the case with carbon dioxide (Figure 2). Thus, carbon dioxide showed a linear increase with the population growth (Figure 3). People inhale the Air and use oxygen & release carbon dioxide into the Air. India + China population is around 36% of the world’s population [7.7 billion] in 2019. Carbon Dioxide in the Southern Hemisphere [SH] is less than one-third of the Northern Hemisphere [NH] in proportion to land areas.
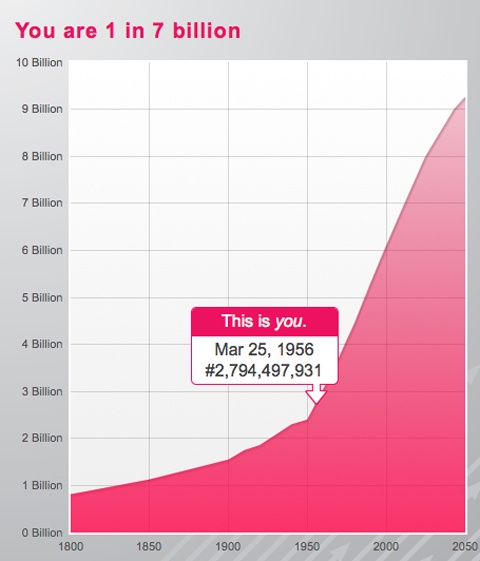
Figure 1: Growth of global population since 1800 to 2100
Growing Trees:
In line with the population, forest cover also showed the changing patterns. Reforestation world over in the past 20 years [2000 to 2019] showed an increase in area of forest cover the size of France, which is around 59 Mha to soak and store carbon dioxide of 5.9 giga tonnes. However, through deforestation 386 Mha of tree cover were last worldwide for timber, agriculture, etc. This is around 7 times to that of reforestation and thus to that extent carbon dioxide entered the atmosphere. Chile issued a decree subsidising tree planting ran from 1974 to 2012. The subsidy scheme expanded the area covered by trees, but decreased the area of native forest, which are rich in biodiversity and store large amounts of carbon. Chine government undertook intensive tree planting in northern Chine to help to reduce dust from the Gobi Desert. Figure 4 shows the global deforestation and reforestation changes with the time. This support the above presented data also.
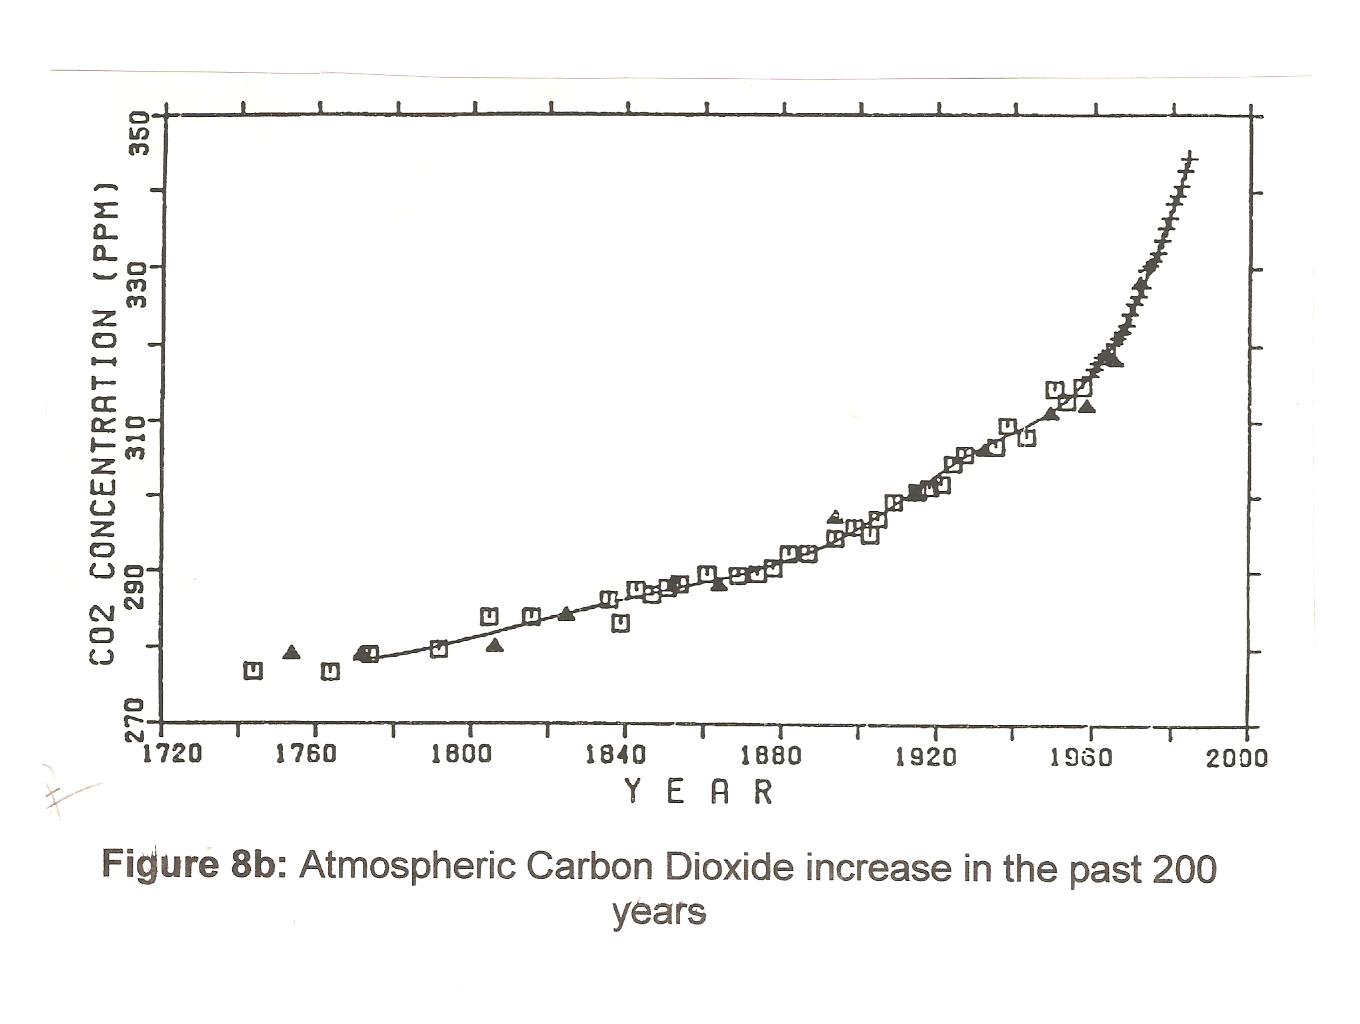
Figure 2: Carbon Dioxide growth in the atmosphere since 1750

Figure 3: Population versus Carbon Dioxide since 1960
Few years back a TV Channel presented live the butchering of pristine forest area with rich biodiversity in AP/TS states in India around 8000 acres, but government failed to take any action on that event. However, TS government initiated massive reforestation programmes in urban areas, rural areas and forest areas but the survival rates are very poor. Such incidents are quite common in India. Also put on fire is another story to grab the forest lands for other commercial activities – this has increased in Nallamala forests, Sheshachalam forests in Andhra Pradesh. These resulted wild animal intruding human habitats causing innumerable problems. I had an opportunity to participate in a TV Channel discussion few years back on the barbaric act of selling wild-animals meat similar to goat meat. It is a known fact that internationally elephant tusks were banned. Other major issues are Ganja cultivation and Mining.
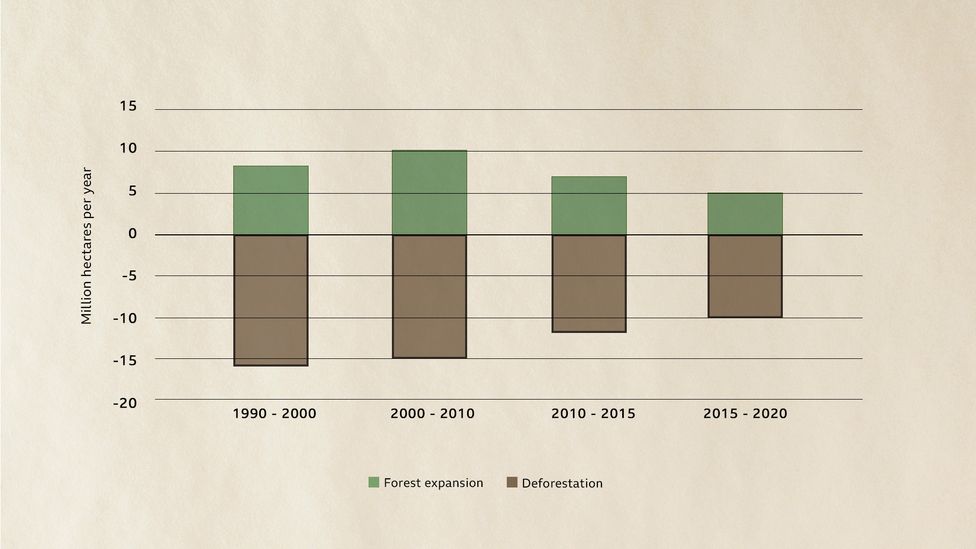
Source: World deforestation rates are slowing slowly overall, but in some of the world's most pristine forests it is still rapid (Credit: FAO/BBC)
Figure 4: Global deforestation and reforestation changes with the time.
The Western Ghats are south India’s lifeline, with millions dependent on the range either directly or indirectly. These mountains need protection. However, while new developments in the region continues to be human-centric, the entire concept of nature preservation is relegated. For real estate ventures the unscrupulous started destroying the Western Ghats too which has several ramifications including rainfall reduction, landslides, flooding, etc. And as the human population has grown, people have chopped down the forests and replaced them with spice, tea, coffee and rubber plantations. Thousands of illegal stone quarries now also operate in the Ghats, where mountainsides are demolished to generate stones and sand for the construction industry. Deforestation and the use of highly destructive explosives mean these areas are prone to increased seismic tremors and landslides.
Greening Cities/Rewilding Gardens:
Age old trees have been butchered for growth of urban areas. The new plantation programmes have no plan and as a result in no time they have been butchered to pay the way for urban growth under new political centric plans. Also, with this huge tree waste is generated. Cleaning this is a major issue; in many cases they were/are burned or dumped into nalas/parks, etc. Builders have been introduced new “Green building Concept” to get higher premium for their ventures/buildings. Whatever may be the case, with urban growth – horizontally & vertically [that consume more power and changes local weather] on the ground and in the air contributing increased levels of carbon dioxide in the atmosphere? Also, they directly contribute to urban-heat-island affect that increases the power consumption and thus more carbon dioxide contribution to environment indirectly.
A report suggests that “Though 93% of cities are conscious of the direct threats they face from climate change, require financing for actions include transport (16% of projects), renewable energy (12%), energy efficiency and renovation (12%) and water management (12%). Unfortunately, 25% of cities cite budgetary capacity issues as a barrier to adaptation through these kinds of actions. Cities that are already consider themselves as resilient -- and which have an action plan in place to deal with the effects of climate change -- include Melbourne, Australia, Buenos Aires, Argentina, Durban, South Africa, Barcelona, Spain and Paris, France. However, all these relate to carbon dioxide only and not realistic factors that affect life & natural ecology/biodiversity aspects.”
Changing Diets:
The process that sustains 7.8 billion people also emits 21-37% of all greenhouse gases a year that can be traced back to human activities. Our food system is thus as polluting – however we must be careful that carbon dioxide is not a pollution but it is air & air pollution has short life [24-hours] don’t have the character of accumulation in the air -- as sectors that generate electricity and heat (25% of greenhouse gases emitted) and industries (21%); it is also more polluting than transportation (14%) and buildings and energy usage (16%). Now, try to gauge the additional emissions as we churn out more to feed 10 billion mouths by 2050. According to the September 2020 UNEP assessment:
Reducing land-use change and conversion of natural habitats alone can lower emissions by 4.6 giga tonnes of carbon dioxide equivalents (GtCO2e) a year;
Reducing food loss and waste, which accounts for 8% of anthropogenic emissions, can cut emissions by 4.5 GtCO2e;
Improving production methods and reducing methane from livestock can lower emissions by up to 1.44 GtCO2e;
A massive 8 GtCO2e reduction is possible by including a higher proportion of plant-based foods in the diet than animal-based foods.
However, combination of improved productivity and reduced waste is sufficient to bring greenhouse gas emissions within the planetary boundary under the “business as usual” dietary scenario. Discourages over-consumption of any food to the extent that it impacts biodiversity, environment and human health, and proposes a shift to more plant-based diets; and reduce consumption of meat-based diets.
A report says some countries are more responsible for the emissions from the food system; most of these are in G20 bloc. The study, Diets for a Better Future, has calculated the food-print of each G20 countries -- Argentina; Australia; Brazil; Canada; China; France; Germany; Italy; India; Indonesia; Japan; Mexico; Republic of Korea; Russia; Saudi Arabia; South Africa; Turkey; United Kingdom; United States; European Union -- and found that the bloc, representing 10% of the countries and 64% [36% by China & India] of the global population, accounts for 75% of the global food-emissions.
Coral Reefs: Australian researchers recently reported a sharp decline in the abundance of coral along the Great Barrier Reef [Figure 5]. Scientists are seeing similar declines in coral colonies throughout the world, including reefs off of Hawaii, the Florida Keys and in the Indo-Pacific region. Though coral reefs take up some of the smallest area on our planet but harbour the most species of any ecosystem on Earth, and they're also incredibly important to people. People all over the world rely on reefs for food security, for coastal protection from storms, and for other livelihoods. In many parts of the world, it isn't only a question of beauty, but a question of survival. Coral reefs are important on a fundamental level for biodiversity.
According to a new study, "Local conditions magnify coral loss after marine heatwaves," published in the journal Science. The widespread decline is fuelled in part by climate-driven heat waves that are warming the world's oceans and leading to what's known as coral bleaching, the breakdown of the mutually beneficial relationship between corals and resident algae. However, they are miniscule when compared to seasonal and annual variations. They co-exist with such conditions for centuries.
Two local issues that can have a large effect on the health of coral reefs are nutrient pollution and overfishing. Overfishing depletes the number of fish that eat algae and keep the reef's ecosystem in balance. For example, depleting the number of herbivorous fish – fresh new seedlings may help to avoid this condition -- can lead to an overabundance of macro-algae, which can indicate a stressed ecosystem. The importance of local conditions to reef survival is often dismissed, making those who rely on coral reefs for their livelihood or those who are stewards of the reefs feel hopeless. Yet, coral reefs are profoundly important. Meanwhile, nutrient pollution from land, including run off from golf courses, agriculture and urban development along coastlines greatly threatens reefs.
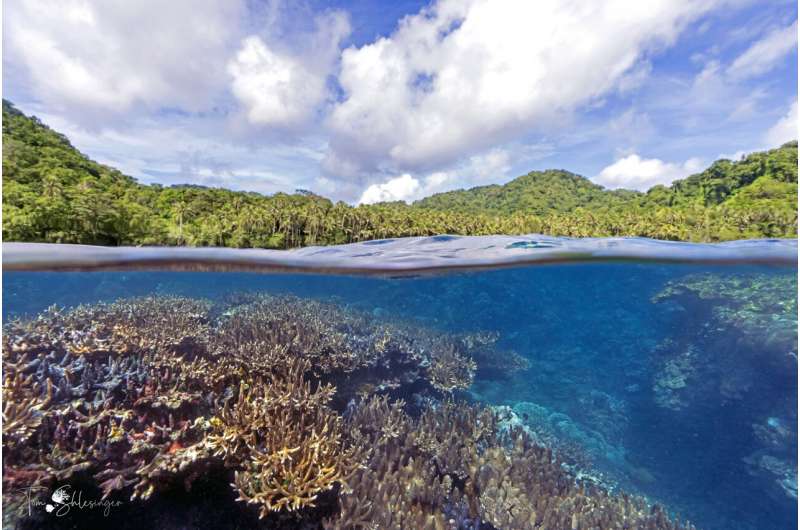
Credit: Tom Schlesinger, Papua New Guinea, 2018
Figure 5: Coral Reefs – a view
Mangroves: Mangroves is one another that act as natural barriers blunting the fury of the cyclonic storms and tidal waves. Apart from East Godavari, mangroves now found only Krishna and Guntur. Some of the last surviving mangroves in the state of AP were destroyed. In September 2007 on the request of Fishermen environmental groups [including myself] visited the site of RIL onshore project (Oil & gas) near Kakinada in West Godavari district. To our astonishment we found creeks were closed and mangroves were uprooted. When we took it up with local Forest Department officials at Kakinada and Rajahmundry, they confirmed the destruction of mangroves and creeks but expressed their helplessness, as it involved “a big and influential company”. Most of the creeks filled up and one of them diverted towards the Coringa Wildlife Sanctuary, posing a grave threat to it. Declared as a sanctuary in 1978, Coringa’s rich mangrove forest ecosystem along the Bay of Bengal is a heaven for flora and fauna. A special feature is the 18-km long sand spit where the endangered Olive Ridley turtle nests.
Here it is not the question of losing mangroves and creeks but the livelihood of hundreds of fishermen. They are worried as the fish catch has come down drastically, also a sure sign of the deterioration of the mangrove ecosystem. Both the Centre and the State Government for the last few years have been emphasising on the need to protect and develop mangroves, especially after the tsunami hit coastal belt. However, even after I sent a complaint to government alleged that the company had not been complying with the conditions laid down in Consent for Establishment order of APPCB & EC of MoEF nobody took action on the industry. However, when government allocated around1000 acres for establishment of power plant by saying that it is barren land, but we found it is mangrove area. On our PIL in Court this was stopped by the government. This is a tip of iceberg. However, governments have been parting such lands to commercial ventures forgetting their importance.
Cleaning up Rivers and Coasts:
Majority of rivers are passing through urban areas. Huge quantity of liquid and solid wastes has been dumping into them and huge sums are allocated to clean them with no improvement except money goes in to the pockets of few criminals. Such water & waste finally reach coastal waters. With growing population, the quantum increases. Though precautionary principle is part of environmental acts, the rulers rarely care to implement it; and instead follow post-mortem actions after getting reports at huge costs. The classical example is the water bodies in Hyderabad city.
However, the major issue is agriculture non-point source water pollution. In USA Mississippi River carry polluted water from agri farms and dump into Gulf of Mexico that became dead zone. The only solution to this is not cleaning but change of chemical input agri technology to organic agri technology. This involves policy action by governments which have several international ramifications.
Dumping of waste both solid and liquid forms is not a scenario of developing countries but is more seen in developed countries. Though UK is holding COP26, it failed to implement the basic rules in pollution angle – a great pity. Water companies have been illegally dumping untreated sewage into rivers in England and Wales, an investigation by BBC Panorama has found.
Recent studies show that the US dumps the highest number of water bottles in the ocean. In fact, studies show that the US contributes as much as 242 million tons of trash in the ocean every year. However, it is undeniable that ocean litter is a mix of garbage from all around the globe. The water bottle could be from Los Angeles, the food container from Manila, the plastic bags from Shanghai. The amount of trash floating in the ocean is just too much for it to bear. The marine ecosystem is now severely polluted by plastic garbage, which comes from different countries, most of which are from Asia. While it’s great that humans are trying to clean up the patch, most of the efforts should instead go toward stopping the out-of-control flow of plastic garbage into the oceans.
It is a general belief that cruise ships simply dump their garbage into the ocean. This is because they are constantly on the move, making waste management and disposal an added challenge to their day to day operations (Reddy, 2013). The other major issue is oil spills.
Part-II: climate related issues:
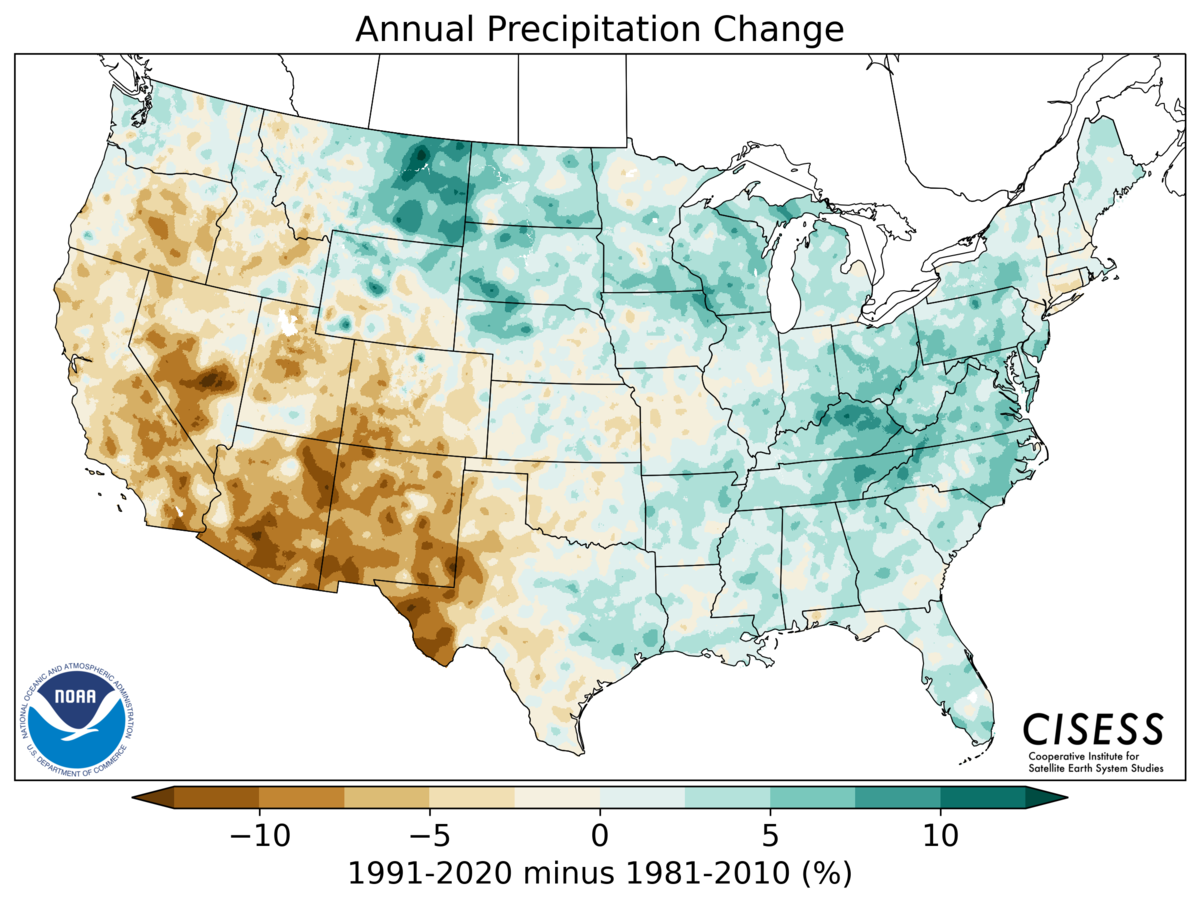
NOAA released new climate Normal for USA in May 2021. Figure 6 presents the (a) annual precipitation change and (b) annual temperature change – change is expressed as 1991-2020 minus 1981-2010 in %. However, the temperature pattern is not in line with precipitation pattern over USA in terms of high and low regions. See for example:
Reddy (1974) observed direct relation between sunshine hours and total cloud cover;
Reddy & Rao (1973) observed doubling of evaporation from 100% relative humidity to < 35% relative humidity;
2002 and 2009 were drought years at all India level with 81% and 78% of the average rainfall and temperature is higher than the average by 0.7 & 0.9oC.
Reddy (1987) found cube root of precipitation related to incoming solar radiation and net radiation over northeast Brazil;
From all these it is clear that rainfall reduces incoming solar radiation and thus temperature – local temperature. All these suggest one thing: wet period brings down temperature and dry period ups the temperature. These are not reflected in the Figure 6. It needs an explanation, why meteorological conditions are not reflected?
[a]
[b]
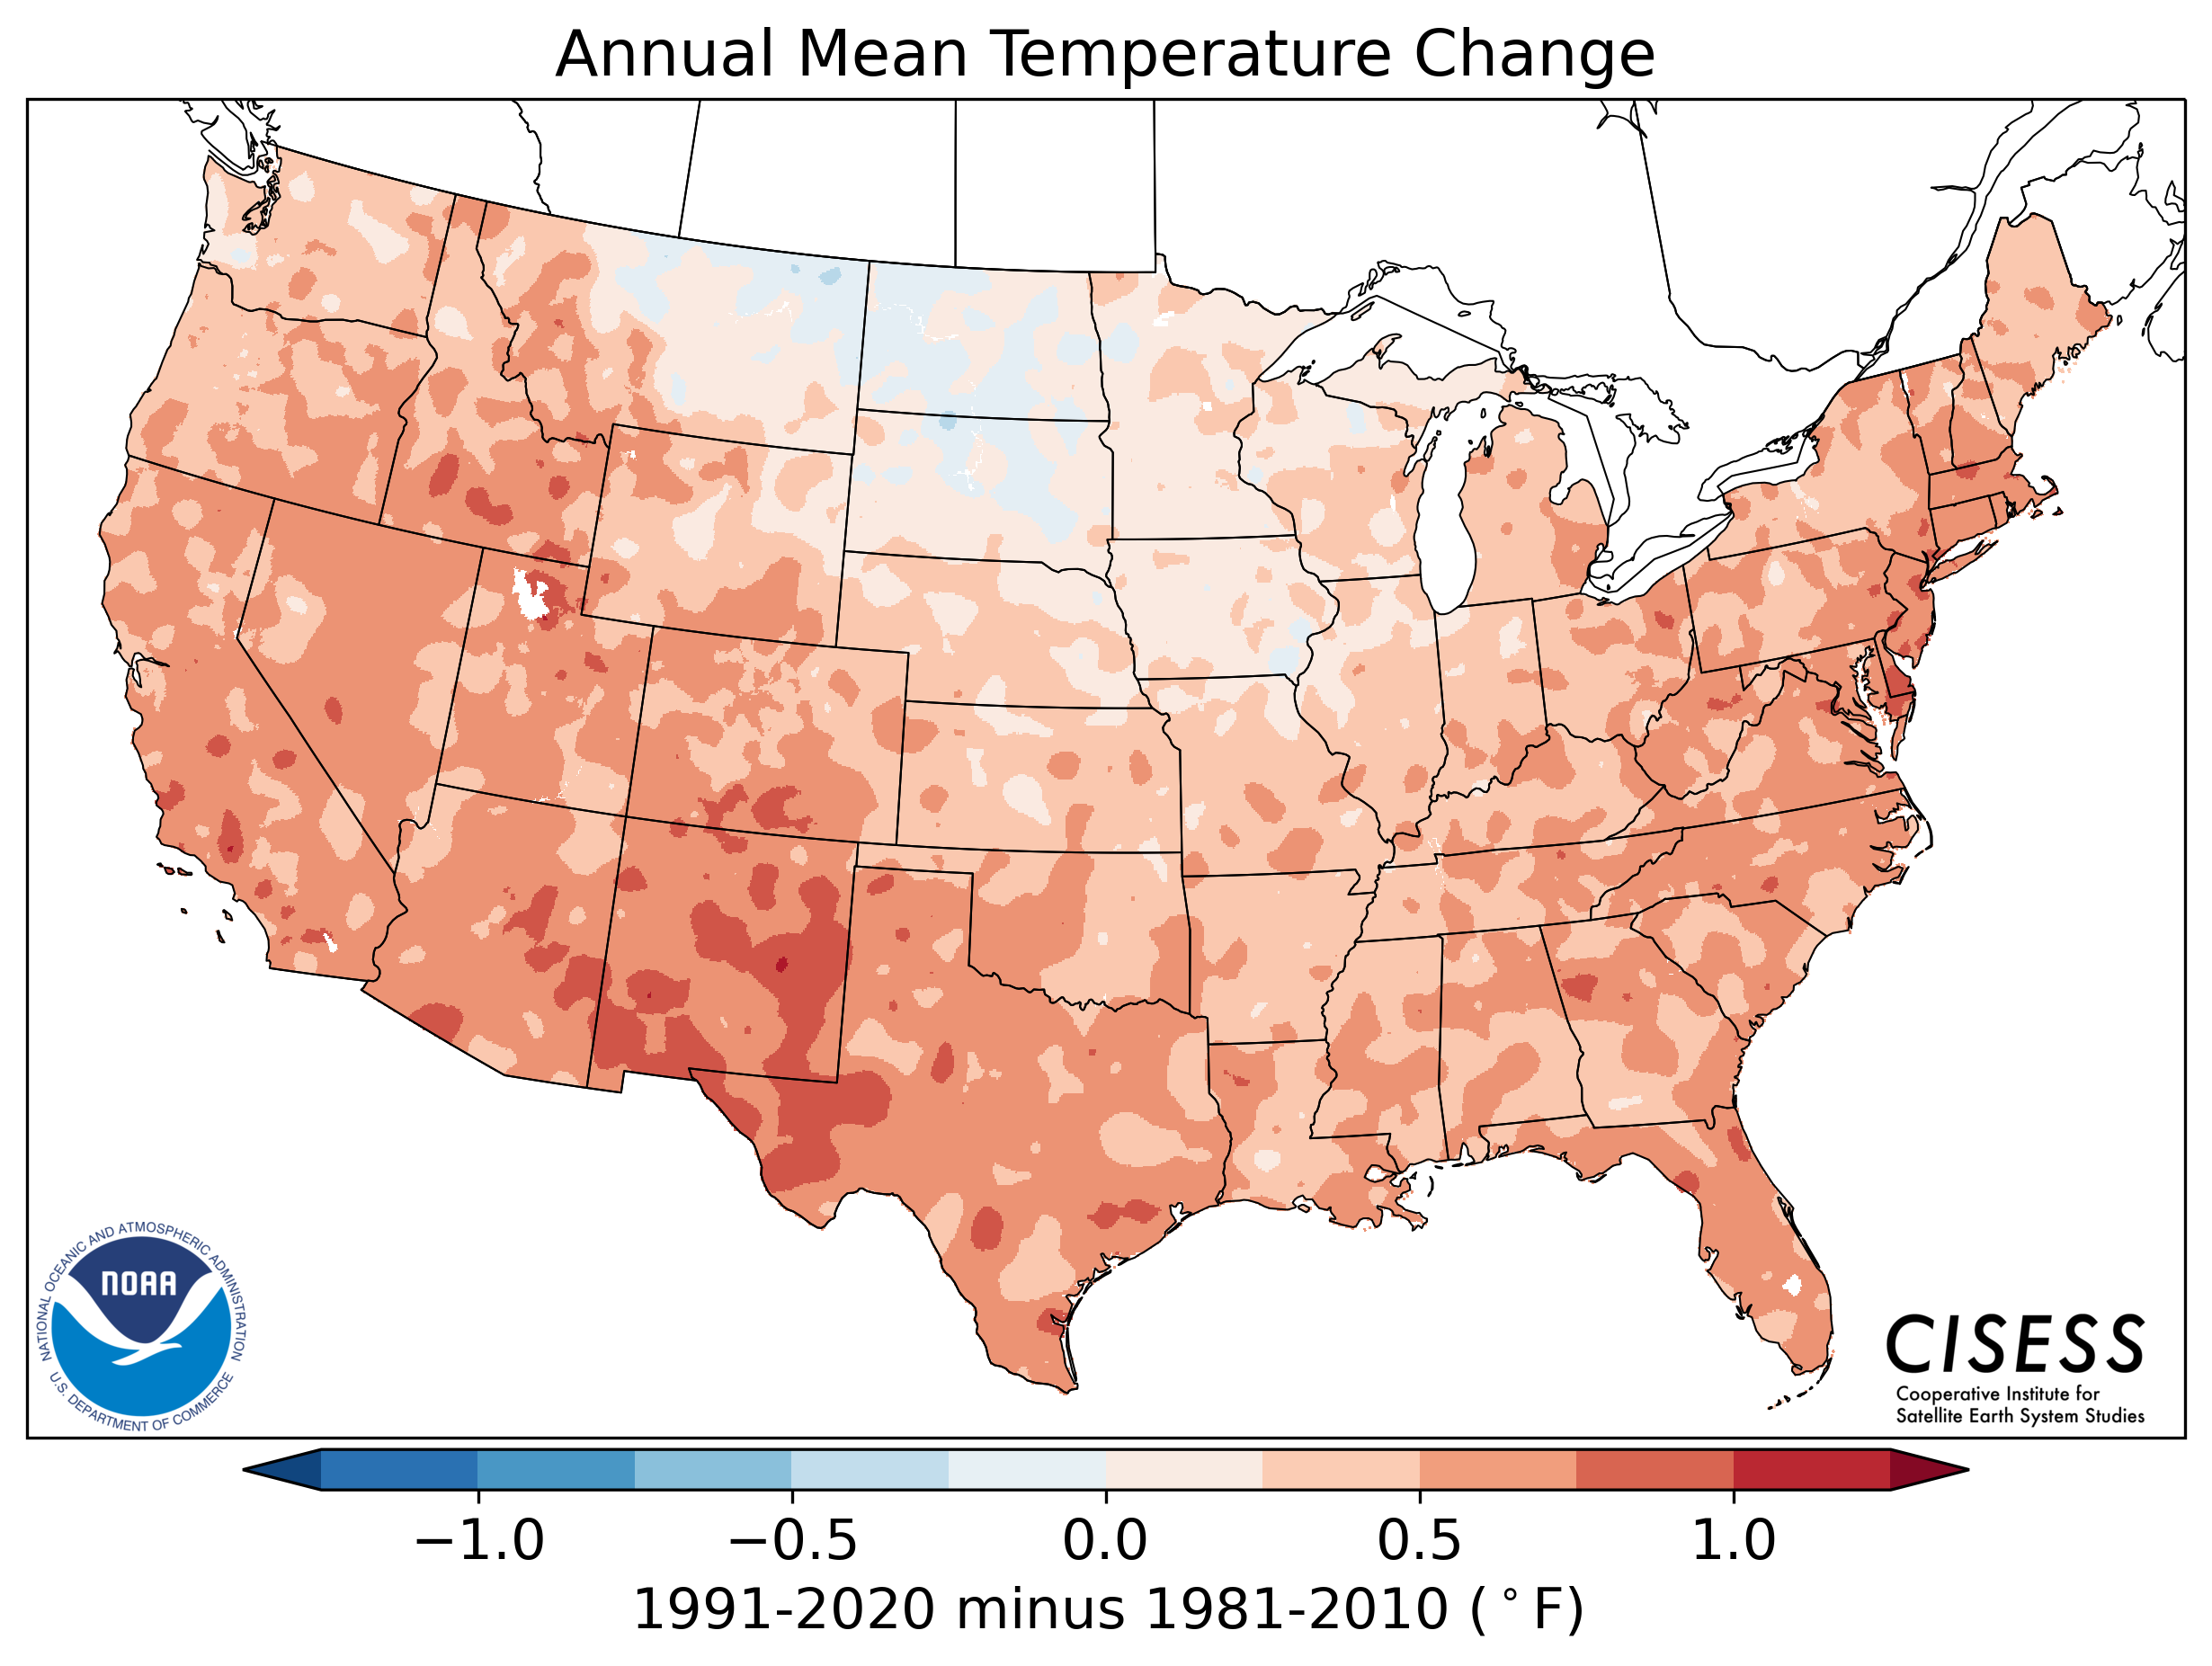
Figure 6: 1991-2020 minus 1981-2010 (a) Annual Mean Precipitation Change & (b) Annual Mean Temperature Change
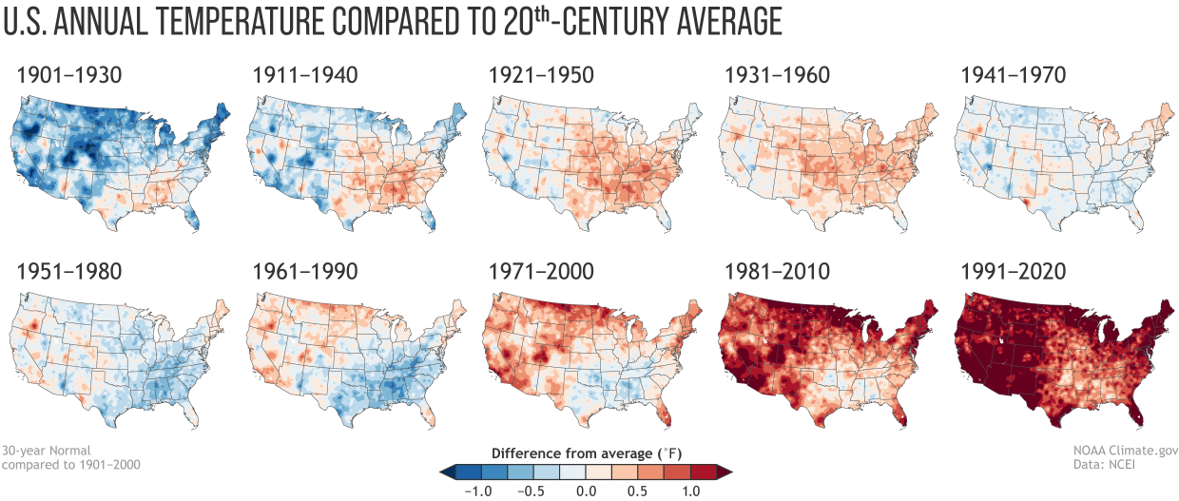
Figure 7 presents U.S. annual (a) average temperature and (b) average precipitation during each Normal period to the 20th-century average (1901-2000). They say that “influence of long-term global warming is obvious – a heuristic inference not based on factual information as seen in Figure 7. The earliest map [Figure 7 (a)] in the series has the most widespread and darkest blues, and the most recent map has the most widespread and darkest reds”. However, if we closely look at the maps, they clearly indicate a natural cyclic pattern. Reddy (2008) presented 60-year cycle in global average temperature anomaly for the period 1880 to 2010 and BRS & USNAS (2014) showed also 60-year cycle through moving average technique.
The U.S. Climate Normal Collection has 10 versions: 1901-1930, 1911-1940 and so on through 1991-2020. In the image below (Figure 7), we’ve compared the U.S. annual average temperature during each Normal period to the 20th-century average (1901-2000). The influence of long-term global warming is obvious: The earliest map in the series has the most widespread and darkest blues, and the most recent map has the most widespread and darkest reds. And yet, it’s probably not a coincidence that the last four maps in the series — the 1961-1990, 1971-2000, 1981-2010 and 1991-2020 Normal — are nationally the four wettest-looking maps in the collection. At least some of that wetness relative to the 20th-century average is linked to the overall climate warming and “wetting” of the atmosphere that’s occurred as rising temperatures causes more water to evaporate from the ocean and land surface. This argument is not correct as it is not reflected in the four figures relating temperature in comparison with rainfall maps. Also, the argument of sea water evaporation versus rainfall is a bad science. This is adapted to support blindly the global warming and carbon credit policy to share billions of dollars. What about El Nino and La Nina philosophy – dry and wet, which is evident in Indian rainfall. The other important one is natural variability [cyclic variations] in rainfall and temperature. (a)
(b)
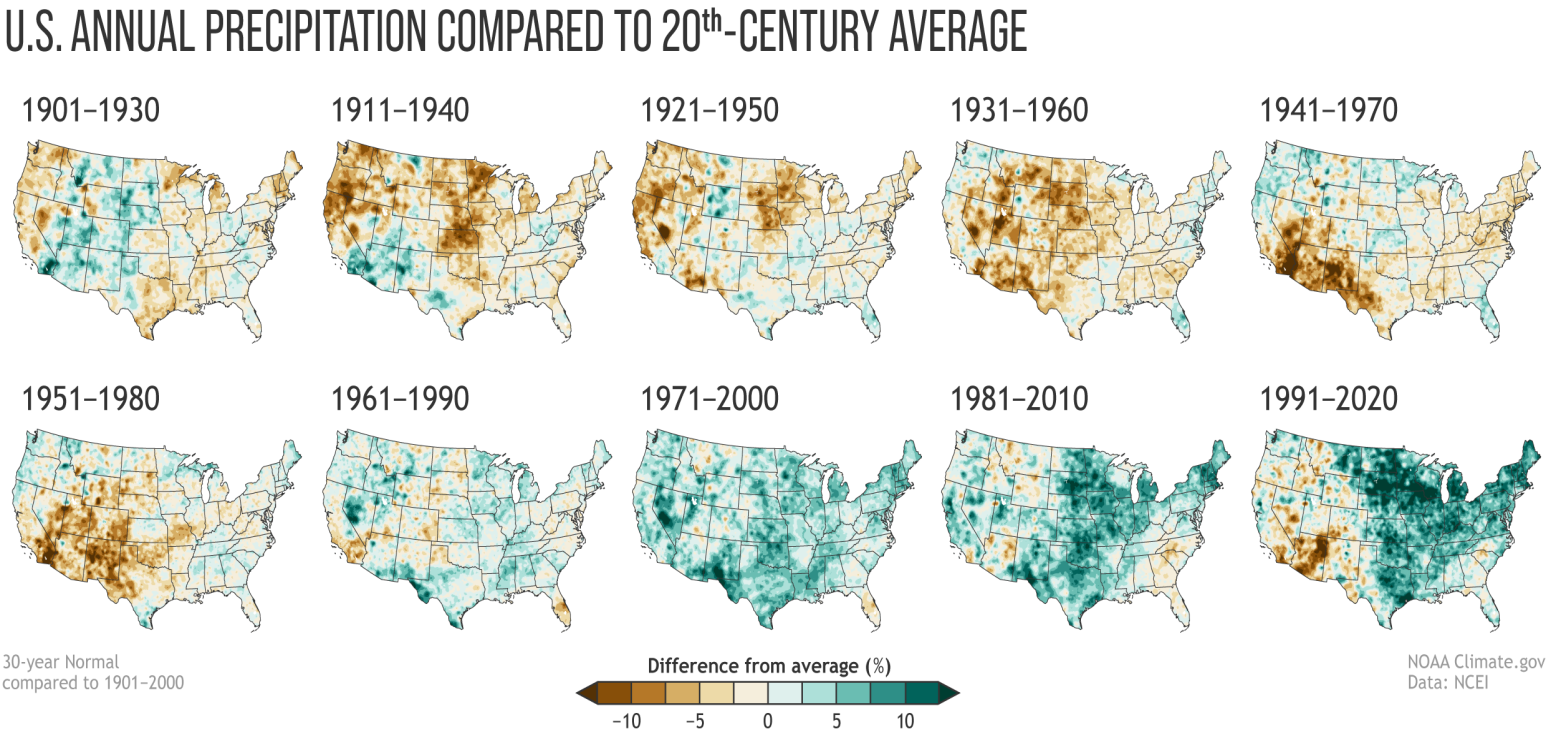
Figure 7: Annual U.S. (a) temperature & (b) rainfall compared to the 20th-century average for each U.S. Climate Normal period from 1901-1930 (upper left) to 1991-2020 (lower right). (NOAA NCEI)
Let us see Global, Northern Hemisphere & Southern Hemisphere temperature anomalies under Land, Ocean & Land + ocean for February, March & April and December to February, January to March & February to April 2021 (Table 1):
|
Temperature Anomalies |
|
Global |
|
|
|
1 0.93+0.13/0.54+0.15/0.65+0.15 February 2021 |
|
2 1.60+0.11/0.57+0.14/0.85+0.15 March 2021 |
|
3 1.25+0.12/0.62+0.14/0.79+0.13 April 2021 |
|
1 1.20+0.16/0.57+0.16/0.74+0.17 Dec.2020-Feb.2021 |
|
2 1.29+0.17/0.56+0.16/0.76+0.17 Jan.-March 2021 |
|
3 1.77+0.16/0.57+0.16/0.77+0.17 Jan. to April 2021 |
|
|
|
Northern Hemisphere |
|
|
|
1 1.10+0.11/0.69+0.14/0.84+0.13 February 2021 |
|
2 1.93+0.16/0.65+0.13/1.14+0.13 March 2021 |
|
3 1.36+0.16/0.74+0.13/0.98+0.13 April 2021 |
|
4 1.42+0.19/0.77+0.15/1.02+0.17 Dec.2020-Feb.2021 |
|
5 1.55+0.21/0.70+0.15/1.02+0.17 Jan.-March 2021 |
|
6 1.50+0.20/0.71+0.15/1.01+0.16 Jan.-April 2021 |
|
|
|
Southern Hemisphere |
|
|
|
1 0.51+0.14/0.44+0.14/0.45+0.14 February 2021 |
|
2 0.76+0.12/0.52+0.15/0.56+0.14 March 2021 |
|
3 0.95+0.11/0.53+0.15/0.60+0.14 April 2021 |
|
4 0.63+0.13/0.43+0.16/0.46+0.16 Dec.2020-Feb.2021 |
|
5 0.63+0.13/0.47+0.16/0.49+0.15 Jan.-March2021 |
|
6 0.69+0.13/0.48+0.16/0.52+0.16 Jan. to April 2021 |
Table 1: Global Temperature anomaly [oC]
Under each number three columns refer as: land/ocean/land + ocean; + = ±
Source: NOAA National Centres for Environmental Information, State of the Climate: Global Climate Report
Before going into the Table 1 directly, we must understand the basic movement of the Sun that creates seasonal variations in temperature. The Sun is in SH from December 22 to March 23 [on this day the Sun crosses the equator]. That means more energy reaches the Earth in SH over NH; and in January to March over March and December to February over February. This is not reflected in Table 1. It is also shown that Pacific Ocean & Atlantic Ocean temperatures present 60-year cycle but in opposite phase similar to southwest and northeast monsoon rainfall in south-eastern parts of India – same is also observed in Australian rainfall. Same is the case with the Arctic & Antarctic seasonal ice melt patterns. Let us see Table 1:
Under Southern Hemisphere 1 to 3 & 4 to 6 showed an increasing trend instead of decreasing trend;
Under Northern Hemisphere 1 to 3 showed an increasing trend with inverted “V” under land condition and opposite in ocean condition;
These results don’t follow the Sun’s energy path. Also, Northern Hemisphere and Southern Hemisphere trends follow more or less similar trend which should not be. Here no global warming component is really visible as said in NOAA report.
Conclusion:
United Nation has been running several “day” concepts without taking right steps. World Environment Day is one such. All ills including present Covid-19 & its impacted World’s Economy of the world are primarily associated with the growing population. Governments stopped looking at population control. This needs to be taken up seriously by member nations instead of harping on carbon dioxide and global warming reduction without any scientific evidence.
While analysing the temperature the sun’s energy path has not been taken into account while interpreting and arriving at a conclusion and instead talks of “there is a global warming that evaporates ocean waters and it is giving copious rain on mainland USA”. El Nino and La Nina process equatorial Pacific counters this theory as India experienced dry years during El Nino [temperature rise] and wet years during La Nana years [temperature fall].
Also, all over the world rainfall presents a natural variability (Reddy, 2008), so also the case with USA – droughts and floods. However, the impact of weather-related disasters is amplified both in urban and rural areas due to human actions.
To meet the food needs of ever-increasing population, chemical fertilizers are used that cause air, water, food pollution and wasting 30-40% of food produced and at the same time-wasting inputs to that extent (Reddy, 2019). That is to say, Multinational Companies are looting the world and created new health hazards. To cure these health hazards drug manufacturing industries and hospitals have sprang up not only looting the world but also causing new pollution that introduce new health hazards. All these vicious circles explained in a book “Sick Planet: Corporate Food & Medicine” [2006] by Stan Cox. The so-called renewable/clean energies are more hazardous over the traditional energy production systems except that the business houses change but directly increases the local temperatures.
United Nation must re-look into their environmental policies for betterment of humankind instead of harping on “day” concepts. Also, United Nations [Organizations] must pressurise the individual nations to bring out acts that have the provisions with stringent action with powers over-riding judiciary. Without this, there is no way to protect nature/ecosystems and safeguard ancient wisdom. In India local proverbs define the weather in different seasons. For example, in Telugu there is a proverb on “Rohini Karthy” which expresses the heat expected but this year the heat is lower than expected in my place and define the expected monsoon condition. Peak severe cyclones occurred in Summer- May and as well as Winter-November in both Arabian Sea & Bay of Bengal.
United Nations organizations must pressurise the nations to bring out Acts/Laws to punish severely for causing harm to “native” nature-natural ecological systems under some pretext or other that should be made beyond the purview of judiciary as it is now most corrupt system around the World.
Acknowledgements:
While presenting the story, the author used information from different sources. I am herewith expressing my thanks to those authors/institutions.


Open Access By Aditum Open Access Journals id licensed under Creative Commons Attribution 4.0 International License. Based On a Work at aditum.org