Aditum Journal of Clinical and Biomedical Research
OPEN ACCESS | Volume 8 - Issue 1 - 2026
ISSN No: 2993-9968 | Journal DOI: 10.61148/2993-9968/AJCBR


Sorush Niknamian
Member of Federal Dealth Professionals, Military Medicine, US Army, United States
*Corresponding Author: Sorush Niknamian, Member of Federal Health Professionals, Military Medicine, US Army.
Received: April 12, 2021
Accepted: April 19, 2021
Published: April 23, 2021
Citation: Sorush Niknamian. (2021) “Evaluation of serum vitamin D levels in patients with hepatitis B virus (HBV)”, Aditum Journal of Clinical and Biomedical Research, 2(3); DOI: http;//doi.org/04.2021/1.1021.
Copyright: © 2021 Sorush Niknamian. This is an open access article distributed under the Creative Commons Attribution License, which permits unrestricted use, distribution, and reproduction in any medium, provided the original work is properly cited.
Introduction:
Recently, several studies have shown that vitamin D deficiency is a significant contributor to a number of diseases, including those with hepatitis B virus (HBV) viral infection. Also, its role as an effective factor in the progression of the disease to the complications associated with chronic hepatitis B (CHB), such as cirrhosis (LC) and hepatocellular carcinoma (HCC), has been investigated. The aim of this study was to compare serum vitamin D levels between patients with HBV and healthy controls.
Method:
In this descriptive cross-sectional study, 114 HBV patients (59 active chronic hepatitis, 42 inactive carriers and 15 patients with liver cirrhosis) and 104 healthy controls were enrolled. Patients were examined by the infectious specialists, internal specialists, and gastroenterologists and they were referred to the laboratory for the purpose of conducting an examination and recording of information during the year 2016 at Shaheed Mohammadi Hospital in Bandar Abbas (Hormozgan province). Participants' data included demographic information, height, weight, BMI, serum levels of 25-hydroxyvitamin D, creatinine, urea, albumin, alpha Phyto protein, calcium, phosphorus, FBS, alkaline phosphatase, ALT, and AST was collected and entered into SPSS16 software. T-test, Mann-Whitney, and regression were used to determine the effect of vitamin D on other variables.
Results:
67 (58.8%) patients with HBV and 54 (52.90%) healthy controls were male. The mean age of HBV patients was 42.96 ± 15.33 and the mean age of healthy controls was 39.06 ± 12.7 years. The prevalence of reduced serum vitamin D levels lower than 30 ng / ml was observed in 94 cases (81.03%) in HBV group and in 70 cases (67.30%) in healthy controls. Also, the prevalence of severe deficiency (<10 ng / ml) and deficiencies between 10-20 ng / ml in HBV patients was 51.7%. The frequency of these deficiencies in the subgroups of HBV patients was as follows: CHB (% 43.10), L.C (% 80), Inactive carriers (% 52.41), while in the healthy control group (H.C) was (44.20%) (P <0.001). Distribution of vitamin D deficiency in rural people is more than urban population. (OR = 2.321 CI 95% 1.31-4.11), which is statistically significant in two groups (P=0.004). Logistic regression analysis of the frequency distribution of vitamin D level for ALT (P = 0.38 OR = 1.016), AST (P = 0.005 OR = 1.027), AFP (P = 0.005 OR = 1.281), and ALB (P = 0.085 OR = 0.57) shows that a meaningful relationship between these variables exists.
Conclusion:
The study showed that vitamin D level was significantly lower in all groups of patients with HBV compared with healthy controls. It is necessary to routinely test blood serum vitamin D levels and, if necessary, prescribe these supplements by specialists for patients to increase their level of vitamin D sufficiently and standardly. The point to be considered is that in healthy controls, inadequate level and insufficient vitamin D deficiencies compared to the standard range were observed. Therefore, it is suggested that in addition to screening these people, a broad study be conducted to identify possible causes for these deficiencies
Introduction:
Hepatitis B virus (HBV) infection is still a major health concern and a threat to many human beings around the world. Nearly two billion people worldwide are infected with this virus and more than 240 million suffer from chronic hepatitis B (CHB) infection. Nearly 800,000 people die annually due to complications of the disease, such as cirrhosis and hepatocellular carcinoma (1, 2). Approximately 95% of infants with hepatitis B infection develop acute state of illness and 5% of adults progress to chronic state (3). Regarding the prevalence of hepatitis B virus infections, different regions of the world are categorized into four groups: low prevalence (less than 2%), less than moderate (2-4%), more than moderate (5-7%), and high prevalence (8 percent or more). Africa, Southeast Asia, China, and parts of the Middle East have been reported to be highly prevalent areas. Most of these people are affected by mother-to-baby transmission and during childhood (vertical transmission). But in areas with a low prevalence, such as in European and North American countries, the infection is seen mostly in adults and the causes are blood and sexual transmissions (horizontal transmission). In areas with a moderate prevalence, the patients are children, adolescents, and adults. Of course, in recent years, the incidence of the disease due to the vaccination program has fallen sharply in some countries, especially in the Southeast Asia (4, 5). Hepatitis B virus is a DNA virus belonging to the hepadenaviridae family and has eight known genus types. However, two other genotypes have recently been identified (6). The natural course of hepatitis B virus infection without treatment and follow up of a healthy vector, chronic active hepatitis, cirrhosis, and hepatocellular carcinoma varies (7). Although new nucleotide and nucleoside analogues such as telbivudine, lamivudine, adefovir, entecavir, and tenofovir have been able to play an important role in treating and preventing disease progression towards lethal and fatal complications (8, 9), other high risk factors such as high weight, age (higher than 50), diabetes mellitus, genotype B, simultaneous diseases like HIV, HCV, cancer, and a decrease in serum levels of vitamin D should be taken into account (10). Vitamin D deficiency is seen in many chronic diseases, including those caused by hepatitis B virus infection. Some evidence suggests that there is a link between vitamin D and immune system stimulation against many diseases, including hepatitis B and C. Vitamin D is a fat-soluble vitamin that helps with absorbing calcium and phosphorus from the intestines by inhibiting the Parathyroid hormone (PTH) (11-13). Both the cellular and homologous immune systems of the body are vitamin D-dependent, so that they can perform their duties (14). The most important source of vitamin D is the skin contact with sunlight. Another source is the consumption of foods rich in vitamin D such as fish and egg yolks, but vitamin D2 is obtained from plant foods (15). Vitamins D2 and D3 are both physically inactive, but in the liver, they convert to 25 hydroxyvitamin D3 metabolites and ultimately into the active ones in kidney, which is 1, 25 hydroxyvitamin D3. The amount of sun exposure to the body, having dark or light skin, and environmental factors contribute to the production of vitamin D. However, there are various causes for serum deficiency in hepatitis C patients including cases for cirrhotic patients in which on the one hand, the liver loses its effectiveness somewhat, and on the other hand, the need for calcium also increases the prevalence of osteopenia and osteoporosis and one of the main reasons for this cycle is vitamin D deficiency (16). Therefore, vitamin D is considered an important factor in the ultimate consequence of determining the status of patients during the natural course of the HBV period and drawing the vitamin D pattern in patients can be helpful in making decisions on how to administer vitamin D to them (17). In this study, we try to measure the level of vitamin D in patients with HBV and the complications associated with the disease, such as chronic active hepatitis B, active carriers, cirrhosis and compare them with healthy controls referring to Shaheed Mohammadi Hospital in Bandar Abbas (Center of Hormozgan Province - southern Iran).
Method:
This descriptive cross-sectional study was performed on 114 patients with HBV (59 active chronic hepatitis, 42 active carriers, 15 cases of cirrhosis) which were eligible patients who were referred to Shahid Mohammadi Hospital in Bandar Abbas in 2016. All patients were selected and included into the study by internal and infectious specialists and gastroenterologists. This study was approved by the Ethics Committee of Hormozgan University of Medical Sciences. All participants completed the informed consent form before entering the study. 104 healthy controls were selected from among the companions and patients who didn't have a history of hepatitis B disease and also had criteria for entering the study.
The criteria for entering the study in the HBV group include: Patients who were infected with hepatitis B virus, had willingness to participate in the study, completed consent form, were age over 18 years, didn't receive supplementation of calcium and vitamin D in the last three months or injection of vitamin D drops during the last six months. Characteristics of CHB patients based on clinical symptoms included anorexia, weakness, anesthesia, jaundice, enlargement of the liver or spleen, and increased liver enzymes such as ALT, AST and HBsAg + positive for more than 6 months. Patients with cirrhosis also had symptoms such as weight loss or increase due to ascites, anorexia, fatigue, enlargement of the spleen, liver enlargement, increased ALT, AST, decreased ALB and serum platelets, Increase alpha-Phyto protein AFP, prolonged PT and PTT. In some of these patients, sonography, CT scan and MRI were also used to confirm the disease.
Exclusion criteria include: Patients' and healthy controls' lack of satisfaction for blood collection, severe renal disease, history of cardiovascular disease, co-infection with cancer, pregnancy, bone fracture or prolonged immobilization, diabetic disease, thyroid, other viral hepatitis (HCV, HDV, HIV), and other causes of liver disease such as alcohol consumption. Demographic data of patients and healthy controls such as age, sex, education, occupation, place of living, body mass index (BMI) was collected using a questionnaire. Also, the results of vitamin D serum levels and other complementary studies were recorded after blood sampling. Grouping of all participants based on age was done at the beginning of the study (older than 65, 56-64, 45-55, 35-44, 25-34, 18-24). Those who were unable to do the tests for various reasons were excluded (8 people).
Laboratory tests:
For laboratory tests, 10 cc of venous blood was taken from patients and healthy controls. The serum levels of vitamin D were measured using a COBAS e411 analyzer, manufactured by Mannheim Roch diagnostic Gmbh in Germany, with the Elecsys kit (REF 0589413), and Chemiluminescence method according to the manufacturer's guidelines. Other tests were performed on patients and healthy controls according to laboratory routines. Serum vitamin D levels between 30-30 ng/ml, between 20-30 ng/ml, between 10-20 ng/ml, and more than 100 ng/ml were determined as Sufficient, Insufficient, Deficient, and Toxic respectively. Levels of ALT, AST, ALP, albumin, alpha-Phyto protein and bilirubin levels of liver enzymes were measured by the ARCHITECT i System biochemical auto-analyzer, manufactured by Abbot Laboratories company, Germany. Levels of total cholesterol, LDL, HDL, and blood indexes were also measured.
The qualitative HBsAg test was performed using the ARCHITECT i System (product of Germany) device and the chemiluminescent microparticle immunoassay and the quality assay of HBsAg was assessed using ARCHITECT HBsAg Qualitative II Reagent Kit (2g22). The Anti-HCV test was also performed with this device, and the ARCHITECT Anti-HCV 6C37 Kit. To identifying people with HIV Chemi Luminescence method with ARCHITECT HIV Ag / Ab Combo Reagent Kit (4j27) (made in Germany) was used.
Statistical Methods:
In this study, the collected data was entered into SPSS16 software. To describe and analyze the data, mean score, standard deviation, normal distribution, t-test independent, and Mann-Whitney U test were used for quantitative variables and frequency, percentage, and chi-square were used for qualitative variables. Chi- Square test was used to analyze the grouped variables. The comparative quantitative statistics were analyzed by logistic regression, Pearson correlation and Spearman analysis. P <0.05 was used for statistical significance.
Results:
The underlying and demographic characteristics of the participants including age, sex, weight, BMI, were compared in HBV patients, HBV subgroups, and healthy controls (Table 1). Of the 114 patients with viral hepatitis B, 67 (58.8%) were male and 47 (41.2%) were female. Also, 54 (51.9%) of the healthy control group were female and 50 (48.1%) were male. The mean age of the patients participated in the study was 42.96 ± 15.33 years and the mean age of the healthy control group was 39.06 ± 12.73 years. According to the results, the risk of vitamin D deficiency in men is 45% higher than in women. (OR = 1.540), which is not statistically significant (P = 0.114). The age groups of 25-34 and 35-44 had the most frequency of participants which were 31 (27.7%) and 27 (24.1%) in patients’ group and 33 (32%) and 31(30.1%) in healthy control group respectively. Patients with HBV who participated in the study were classified into three groups: chronic hepatitis B (59 patients), cirrhosis (15 patients), and inactive carriers (42 patients). In terms of age, the mean age of 39.06 of healthy control group was higher compared with the younger members of HBV patients, but with the progression of the disease from inactive carriers (mean age 41.27) to chronic hepatitis (mean age 41.82) and into cirrhosis (mean age 54.39) the mean age of the patients increased as well. However, no significant difference was found between the HBV patients and healthy controls (P = 0.051). Among the patients, 55.3% were urban and 44.7% were rural residents. According to the results, distribution of vitamin D deficiency in rural people is more than urban population. (OR = 2.321 CI 95% 1.31-4.11), which is statistically significant in both groups. (P=0.004)
It was found that those who were illiterate or have an elementary level of education had a significantly higher frequency of inadequate and deficiency of vitamin D, and this relationship was statistically significant (P = 0.006, P = 0.003). 44.4% of healthy subjects had normal BMI, 40.04% were overweight and 11.1% were obese. But in general, 47.3% of patients with HBV had a desirable weight, 35.5% had overweight, and 8.2% had a BMI of more than 30. There was no significant difference in the BMI distribution between the two groups (P = 0.1.3).
The results of the comparison of laboratory characteristics and the analysis of the biochemical variables of HBV patients and healthy controls (Table 2) showed that the mean ALT in HBV patients was 32.82 IU/ML (8-117) and AST was 32.21 IU/ML (10 -167). Of the 114 patients in total 24 (21.04 %) had ALT and 20 (17.54%) had AST higher than 40 IU/ML while of the 104 patients in the healthy control group, only 15 had ALT and 5 had AST higher than 40 IU/ML. However, the mean of ALT, AST in all three groups was higher than healthy control group. According to the results of the Mann-Whitney test, there was a significant difference between the two groups (P = 0.001). Also, logistic regression test (OR = 1.016) showed that this chance and relationship were statistically significant (P = 0.036). The results of other tests related to AST (P=0.005 OR=1.033 Na (P= 0.009 OR =0.879)) were also statistically significant. The mean of ALP among patients was 205.41 IU/ML and a statistically significant difference was found between healthy controls and HBV patients (P = 0.001 OR = 1.008). Based on the Mann-Whitney, Regression test, and independent t-test, other types of variables such as total bilirubin, LDL, TG, HDL, BMI, HB, HCT, PT, PTT, age, sex, and vitamin D levels were studied. No significant difference was observed.
|
|
||||||||||||||||||||||||||||||||||
Table 2: Comparison of laboratory properties and biochemical variables analysis of HBV patients and healthy controls
Abbreviation: CHB chronic hepatitis B, LC liver cirrhosis, Inactive carrier, HC healthy control, , PLT platelets.INR international normal ratio,AST and ALT aspartate and alanine amino transferase, AFP alpha fetoprotein, ALB albumin, TG triglyceride, HB hemoglobin, HCT hematocrit, Na sodium, Ca calcium, ph. phosphor
The level of serum vitamin D in patients with HBV and healthy controls:
The mean serum vitamin D levels in healthy control and HBV patients were 23.74 and 20.13, respectively. No significant difference was observed (P = 0.248). According to Mann-Whitney test, the relationship obtained (OR = 1.014 CI 95% (0.990-1.038)) was not significant. The level of vitamin distribution in groups of healthy controls, HBV patients, and in the subgroups of HBV patients is presented (Table 3). 34 (29.4%) of HBV patients had inadequate vitamin D, 53 (45.7%) had vitamin D deficiency, and none of them had toxic levels. 24 (23.1%) of healthy controls had inadequate vitamin D levels, 32 (30.7%) had deficiency, and 14 (13.5%) had severe vitamin D deficiency which, in comparison with HBV patients, were unexpected and need to be considered seriously. Chi-square test results showed significant difference in vitamin D3 levels between the three groups of hepatitis B patients (P <0.001).
Severe deficient (<10) 2 (3.4) 2 (4.8) 3 (20) 7 (6) 14 (13.5) Deficient (10-20) 24 (40.7) 20 (47.6) 9 (60) 53 (45.7) 32 (30.7) Insufficient (20-30) 21 (35.6) 11 (26.2) 2 (13.3) 34 (29.4) 24 (23.1) Sufficient (30-100) 10 (16.9) 9 (21.4) 1 (6.7) 20 (17.2) 31 (29.8) Missing data 2 (3.4) 0 0 2 (1.7) 3 (2.9 |
Table 3: Serum levels of vitamin D3 in different groups, healthy controls and hepatitis B patients (inactive carriers, chronic active hepatitis, and cirrhosis)
CHB chronic hepatitis B, LC liver cirrhosis, Inactive carrier, HC healthy control, HBV hepatitis B virus
Chi-square test for all groups including HC, CHB, LC, and HCC P = < 0.001
Discussion:
This study was conducted for the first time in Hormozgan province (a region in southern Iran) regarding vitamin D pattern in patients with HBV. Today, it seems that for various reasons, such as specific behaviors in urban living, inappropriate food consumption and less contact with sunlight, vitamin D levels even in healthy individuals are not desirable (18, 19). Vitamin D plays a decisive role in absorbing calcium and phosphorus in the intestines and bones and reducing renal excretion and is also effective in improving the immune system during immune responses (20). Its deficiency can be a source of disease or progression of diseases such as rheumatoid arthritis, diabetes, multiple sclerosis, inflammatory bowel disease, and cardiovascular diseases, and its deficiency can be a predisposing factor for infectious diseases including viral hepatitis (21, 22). Unfortunately, vitamin D deficiency has become a global problem, and about one billion people suffer from this disorder around the world. Also, some studies have highlighted the role of vitamin D deficiency in the progression of liver disease (23). In a twenty-year period (1990-2010), the prevalence of vitamin D deficiency in Iranian society was studied and according to the results, in all regions, both sexes had moderate and significant vitamin D deficiency, and this deficiency was higher in the southern regions of the country (24). However, in spite of the sunniness of most months of the year, in areas such as Australia, Saudi Arabia, Turkey and some parts of Europe and America, the prevalence of vitamin D deficiency is still high (25). In a study, Nghiem Xuan Hoan and colleagues found that vitamin D deficiency existed in many CHB patients and this deficiency had a relationship with the complications and outcome of the disease, and it was suggested that vitamin D supplements be taken as a remedy for lower levels of vitamin D (12). (26) Decreased liver function due to HBV-induced injuries to liver cells can be one of the causes of vitamin D deficiency in CHB. Also, vitamin D degradation and catabolism and lack of hydroxylation of vitamin D due to liver function impairment can be considered as one of the causes of vitamin D deficiency and the cause of this deficiency is important in all chronic liver diseases (27). The results of this study showed that different degrees of prevalence of vitamin D deficiency existed among 94 (81.03%) of patients with HBV and 70 (67.30%) of healthy controls (Figure 1). Although the residents of this province had access to good sunlight exposure during the year, they still were suffering from vitamin D deficiency. The duration of exposure to sunlight exposure is an important factor in the changes in vitamin D levels (28). This difference in vitamin D deficiency may have different justifications. In this study, blood samples were taken from the participants in the winter and early spring. It does not seem that this test would have had much effect on the results if it was taken in other seasons. In a research conducted by Rasoul Zarrin on the effect of vitamin D in pre-diabetic adults, the effect of solar radiation (P = 0.51) and physical activity (P = 0.56) after three months of treatment with vitamin D did not have a significant effect and no significant changes were reported regarding the relationship between these variables (29). In some studies, vitamin D levels were found to be inversely proportional to HBVDNA viral load and having a sufficient level of vitamin D in these patients is one of the factors limiting virus replication and reducing viral load (30). In this study, HBVDNA data was not adequately collected, but in those 64 (62.1%) participants who had higher viral load tests, vitamin D was also low (P = 0.004). As shown in Figure 2, the highest incidence of vitamin D deficiency in HBV patients is in the range 10-20 ng/ml and more than 50 patients were in this group. Interestingly, the prevalence of <10ng/ml in healthy controls had a higher percentage. The mean serum vitamin D level was 23.74 ng/ml in the control group and 20.13 ng/ml in the hepatitis B combined group (Figure 3). In particular, the prevalence of vitamin D deficiency was more important in HBV patients, as ultimately this deficiency is a risk factor for all HBV-associated subgroups. The results were similar to those of Soheil Tavakolpour's study in 2016 which was conducted on 84 HBV patients who were classified into three subgroups of inactive carriers, those who were treated with anti-viral, and new cases. This study clearly indicated that vitamin D levels were lower in patients compared to control group and concluded that vitamin D contributes to the clinical status of hepatitis patients and there is a relationship between their level of health and vitamin D levels (31). But the big difference between this study and theirs is that a significant percentage of control group (13.5%) had severe vitamin D deficiency in this study. However, these results indicate that the relatively high prevalence of vitamin D deficiency is similar to that reported by Heshmat R MK and colleagues. The study found that 72.1% of healthy men and 75.1% of healthy women in Iran suffered from severe vitamin D deficiency (32). The serum vitamin D3 levels were measured in 26 patients who were excluded from the study due to anti-viral therapy. The mean of their vitamin D levels was 24.36 ng/ml, which was even higher than the mean of all patients and the control group. Perhaps it should be interpreted that anti-viral therapy helps controlling serum vitamin levels. One of the other variables that was studied in the subjects was body mass index (BMI). BMI higher than normal (>25) is considered to be an effective factor in the level of vitamin D stores. It means increasing the fat mass leads to a dramatic decrease in serum levels of vitamin D (33). In this study, the mean BMI in HBV patients was 24.33 ± 3.43 and in the healthy control, it was 25.26 ± 3.79. 35.5% of patients had BMI between 25-30 and 8.2% had BMI greater than 30. However, no significant relationship was found between serum levels of vitamin D and BMI (P = 0.133). This result was different from the study by Francesco Vierucci in 2014, which found a relationship between BMI and serum levels of vitamin D (34). There was a cohort study in 2015 conducted by Wong with the title of "Long-term effects of vitamin D deficiency on the final outcome of CHB patients". Of the 426 participants in the study, 65% were male and the mean age was 41 ± 13. 33% of patients used antiviral drugs during follow up. The mean serum level was 24.4 ± 9.4 ng/ml and 384 (82%) of patients had vitamin D levels less than 32 ng/ml. In 22.8% of patients after a period of approximately 15 years with a low serum level, clinical complications occurred. The incidence of complications among patients with vitamin D deficiency (95% CI, 23.1%–27.9%) was 25.5% and it was concluded that vitamin D deficiency as an independent factor could be associated with clinical complications (35). In a meta-analysis, it was found that the presence of baseline serum levels higher than 30 ng / ml (OR = 1.57) and even the addition of vitamin D supplements (OR = 4.59) could lead to an appropriate and high response rate of SVR in patients with hepatitis C (36).
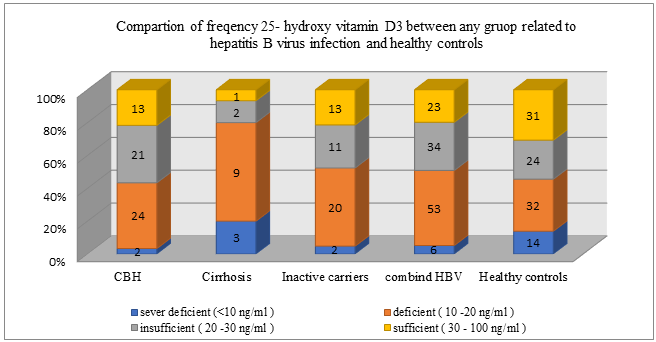
Figure 1: Vitamin D3 in different groups (healthy control, inactive carriers, chronic active hepatitis, cirrhosis)

Figure 2: Comparison of different levels of vitamin D3 in two different groups (healthy control, hepatitis B patients)
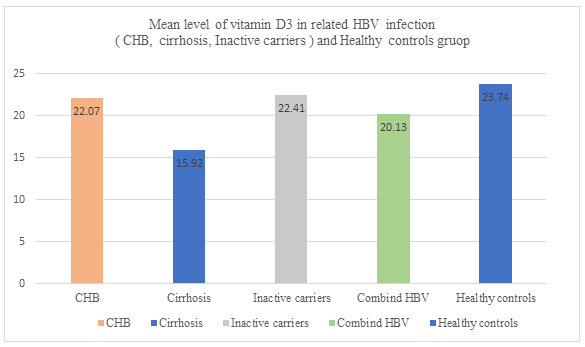
Figure 3: Vitamin D3 in different groups (healthy control, inactive carriers, chronic active hepatitis, cirrhosis)
Conclusion:
In this study, it is determined that in all groups of the disease caused by infection with hepatitis B virus, serum levels of vitamin D decreased. Considering that vitamin D plays an important role in preventing the development of complications of the diseases such as cirrhosis and hepatocellular carcinoma, it is also necessary to consider the treatment issue seriously. It is advisable to routinely test serum vitamin D3 levels in these patients and, if necessary, prescribe these supplements by specialists for them to increase the level of vitamin D in patients with hepatitis B sufficiently and standardly. It is noteworthy that although vitamin D3 deficiency is apparent in patients, this deficiency is also noticeable among healthy people. Therefore, a comprehensive study is recommended to identify the causes.
Conflict of interest: The authors declare no conflict of interest.
Acknowledgement:
The authors of this article find it necessary to thank the honorable consultant of Hormozgan University of Medical Sciences for Research and Technology and all patients participating in the study as well as the respected head and experts of Laboratory of Shahid Mohammadi Hospital of Bandar Abbas, who were extremely cooperative in taking samples and doing experiments.


Open Access By Aditum Open Access Journals id licensed under Creative Commons Attribution 4.0 International License. Based On a Work at aditum.org