Aditum Journal of Clinical and Biomedical Research
OPEN ACCESS | Volume 8 - Issue 1 - 2026
ISSN No: 2993-9968 | Journal DOI: 10.61148/2993-9968/AJCBR


Miriam O’Callaghan1,2, Dineshkumar K. Balasubramanian2, Farahnaz Behgounia2, Neha Shukla2 , Priyansha Jayaswal2 , Bahman Zohuri2,3,4 *
1William Woods University, School of Business and Technology, Fulton, Missouri 65251.
2Golden Gate University, Ageno School of Business, San Francisco, California 94105, Business Analytics School.
3Galaxy Advanced Engineering, a Consulting Firm, Albuquerque, New Mexico 87111.
4Computer Science and Electrical, Computer Engineering, International Technological University, San Jose, California
*Corresponding Author: Bahman Zohuri, Computer Science and Electrical, Computer Engineering, International Technological University, San Jose, California.
Received: April 15, 2021
Accepted: April 20, 2021
Published: April 26, 2021
Citation: Dineshkumar K. Balasubramanian, Farahnaz Behgounia, Neha Shukla, Priyansha Jayaswal, Bahman Zohuri.et.al. (2021) “Prescriptive Analytics for Airline Price Optimization Driven by Artificial Intelligence and Machine Learning, and Excel Spread Sheet Algorithms”, Aditum Journal of Clinical and Biomedical Research, 1(5); DOI: http;//doi.org/04.2021/1.1023.
Copyright: © 2021 Bahman Zohuri. This is an open access article distributed under the Creative Commons Attribution License, which permits unrestricted use, distribution, and reproduction in any medium, provided the original work is properly cited.
Airline industry worldwide, has reported significant losses as demand for air travel declined due to COVID 19 pandemic. In 2021, the situation seems to have improved a little and therefore airlines are expecting demand to increase. This is the time when airlines can restore their economic viability. For airlines to be profitable again, they need to maximize their profits while optimizing prices and charging the best price for each airline ticket. Pricing decisions can be highly time consuming and cumbersome since each day, you might need to adjust these prices depending upon the demand. Most of the times, demand cannot be accurately determined. Another challenge for profit maximization is cost estimation. Certain costs cannot be predicted, and cost is an important component of profit equation.
Considering all the pricing challenges and current situation, we have created two models for airlines. Model 1 can be used by airlines in situation where they do not have cost estimates. This model can be used in both uniform and variable demand situations. Model 2 on the other hand, is recommended to be used when the airline can estimate its costs. Both these models optimize prices, provide recommendations on best prices and how much revenue an airline can earn at each price point.
With Artificial Intelligence (AI) and its sub-systems, such as Machine Learning (ML) and Deep Learning (DL), this article of short review, is taking advantages of integration and augmentation of AI, ML and DL, by writing a simple Python algorithm to be able to predict certain cost of operation and considering for airline price optimization analytics. Using two proposed models in this research, airlines can still manage their profitability. This article was induced based on a class project at Golden Gate University under supervision of Prof. B. Zohuri and team of students named in above as participants and collaborators in this project
1. Introduction:
In the past decade or so, Artificial Intelligence (AI) has become known to us as a technology powered with capabilities at par with human intelligence. With advanced technological approaches such as Machine Learning (ML) and Deep Learning (DL) as integrated sub-systems to AI, combined, provide an excellent augmentation to make our daily lives and business operations more efficient.
The rise of Artificial Intelligence (AI) with its large-scale adoption is pressing businesses to adopt AI applications. Sufficient conditions as Big Data and Machine Learning and consequently Deep Learning (DL) (i.e., see Figure-1) are having an impact on most aspects of our modern life, from entertainment, commerce, banking, sports, cybersecurity, energy both renewable and non-renewable, and healthcare.
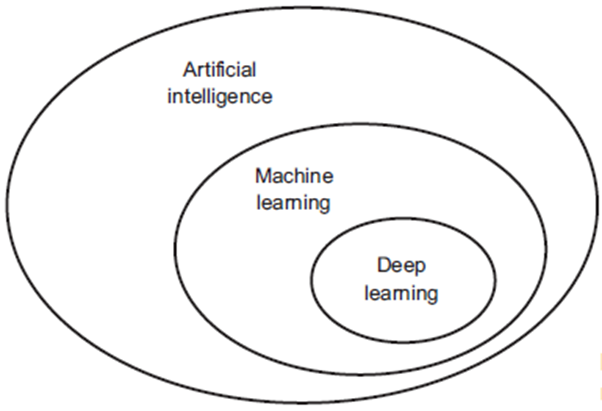
Figure-1: Artificial Intelligence, Machine Learning, and Deep Learning at Work
Due to the capabilities and functionality of an integrated system of AI, ML, and DL as a whole (i.e., See Figure-1), AI powered system and sub-systems have penetrated and been utilized across every industry. With the help of AI, enterprises including medical institutions are effectively dealing with sheer data for analysis. [1]
In the medical field, research is important to find more effective ways to treat patients. AI capabilities help medical institutions not only in collecting important information but also in building models for effective diagnosis and decision making.
With the augmentation of AI system and sub-systems of ML and DL, companies like Netflix know which movies and series people prefer to watch. Based on the data collection they build catalogs based upon the watching habits and behaviors of the consumers.
Amazon knows which items people like to buy when and where, and Google knows various patterns of our web searches such as which health symptoms and conditions people are searching for. AI, along with ML and DL sub-system boosts the search engine such as Google and, drive its Data Analytics (DA) and consequently Predictive Analytics (PA), as effective as it can be. All this data can be used for very detailed personal profiling, which may be of great value for behavioral understanding and targeting and can predict trends in different, multiple areas.
There is great optimism that the application of artificial intelligence (AI) can provide substantial improvements in all areas of economy including commerce, banking, multi-tier organization, with multi-tier operations, such as airline industry, as well as healthcare, from diagnostics to treatment. It is generally believed that AI tools will facilitate and enhance human work and not replace the work of physicians and other healthcare staff as such. There is great optimism that the application of Artificial Intelligence (AI) can provide substantial improvements in all areas of healthcare, from diagnostics to treatment. [2]
It is generally believed that AI tools will facilitate and enhance human work and not replace the work of physicians and other healthcare staff as such. AI is ready to support healthcare personnel with various tasks from administrative workflow to clinical documentation and patient outreach and specialized support such as image analysis, medical device automation, and patient monitoring.[3]
AI applications are growing at fast pace and dominating almost every industry by making their operations efficient and effective. Airline industry is no exception. They need to focus on adopting AI powered machine learning and deep learning technologies to achieve their profit and revenue goals especially during the time of crisis.
COVID 19 pandemic has affected almost all parts of our lives. A large number of industries have been suffering with serious financial difficulties due to an unprecedented and sudden shift in demand and supply. Other factors such as disruptions in regular supply chains and changing customer behavior are negatively affecting businesses’ earning potential.
A Standard and Poor (S&P) Global Market Intelligence study informs that the industry most impacted by COVID-19 disruptions is the Airlines industry (Haydon et al., 2021). [4] The study based its findings on Probability of Default Market Signals model that uses stock price movements and asset volatility as inputs to calculate a one-year probability of default. This signifies that COVID-19 has caused huge financial struggles for airlines around the world. Airlines in such situation need to restore their financial potential using better revenue generation and profit focused strategies.
How much profit each airline will generate depends heavily on the price an airline charges for a ticket to each passenger. Price and demand analysis show a linear pattern, positive correlation on a graph. This says when you raise the price, the demand goes down. Airline demand is also price elastic and therefore charging price too high might lower demand significantly. On the other hand, if prices are too low, the airline might end up incurring serious losses. Price decisions therefore are crucial for airline business success. Airlines need highly effective price optimization models that could help them determine the most suitable price that does not put off the customer and help them generates good profit for each flight.
In this study we are presenting two models for airlines to help them recover from COVID-19 financial breakdown in a speedy and efficient manner. Using these models, airlines will be able to set right prices for each flight and maximize their overall profit.
Moreover, our goal for this short review article and study is around the following issue that is appearing here as “The Problem Statement”.
The Problem Statement:
Due to increase in number of patients carrying corona virous among the population globally and thus, COVID-19 disruptions, airlines have incurred serious losses and now they need to rejuvenate their profit potential. The price of the tickets determines how much revenue each airline will earn. Decisions regarding appropriate ticket price are extremely time consuming and require a lot of effort. The optimization and maximization models in this project will help airlines to set the most suitable prices while maximizing their profits and regaining their financial strength.
2.Literature Review:
Increasing the revenue is the constant pressure for the airline industry, and as the economic slowdown continues, the airline companies continue to worry about how to remain profitable (Sabre Airline Solutions, 2017). [5] Implementing price optimization is one of the areas of focus crucial to airlines looking to link their business volume with revenue growth. Price optimization is a strategy that is used to tell the story of increasing customer satisfaction, discover the key and unique points of differentiation in airlines, and, most importantly, achieve revenue growth (Pande, n.d.). [6]
Ticket prices change on a constant basis and they may be affected by several factors such as past bookings, remaining capacity, average demand per route, the probability of selling more seats later, etc. (Gargi, 2018). [7] Even though optimizing prices is a challenging task, citing various factors, airlines should consider implementing price optimization (Abdella et al., 2020). [8]
Different strategies are used to determine optimal ticket prices as long-term pricing and dynamic pricing. Long-term pricing describes the effect of production conditions on ticket prices. Dynamic pricing is associated with the dynamic adjustment of ticket prices in response to various influencing factors. The long-term pricing is associated with the specific airline's internal working and does not provide help in predicting dynamic fluctuations in price. Also, the dynamic factors are challenging as internal and external factors highly impact it (Abdella et al., 2020). [9]
The only way to improve airline revenue is to make pricing management a strategic priority to determine the optimal ticket price. Also, by this strategy the airlines would benefit to estimate the accurate flight price that will provide insight for the important features of flights in the future (Santos and Gilles, 2019). [10]
To maximize the airlines' value and revenue with price optimization, the airlines need to gain a deep understanding of their market. Once they understand the market, they can align the price with what they value, tracking the price changes and see the improvement over time (Campbell, 2020). [11]
3.Methodology – Models and the Tools
In this study, we are proposing two separate models for price optimization and profit maximization. The details of these models are described and each one briefly stated as follows:
Model 1: Price Optimization:
Model 1 uses Monte Carlo simulation technique to create a simulator that will help airlines set the most suitable price for each flight. We are using Python programming to create this simulator. This model is suitable for the airlines that cannot provide the estimates of their costs.
Model 2: Profit Maximization:
Even though the purpose of this model is profit maximization, this model also optimizes the prices and make recommendation on the best price to charge. To build this model, we are using MS Excel Solver add-in that uses an inbuilt maximization algorithm for profit maximization. This model is different from model 1 and is designed for the airlines that are able to provide estimates on their costs.
4.Models Development and Results
The results of the above modeling assumption are discussed in this section as follows:
Model 1: Price Optimization
As discussed earlier, pricing is key to the revenue, so we want to try and optimize the pricing. We do this by coming up with a pricing function and scoping the inputs first.
For any given airlines for a particular flight the booking starts days in advance. The number of seats available for booking is capped. Like any pricing model there is inverse relationship between price and quantity sold. If there is stronger demand, the airlines can quote higher prices to fill same quantity of seats, increasing the revenue.
Similarly, if there is less demand the airlines might have to bring down the price to increase the quantity of sold seats to ensure more occupancy of the flight.
Figure-2 shows demand (D) as a linear inverse relationship between Price (y-axis) and Quantity (x-axis). Note shifting nature of demand i.e., D1 (higher demand) leads to filling up more seats (Q1) compared to a D2 (lower demand) filling up lesser seats (Q2) for the same price P.
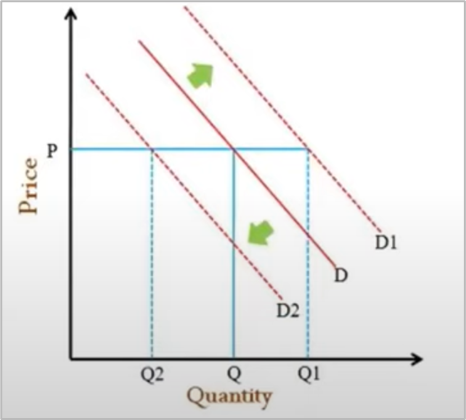
Figure-2: Depiction of Price Vs. Quantity Driven by Demands
From Figure-2 in above, the three inputs to the pricing function are, accordingly, identified as follows:
To simplify further, the pricing function is assumed to be called once each day setting the price.
The revenue is calculated iterative for each day as a product of set price and quantity sold from the demand and aggregated until the flight or the time all tickets are sold to get the final cumulative revenue. We experiment with pricing function and simulate the cumulative revenue repeatedly feeding a probabilistic daily demand.
Numerical Assumption:
For this case it is assumed that demand follows a discrete uniform distribution of the form U [100,200]. Note that this value is y-intercept on the linear demand line in the figure. Assuming a slope of -1 i.e., similar delta in quantity for similar delta in price in reverse direction, a simple equation of quantity sold for a given price is:
Quantity sold (x) = Demand (y-intercept) – Price (y).
Therefore, for each simulated day, the demand equation changes as the demand variable changes taking a value from U [100, 200].
Furthermore, it is assumed there are 100 days left to sell 100 seats for a flight.
Model Implementation and Results:
To develop this model, we used Python coding. The detailed code is available in appendix section. First, we created an aggregating function which is recursive and exits only if there are no days left or all the seats are sold. It calls pricing function with the three inputs as discussed above. A helper function is included to calculate the cumulative revenue given a specific pricing function as an argument. Finally, the recursive call takes care of revising the seats and days left adding the daily revenue to the variable rev_to_date which is finally returned as cumulative revenue.
Monte Carlo Simulation with Linear Pricing Function:
In a first heuristic approach and setting a base line, it is assumed that airlines sell equal number of tickets each day irrespective of the demand. The equation for the price is given as:
Price = Demand–Tickets left/Days left:
left denoted by pf_linear function, in Figure-3 as illustrated below.
The results of this work can be seen in Figure-3.
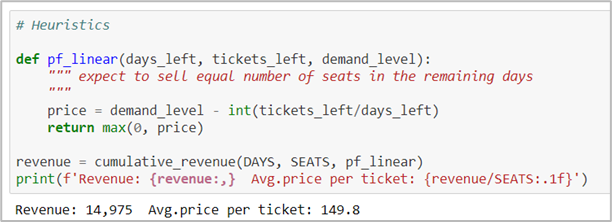
Figure-3: Heuristics Algorithm Presentation
For Monte Carlo simulation we ran this code 10,000 times and histogram for the cumulative revenue was generated and is illustrated in Figure -4, as follows:
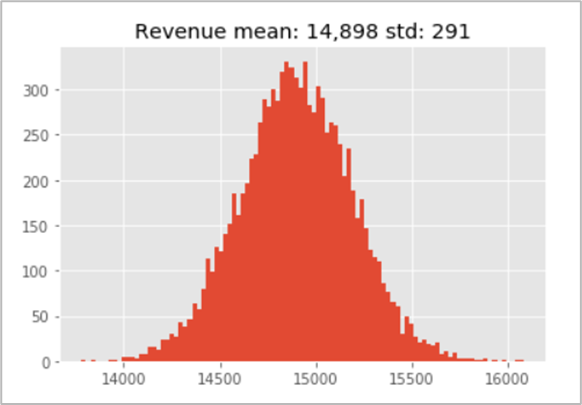
Figure-4: Illustration of Monte Carlo Simulation
From Figure-4, we observe that a mean revenue of 14,898 with a standard deviation of 291 as illustrated in above graph depiction.
Monte Carlo Simulation with Adaptive Pricing Function:
In a second approach we try to factor in demand and test out a strategy to sell more tickets for the days with higher demands. From the demand equation that means a lower price. With this approach it is expected to trade off the price decrease by increase in tickets sold in lesser number of days in case of higher demand.
The pricing equation in this case is:
Price = Demand – (1 + adaptive factor * Demand) * (Tickets left/ Days left):
Note that: The equation allows additional tickets selling for same demand compared to Linear Pricing function by addition of term adaptive factor * Demand. This is same as linear pricing function if adaptive factor is set to 0. See Figure-5.
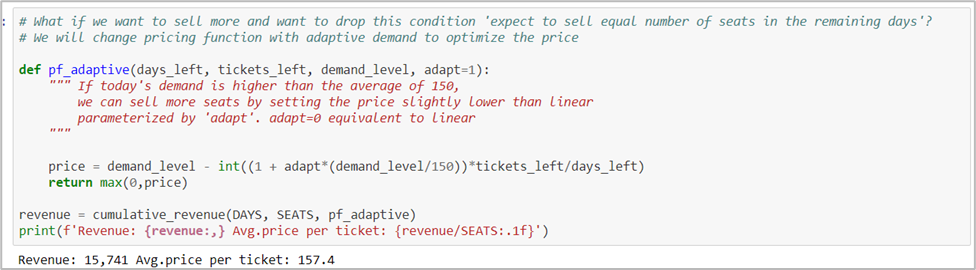
Figure-5: Algorithm of the above Formulation
Finally, the Monte Carlo simulation was repeated with adaptive factor set to 2 to obtain following histogram of cumulative revenue as illustrated in Figure-6.
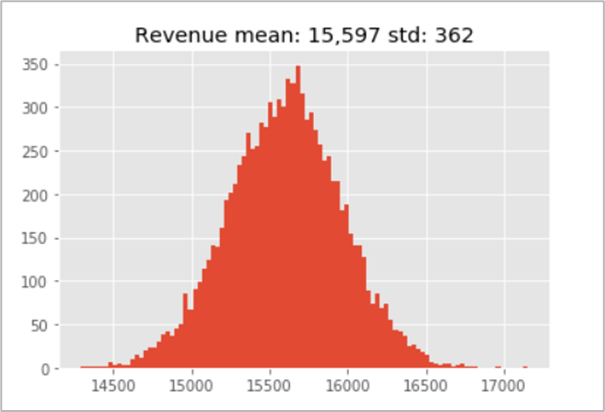
Figure-6: Histogram of Cumulative Revenue
An increase in average revenue to 15,597 is observed with a larger standard deviation of 362.
The simulation was also tried with multiple adaptive factors ranging between 0 and 9 to select a better value. The chart below as illustrated in Figure-7, shows a cumulative revenue slightly above $15,600 is observed for adaptive factor of 3.
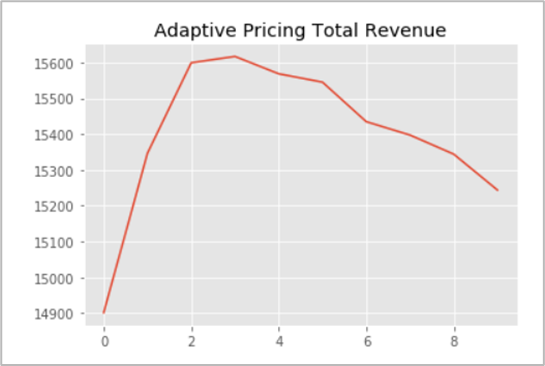
Figure-7: Adaptive Pricing Total Revenue
This method opens possibilities of testing out several other pricing strategies and compare them measuring their impact using Monte Carlo simulation. Besides pricing it can further help to get more data on things like number of days taken to fill the seats which then can be used to create more strategies. This model was originally created for Kaggle Mini Courses - Airline Price Optimization Microchallenge (Zoto. G., 2020). [12]
Model 2: Profit Maximization:
This matter can be describing via model assumption and properties as follow:
Model Assumption and Properties:
To start, we need to list down these important assumptions:
Airline price and demand relationship is an example of a linear programming model. In order to create an effective model for airline profit maximization we need to first explain key properties of this model:
Furthermore, the problem maybe restated mathematically in the following form as:
Maximized Profit = (demand*best price)
Subject to: PPC ≤ $85
Model Implementation and Results:
After clarifying the assumptions and properties of our problem, we will implement the model using Excel Solver add-in. To create this model. For purpose of this model, we took the following steps:
Step 1: Creating the demand function.
From our explanation above we know that 1% increase in airline price will cause 1.146% decrease in demand.
In MS Excel workbook, we will create two columns and two rows to explain: See Table-1 for more details
|
|
Price |
Demand |
|
Current |
120 |
500 |
|
Adjusted |
121.2 |
494.27 |
Table-1: Excel Spread Sheet
Row 1: current price and demand (capacity); (cell number: A2, B2)
Row 2: adjusted price and demand - price increase of 1% causing demand decrease of 1.146%. (A3, B3).
Using this information, we have created Figure-8 – the scatter chart for airline demand function that also includes the demand equation based upon the estimates that we provided. Prices are set at the x-axis whereas demand is on y-axis. In this case the curve correlation formula is given by:
Demand curve formula: 1073 – 4.775*p
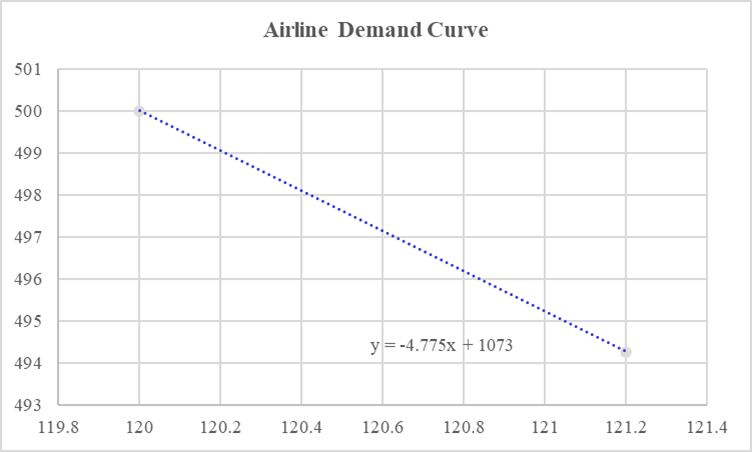
Figure-8: MS Excel Driving, the Airline demand Curve
Step 2: Insert the cost and best price estimate.
Step 3: Insert demand formula and calculate the demand.
1073 – 4.775*150 (best price) = 356.75
Step 4: Insert profit equation and calculate the profit.
price – unit cost * demand
150 – 85 * 356.75 = 23188.75
The completed calculations in Excel can be seen in Table-2.

Table-2: Excel Calculations of Parameters
Step 5: Open Excel Solver add in, insert the parameters, and calculate the maximized profit. The MS Excel® Macro is presented in Figure-9
When Solver performs functions, it alters the original figures. Therefore, to keep original data intact, we keep it separate in top blue colored area. We performed Solver calculations on red colored figures.
In Figure-8, you can see, we have selected $B$19, which is the profit – our objective that needs to be maximized. We have selected best price $B$17, as a variable that needs to be changed/optimized. The solving method chosen is GRG non-linear. This does not say the problem is non-linear. This method is used to obtain a good solution for the function to be smooth.
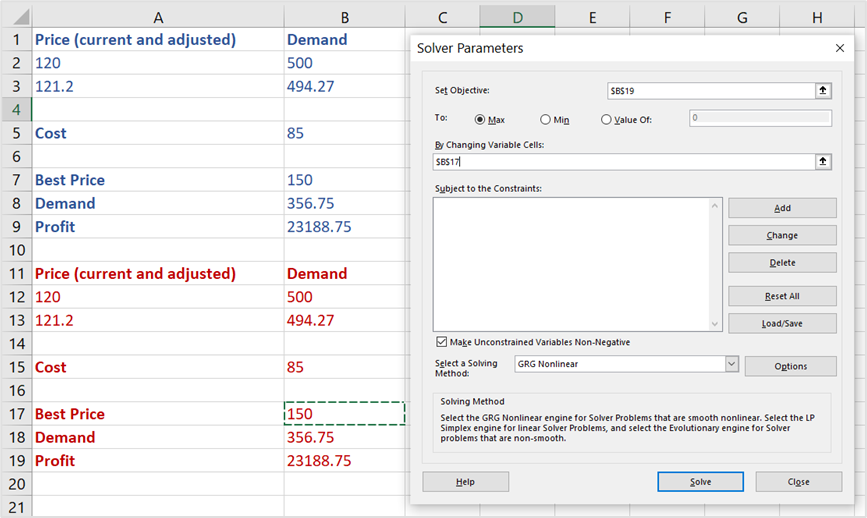
Figure-9: MS Excel Macro Driving all above Step
Upon clicking Solve, the Solver, changes the data under operation by inserting the optimized and maximized values automatically. In Figure-10, you can see the maximized profit is $23301.35 approximately. This is higher than what we calculated originally ($23188.75). Considering the fact that this is the case of 3 flights offered by an airline (Boeing 737 planes can accommodate 186 passengers), imagine how much more the airline can earn if it offers 10 flights every day for 365 days in a year. The solution also optimized the best price which is $154.85 now.
Solver model has performed highly effective calculations on optimizing the price for us. The model shows - if airline charges $154.85 per ticket, it can earn ~$23301.35. Let us compare this model with the one that we created using basic Excel calculations. In our original model, we were charging less price, $150 and fulfilling the demand of 357 passengers. In total we were earning $23188.75. Using new model, we will charge $4.85 more per ticket, but we will also earn $112.6 more. The demand in case of our new model has declined by 23 passengers (357-334) but this also means we are saving our cost of serving 23 more customers. Using this model, airlines can maximize their profits and earn much higher income in both their domestic and international business.
5.Conclusion and Recommendations:
Airlines in the United States have incurred serious losses during COVID 19 pandemic. Even though active COVID 19 cases are still on rise, people have started to plan their travels. This is the time when airlines need to rejuvenate their revenue and profit potential by applying effective models that help them to maximize profits while optimizing the prices. The price of the airline ticket is a key determinant of how much profit an airline earns on the sale of each ticket. In general, airlines follow yield management strategy of pricing according to which, prices are adjusted with reference to demand. This is a variable pricing strategy where each price point makes a significant difference to demand, revenue, and profit.
When pricing is so crucial for business success, airlines cannot bear to take risk. In this report, we are sharing two models that can help airlines to set the best prices for their tickets without spending too much time and effort. Model 1 is created using Python programming. This model can be used to optimize prices in both the situations – when demand is uniform (selling almost equal number of tickets every day) and when it is variable. In first situation, we use a linear pricing function and in second situation, when demand is not uniform, we use adaptive pricing function. By running the Monte Carlo simulation, they can see how much revenue they will earn on a specific price point in both these situations. For example, upon running the simulation on second situation we could see the maximum revenue that we can earn on $157.4 price, will be $15,600.
Model 2 on the other hand is created for profit maximization using MS Excel, Solver add-in. This model helps airlines that can provide some estimates on their costs. This model uses cost as an important determinant of profit. We defined the objective function, constraints, and decision variables that need to be considered while building this model. We included demand and profit equations, ran Solver for profit maximization, and as a result, Solver optimized the prices (recommended best price) and presented maximum profit numbers.
Both of these models are developed with estimates for domestic travel. However, they can also be applied for international travel optimization and maximization. In the latter case, we will only need to adjust demand, prices, and costs according to international flight economic analysis. Since the demand for air travel will start to increase soon, more airlines will need such models. Decision makers will certainly need some training to understand how these models work. Therefore, we recommend providing orientation, and some technical training to the key decision makers and important staff before introducing these models.
In our view, model 2 is more convenient to use. We recommend this model over model 1 however, we understand the limitation of cost estimates in real life situations. This is the reason why we created model 1 – if you cannot know your costs every day, you can still determine the best price using model 1. From part of the staff, there might be some reluctance due to the need of learning but once they understand the worth of it, they will appreciate the value that these models have to offer.
6.Appendices:
Here, we are showing the parameters and convention were used in Python and Excel Model code.
Model 1- Price Optimization
import numpy as np
import time
from functools import partial
import matplotlib.pyplot as plt
from matplotlib import cm
plt.style.use('ggplot')
DAYS = 100 # longest period
SEATS = 100 # maximum seats
DEMAND_MIN = 100
DEMAND_MAX = 200
# Defining the cumulative revenue function
def cumulative_revenue (days_left,
tickets_left,
pricing_function,
rev_to_date = 0,
demand_min = DEMAND_MIN,
demand_max = DEMAND_MAX,):
""" helper function that calculates the cumulative revenue
given a specific pricing function as an argument"""
if days_left>0 and tickets_left>0: # if there are days and tickets left
demand = np.random.randint(demand_min, demand_max+1) # D -- demand level ~U [100, 200]
p = pricing_function (days_left, tickets_left, demand) # P -- Pricing function to optimize
q = demand - p # Q -- tickets sold during the day
q = max (0, q)
q = min (tickets_left, q) # cannot sell more tickets than what are left
return cumulative_revenue(days_left = days_left - 1,
tickets_left = tickets_left - q,
pricing_function = pricing_function,
rev_to_date = rev_to_date + p*q)
else:
return rev_to_date
# Heuristics
def pf_linear (days_left, tickets_left, demand_level):
""" expect to sell equal number of seats in the remaining days"""
price = demand_level - int(tickets_left/days_left)
return max (0, price)
revenue = cumulative revenue (DAYS, SEATS, pf_linear)
print (f'Revenue: {revenue:} Avg.price per ticket: {revenue/SEATS:.1f}')
Revenue: 14,975 Avg.price per ticket: 149.8
# Simulation - Monte Carlo Simulation with 10000 runs
sim = [cumulative_revenue (DAYS, SEATS, pf_linear) for _ in range (10_000)]
plt.hist(sim, bins=100)
plt.title(f'Revenue mean: {np.mean(sim):,.0f} std: {np.std(sim):,.0f}')
Text (0.5, 1.0, 'Revenue mean: 14,898 std: 291')
# What if we want to sell more and want to drop this condition 'expect to sell equal number of seats in the remaining days'?
# We will change pricing function with adaptive demand to optimize the price.
def pf_adaptive(days_left, tickets_left, demand_level, adapt=1):
""" If today's demand is higher than the average of 150, we can sell more seats by setting the price slightly lower than linear parameterized by 'adapt'. adapt=0 equivalent to linear"""
price = demand_level - int ((1 + adapt*(demand_level/150))*tickets_left/days_left)
return max (0, price)
revenue = cumulative revenue (DAYS, SEATS, pf_adaptive)
print (f'Revenue: {revenue:} Avg.price per ticket: {revenue/SEATS:.1f}')
Revenue: 15,741 Avg.price per ticket: 157.4
# Simulation - Monte Carlo Simulation with 10000 runs
sim = [cumulative_revenue (DAYS, SEATS, partial (pf_adaptive, adapt=2)) for _ in range (10_000)]
plt.hist(sim, bins=100)
plt.title(f'Revenue mean: {np.mean(sim):,.0f} std: {np.std(sim):,.0f}')
Text (0.5, 1.0, 'Revenue mean: 15,597 std: 362')
# Determining the maximum revenue on this optimized price
means = []
for w in range (10):
sim = [cumulative_revenue(DAYS, SEATS, partial(pf_adaptive, adapt=w)) for _ in range(1_000)]
means.append(np.mean(sim))
plt.plot(means)
plt.title('Adaptive Pricing Total Revenue')
Text (0.5, 1.0, 'Adaptive Pricing Total Revenue')


Open Access By Aditum Open Access Journals id licensed under Creative Commons Attribution 4.0 International License. Based On a Work at aditum.org